Analysis Summary
Notes:
- 1) No attempt has been made to eliminate the non-significant decimal places.
- 2) This batgrbproduct analysis is done using the HEASARC data.
- 3) This batgrbproduct analysis is using the flight position for the mask-weighting calculation.
======================================================================
                  BAT GRB EVENT DATA PROCESSING REPORT
    Process Script Ver: batgrbproduct v2.46
    Process Start Time: Wed Jan  4 17:26:22 EST 2017
             Host Name: bat1
   Current Working Dir: /local/data/bat1/alien/Swift_3rdBATcatalog/event/batevent_reproc/trigger727610
======================================================================

  Trigger: 00727610      Segment: 000

  BAT Trigger Time: 503915627.584   [s; MET]
      Trigger Stop: 503915629.632   [s; MET]
               UTC: 2016-12-20T08:33:30.249440    [includes UTCF correction]
       Where From?: TDRSS position message

  BAT
    RA: 350.81656549025   Dec: -47.5022510820833  [deg; J2000]

     Catalogged Source?: NO
     Point Source?:      YES
     GRB Indicated?:     YES    [ by BAT flight software ]
     Image S/N Ratio:    7
     Image Trigger?:     NO
     Rate S/N Ratio:     11.0453610171873  [ if not an image trigger ]
     Image S/N Ratio:    7

  Analysis Position:   [ source = BAT ]
    RA: 350.81656549025   Dec: -47.5022510820833  [deg; J2000]

  Refined Position:   [ source = BAT pre-slew burst ]
    RA: 350.858842205059   Dec: -47.4828483504164  [deg; J2000]
        { 23h 23m 26.1s , -47d 28' 58.3" }
         +/- 1.94025465402919 [arcmin] (estimated 90% radius based on SNR)
         +/- 0.959706663365842 [arcmin] (formal 1-sigma fit error)
    SNR: 11.8002611129105

  Angular difference between the analysis and refined position is 2.071930 arcmin

  Partial Coding Fraction: 1    [ including projection effects ]

  Duration
     T90: 7.21999996900558 +/- 1.75425425941067
        Measured from: -3.05199998617172
                   to: 4.16799998283386     [s; relative to TRIGTIME]
     T50: 3.5359999537468 +/- 0.812406309563098
        Measured from: -0.61599999666214
                   to: 2.91999995708466     [s; relative to TRIGTIME]


  Fluence
     Peak Flux  (peak 1 second)
        Measured from: 2.4200000166893
                   to: 3.4200000166893     [s; relative to TRIGTIME]
     Total Fluence
        Measured from: -3.42799997329712
                   to: 4.46399998664856     [s; relative to TRIGTIME]

             Band 1     Band 2     Band 3     Band 4
              15-25      25-50     50-100    100-350     keV
 Total     0.149387   0.142029   0.081898   0.008882
           0.017136   0.017565   0.014904   0.013305 [error]
 Peak      0.034670   0.020518   0.015973   0.004675
           0.006309   0.006345   0.005329   0.004735 [error]

     [ fluence units of on-axis counts / fully illuminated detector ]

======================================================================


====== Table of the duration information =============================

        Value   tstart    tstop
T100    7.892   -3.428    4.464
T90     7.220   -3.052    4.168
T50     3.536   -0.616    2.920
Peak    1.000    2.420    3.420


====== Spectral Analysis Summary =====================================

Model      : spectral model: simple power-law (PL) and cutoff power-law (CPL)
Ph_index   : photon index: E^{Ph_index}
Ph_90err   : 90% error of the photon index
Epeak      : Epeak in keV
Epeak_90err: 90% error of Epeak
Norm       : normalization at 50 keV in both the PL model and CPL model
Nomr_90err : 90% error of the normalization
chi2       : Chi-Squared
dof        : degree of freedo

=== Time-averaged spectral analysis ===
(Best model with acceptable fit: N/A)

Model Ph_index Ph_90err_low Ph_90err_hi  Epeak  Epeak_90err_low  Epeak_90err_hi  Norm       Nomr_90err_low    Norm_90err_hi    chi2    dof
PL      -2.014    -0.262      0.242       -           -               -         2.53e-03     -4.58e-04          4.45e-04      78.990   57
CPL     -1.388    -0.754      1.094       39.510      N/A           N/A         5.95e-03        N/A               N/A         77.580   56


=== 1-s peak spectral analysis ===
(Best model with acceptable fit: N/A)

Model Ph_index Ph_90err_low Ph_90err_hi  Epeak  Epeak_90err_low  Epeak_90err_hi  Norm       Nomr_90err_low    Norm_90err_hi    chi2    dof
PL      -2.174     -0.596     0.489       -           -               -         3.47e-03     -1.38e-03          1.31e-03      73.720   57
CPL     -2.181     -1.004     1.584      273.931      N/A           N/A         3.39e-03        N/A               N/A         73.700   56


=== Fluence/Peak Flux Summary ===

              Model    Band1     Band2     Band3     Band4     Band5     Total
                       15-25     25-50    50-100    100-350    15-150    15-350    keV
Fluence         PL   4.14e-08  5.57e-08  5.51e-08  9.83e-08  1.84e-07  2.51e-07   erg/cm2
      90%_error_low -7.23e-09 -7.63e-09 -1.32e-08 -3.92e-08 -3.06e-08 -5.66e-08   erg/cm2
      90%_error_hi   7.38e-09  7.57e-09  1.37e-08  5.36e-08  3.16e-08  6.81e-08   erg/cm2
Peak flux       PL   2.74e-01  1.86e-01  8.23e-02  5.05e-02  5.67e-01  5.93e-01   ph/cm2/s
      90%_error_low -8.69e-02 -5.07e-02 -4.00e-02 -3.45e-02 -1.41e-01 -1.52e-01   ph/cm2/s
      90%_error_hi   8.85e-02  4.85e-02  4.39e-02  6.36e-02  1.41e-01  1.54e-01   ph/cm2/s

Fluence        CPL   3.97e-08  6.03e-08  5.30e-08  3.31e-08  1.73e-07  1.86e-07   erg/cm2
      90%_error_low -7.92e-09 -9.99e-09 -1.59e-08 -2.61e-08 -3.22e-08 -4.35e-08   erg/cm2
      90%_error_hi   7.86e-09  1.03e-08  1.51e-08  1.03e-07  3.50e-08  1.03e-07   erg/cm2
Peak flux      CPL   2.74e-01  1.81e-01  8.03e-02  5.68e-02  5.61e-01  5.91e-01   ph/cm2/s
      90%_error_low -9.66e-02 -1.12e-01     N/A       N/A       N/A   -1.97e-01   ph/cm2/s
      90%_error_hi   8.88e-02  6.05e-02     N/A       N/A       N/A    1.65e-01   ph/cm2/s

======================================================================
Image
Pre-slew 15.0-350.0 keV image (Event data)
#   RAcent    DECcent   POSerr    Theta     Phi              Peak Cts       SNR   Name
  350.8588   -47.4828   0.0161     3.3436  -179.8910         0.3680266     11.800 TRIG_00727610

Foreground time interval of the image:
 -3.428   4.464 (delta_t =   7.892 [sec])
Background time interval of the image:
-576.183 -559.744 (delta_t =  16.439 [sec])
-239.584  -3.428 (delta_t = 236.156 [sec])
Light Curves
Note: The mask-weighted lightcurves have units of either count/det or counts/sec/det, where a det is 0.4 x 0.4 = 0.16 sq cm.
Full-time range; 1 s binning
Other quick-look light curves:
- 64 ms binning (zoomed)
- 16 ms binning (zoomed)
- 8 ms binning (zoomed)
- 2 ms binning (zoomed)
- SN=5 or 10 s binning (full-time range)
- Raw light curve
Spectra
- 64 ms binning (zoomed)
- 16 ms binning (zoomed)
- 8 ms binning (zoomed)
- 2 ms binning (zoomed)
- SN=5 or 10 s binning (full-time range)
- Raw light curve
Spectra
Notes:
- 1) The fitting includes the systematic errors.
- 2) When the burst includes telescope slew time periods, the fitting uses an average response file made from multiple 5-s response files through out the slew time plus single time preiod for the non-slew times, and weighted by the total counts in the corresponding time period using addrmf. An average response file is needed becuase a spectral fit using the pre-slew DRM will introduce some errors in both a spectral shape and a normalization if the PHA file contains a lot of the slew/post-slew time interval.
- 3) For fits to more complicated models (e.g. a power-law over a cutoff power-law), the BAT team has decided to require a chi-square improvement of more than 6 for each extra dof.
Time averaged spectrum fit using the average DRM
Power-law model
Time interval is from   -3.428 sec. to    4.464 sec.

Spectral model in power-law:
------------------------------------------------------------
Parameters  : value       lower 90%   higher 90%
Photon index: -2.01424     ( -0.261935   0.241764 )
Norm@50keV  : 2.52918E-03    ( -0.000457764   0.000445284 )
------------------------------------------------------------
#Fit statistic : Chi-Squared =          78.99 using 59 PHA bins.
# Reduced chi-squared =          1.386 for     57 degrees of freedom
# Null hypothesis probability =   2.856032e-02

Photon flux (15-150 keV)    in 7.892 sec: 0.381912 ( -0.05057  0.050572 ) ph/cm2/s
Energy fluence (15-150 keV)             : 1.8425e-07 ( -3.05735e-08  3.15928e-08 ) ergs/cm2
Cutoff power-law model
Time interval is from   -3.428 sec. to    4.464 sec.
Spectral model in the cutoff power-law:
------------------------------------------------------------
Parameters  : value       lower 90%   higher 90%
Photon index: -1.38797     ( -0.754358   1.09426 )
Epeak [keV] : 39.5104      (   )
Norm@50keV  : 5.95041E-03    (     )
------------------------------------------------------------
#Fit statistic : Chi-Squared =          77.58 using 59 PHA bins.
# Reduced chi-squared =          1.385 for     56 degrees of freedom
# Null hypothesis probability =   2.972149e-02

Photon flux (15-150 keV)    in 7.892 sec: 0.374994 ( -0.051105  0.051316 ) ph/cm2/s
Energy fluence (15-150 keV)             : 1.72821e-07 ( -3.22144e-08  3.50129e-08 ) ergs/cm2
1-s peak spectrum fit
Power-law model
Time interval is from    2.420 sec. to    3.420 sec.

Spectral model in power-law:
------------------------------------------------------------
Parameters  : value       lower 90%   higher 90%
Photon index: -2.17406     ( -0.595524   0.488602 )
Norm@50keV  : 3.47182E-03    ( -0.00138059   0.00130721 )
------------------------------------------------------------
#Fit statistic : Chi-Squared =          73.72 using 59 PHA bins.
# Reduced chi-squared =          1.293 for     57 degrees of freedom
# Null hypothesis probability =   6.739804e-02

Photon flux (15-150 keV)    in 1 sec: 0.567101 ( -0.140719  0.14086 ) ph/cm2/s
Energy fluence (15-150 keV)             : 3.25349e-08 ( -1.05649e-08  1.14071e-08 ) ergs/cm2
Cutoff power-law model
Time interval is from    2.420 sec. to    3.420 sec.
Spectral model in the cutoff power-law:
------------------------------------------------------------
Parameters  : value       lower 90%   higher 90%
Photon index: -2.18098     ( -1.00007   1.58849 )
Epeak [keV] : 273.931      (   )
Norm@50keV  : 3.39289E-03    (     )
------------------------------------------------------------
#Fit statistic : Chi-Squared =          73.70 using 59 PHA bins.
# Reduced chi-squared =          1.316 for     56 degrees of freedom
# Null hypothesis probability =   5.653754e-02

Photon flux (15-150 keV)    in 1 sec: 0.560628 (    ) ph/cm2/s
Energy fluence (15-150 keV)             : 0 ( 0  0 ) ergs/cm2
Time-resolved spectra
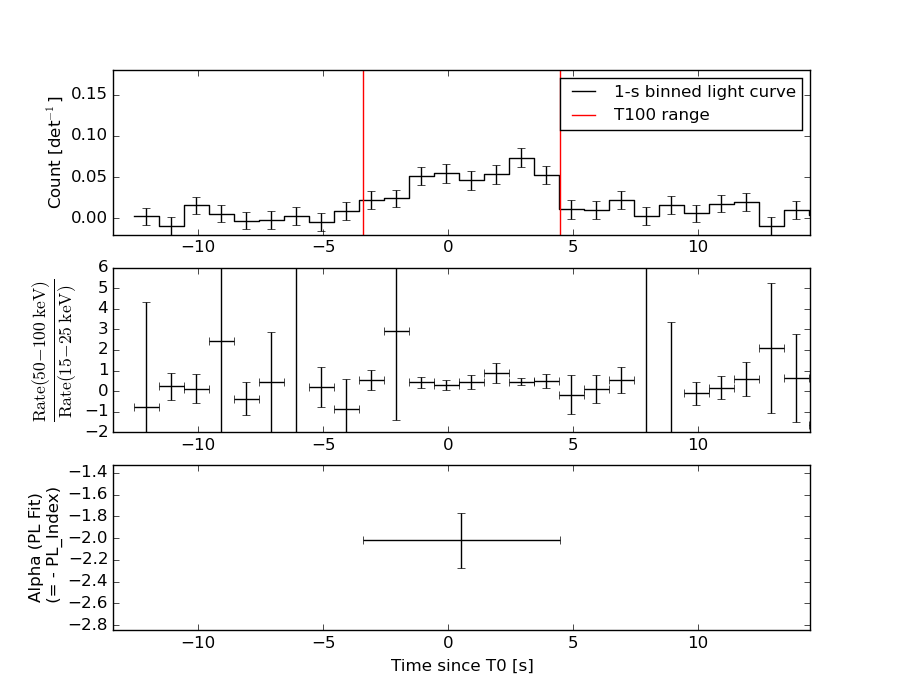
Distribution
T90 vs. Hardness ratio plot
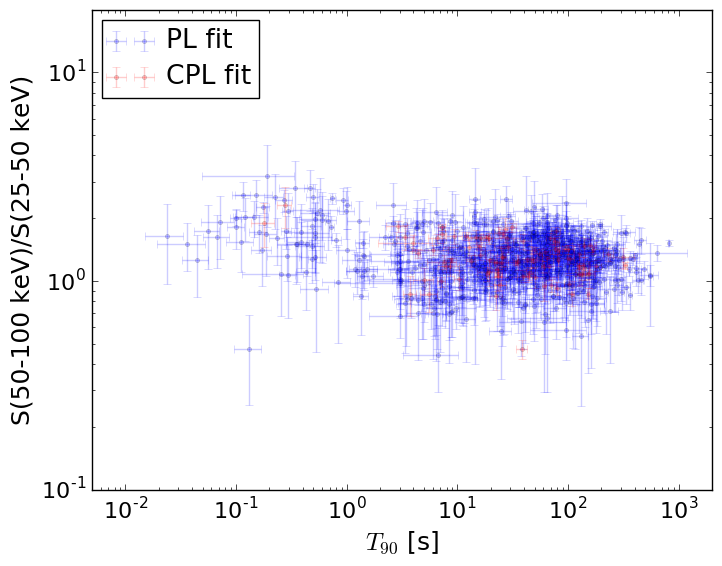
T90                                   = N/A sec.
Hardness ratio (energy fluence ratio) = N/A
S(15-50 keV) vs. S(50-150 keV) plot
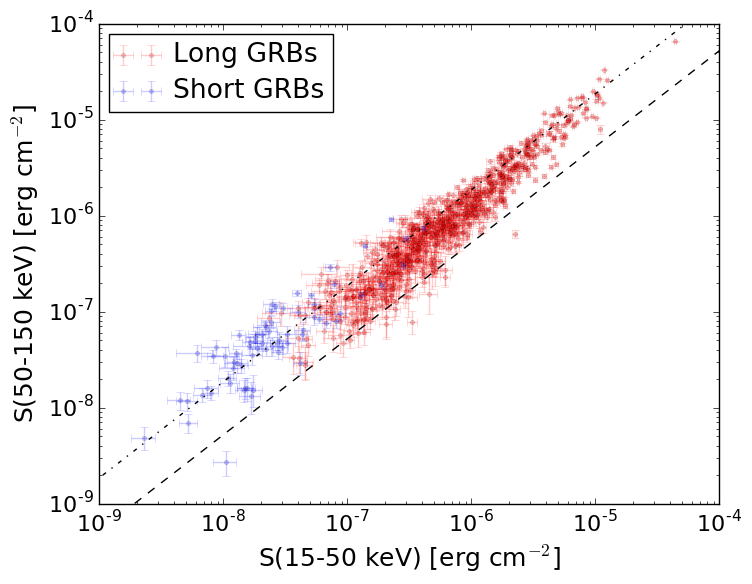
S(15-50 keV)  = N/A
S(50-150 keV) = N/A
The dash-dotted line and the dashed line traces the fluences calculated from the Band function with Epeak = 15 and 150 keV, respectively. Both lines assume a canonical values of alpha = -1 and beta = -2.5.
Mask shadow pattern
IMX = -5.842229921328191E-02, IMY = 1.111033683784135E-04
Spacecraft aspect plot
Bright source in the pre-burst/pre-slew/post-slew images
Pre-burst image of 15-350 keV band
Time interval of the image:
-576.183400 -559.744000
-239.584000 -3.428000

# RAcent  DECcent POSerr Theta    Phi  PeakCts   SNR AngSep     Name
#  [deg]    [deg]    ['] [deg]  [deg]                   [']
359.3279   7.1626    2.7  52.2   29.5   5.4665   4.3  431.6	UNKNOWN
 77.1081 -60.3212    2.6  51.6  157.9   4.2755   4.4 ------	UNKNOWN
 18.1142 -38.5543    2.7  22.1  102.1   1.1505   4.2 ------	UNKNOWN
343.3834   5.2701    2.6  49.9    9.2   2.4794   4.4 ------	UNKNOWN
313.0101   3.8337    2.4  58.1  -27.2   7.4635   4.8 ------	UNKNOWN
305.6220 -10.3598    4.0  50.7  -44.6   3.5451   2.9 ------	UNKNOWN
Pre-slew background subtracted image of 15-350 keV band
Time interval of the image:
-3.428000 4.464000

# RAcent  DECcent POSerr Theta    Phi  PeakCts   SNR AngSep     Name
#  [deg]    [deg]    ['] [deg]  [deg]                   [']
  1.2577 -34.0501    2.2  13.7   62.8   0.1704   5.3 ------	UNKNOWN
350.8588 -47.4829    1.0   3.3 -179.9   0.3681  11.8 ------	UNKNOWN
Post-slew image of 15-350 keV band
Time interval of the image:
56.716590 97.366000
98.416000 962.483600

# RAcent  DECcent POSerr Theta    Phi  PeakCts   SNR AngSep     Name
#  [deg]    [deg]    ['] [deg]  [deg]                   [']
 22.0403 -23.0114    3.7  34.9   67.6   4.2215   3.1 ------	UNKNOWN
352.8748  -7.6631    3.1  39.9   14.3   2.8734   3.7 ------	UNKNOWN
357.7353 -29.8542    2.7  18.4   30.4   2.1623   4.2 ------	UNKNOWN
341.4895   7.2342    2.9  55.3   -0.2   8.0950   3.9 ------	UNKNOWN
324.0279  -9.2389    2.5  44.5  -28.4   4.6382   4.7 ------	UNKNOWN
213.5274 -71.4788    4.0  57.2 -154.1  12.5427   2.9 ------	UNKNOWN
310.4142  -9.9585    4.8  50.6  -44.6   8.1130   2.4 ------	UNKNOWN