Analysis Summary
Notes:
- 1) No attempt has been made to eliminate the non-significant decimal places.
- 2) This batgrbproduct analysis is done using the HEASARC data.
- 3) This batgrbproduct analysis is using the flight position for the mask-weighting calculation.
======================================================================
                  BAT GRB EVENT DATA PROCESSING REPORT
    Process Script Ver: batgrbproduct v2.46
    Process Start Time: Fri Feb 10 13:44:38 EST 2017
             Host Name: bat1
   Current Working Dir: /local/data/bat1/alien/Swift_3rdBATcatalog/event/batevent_reproc/trigger731887
======================================================================

  Trigger: 00731887      Segment: 000

  BAT Trigger Time: 505787626.624   [s; MET]
      Trigger Stop: 505787630.72   [s; MET]
               UTC: 2017-01-11T00:33:28.182060    [includes UTCF correction]
       Where From?: TDRSS position message

  BAT
    RA: 20.7174783857572   Dec: -32.540066578583  [deg; J2000]

     Catalogged Source?: NO
     Point Source?:      YES
     GRB Indicated?:     YES    [ by BAT flight software ]
     Image S/N Ratio:    8.62
     Image Trigger?:     NO
     Rate S/N Ratio:     12.5299640861417  [ if not an image trigger ]
     Image S/N Ratio:    8.62

  Analysis Position:   [ source = BAT ]
    RA: 20.7174783857572   Dec: -32.540066578583  [deg; J2000]

  Refined Position:   [ source = BAT pre-slew burst ]
    RA: 20.6911536665836   Dec: -32.5433455127722  [deg; J2000]
        { 01h 22m 45.9s , -32d 32' 36.0" }
         +/- 1.75424785571089 [arcmin] (estimated 90% radius based on SNR)
         +/- 0.893121261308565 [arcmin] (formal 1-sigma fit error)
    SNR: 13.6275259166587

  Angular difference between the analysis and refined position is 1.345960 arcmin

  Partial Coding Fraction: 0.4492188    [ including projection effects ]

  Duration
     T90: 29.8759999275208 +/- 9.71116986695626
        Measured from: -12.2639999985695
                   to: 17.6119999289513     [s; relative to TRIGTIME]
     T50: 10.4799999594688 +/- 2.51501092298271
        Measured from: -5.4200000166893
                   to: 5.05999994277954     [s; relative to TRIGTIME]


  Fluence
     Peak Flux  (peak 1 second)
        Measured from: 2.08399999141693
                   to: 3.08399999141693     [s; relative to TRIGTIME]
     Total Fluence
        Measured from: -13.5879999995232
                   to: 25.3240000009537     [s; relative to TRIGTIME]

             Band 1     Band 2     Band 3     Band 4
              15-25      25-50     50-100    100-350     keV
 Total     0.416881   0.495910   0.372774   0.073434
           0.049630   0.052304   0.046380   0.041823 [error]
 Peak      0.031408   0.043242   0.030534   0.002473
           0.008087   0.009240   0.007944   0.006625 [error]

     [ fluence units of on-axis counts / fully illuminated detector ]

======================================================================


====== Table of the duration information =============================

        Value   tstart    tstop
T100   38.912  -13.588   25.324
T90    29.876  -12.264   17.612
T50    10.480   -5.420    5.060
Peak    1.000    2.084    3.084


====== Spectral Analysis Summary =====================================

Model      : spectral model: simple power-law (PL) and cutoff power-law (CPL)
Ph_index   : photon index: E^{Ph_index}
Ph_90err   : 90% error of the photon index
Epeak      : Epeak in keV
Epeak_90err: 90% error of Epeak
Norm       : normalization at 50 keV in both the PL model and CPL model
Nomr_90err : 90% error of the normalization
chi2       : Chi-Squared
dof        : degree of freedo

=== Time-averaged spectral analysis ===
(Best model with acceptable fit: PL)

Model Ph_index Ph_90err_low Ph_90err_hi  Epeak  Epeak_90err_low  Epeak_90err_hi  Norm       Nomr_90err_low    Norm_90err_hi    chi2    dof
PL      -1.627    -0.207      0.202       -           -               -         2.25e-03     -2.78e-04          2.74e-04      46.400   57
CPL     -1.571    -0.793      0.664      357.570    -357.570      -357.570      2.41e-03     -1.64e-03          2.94e-03      46.430   56


=== 1-s peak spectral analysis ===
(Best model with acceptable fit: PL)

Model Ph_index Ph_90err_low Ph_90err_hi  Epeak  Epeak_90err_low  Epeak_90err_hi  Norm       Nomr_90err_low    Norm_90err_hi    chi2    dof
PL      -1.550     -0.394     0.378       -           -               -         6.86e-03     -1.77e-03          1.73e-03      52.570   57
CPL     -0.664     -1.185     2.117       69.188     -19.083       -69.188      2.11e-02     -2.11e-02          3.11e-01      51.500   56


=== Fluence/Peak Flux Summary ===

              Model    Band1     Band2     Band3     Band4     Band5     Total
                       15-25     25-50    50-100    100-350    15-150    15-350    keV
Fluence         PL   1.26e-07  2.14e-07  2.77e-07  7.25e-07  8.16e-07  1.34e-06   erg/cm2
      90%_error_low -2.23e-08 -2.43e-08 -4.61e-08 -2.23e-07 -1.08e-07 -2.69e-07   erg/cm2
      90%_error_hi   2.30e-08  2.42e-08  4.62e-08  2.83e-07  1.10e-07  3.18e-07   erg/cm2
Peak flux       PL   2.96e-01  2.89e-01  1.98e-01  2.12e-01  8.68e-01  9.95e-01   ph/cm2/s
      90%_error_low -1.04e-01 -7.19e-02 -6.24e-02 -1.06e-01 -2.10e-01 -2.45e-01   ph/cm2/s
      90%_error_hi   1.12e-01  7.13e-02  6.20e-02  1.52e-01  2.10e-01  2.48e-01   ph/cm2/s

Fluence        CPL   1.26e-07  2.14e-07  2.77e-07  7.48e-07  8.18e-07  1.36e-06   erg/cm2
      90%_error_low -2.25e-08 -2.35e-08 -4.63e-08 -5.22e-07 -1.22e-07 -5.37e-07   erg/cm2
      90%_error_hi   1.94e-08  2.70e-08  4.76e-08  1.33e-07  8.67e-08  1.53e-07   erg/cm2
Peak flux      CPL   2.68e-01  3.24e-01  2.08e-01  7.90e-02  8.55e-01  8.80e-01   ph/cm2/s
      90%_error_low -1.17e-01 -9.12e-02 -7.71e-02 -7.90e-02 -2.11e-01 -2.28e-01   ph/cm2/s
      90%_error_hi   1.22e-01  1.01e-01  7.35e-02  1.87e-01  2.11e-01  2.94e-01   ph/cm2/s

======================================================================
Image
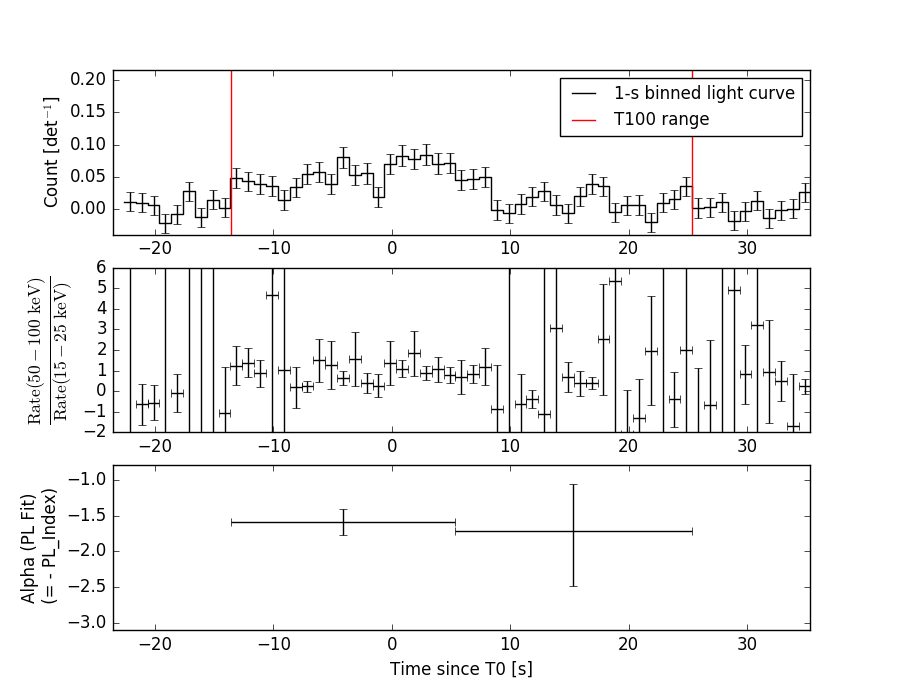
Light Curves
Note: The mask-weighted lightcurves have units of either count/det or counts/sec/det, where a det is 0.4 x 0.4 = 0.16 sq cm.
Full-time range; 1 s binning
Other quick-look light curves:
- 64 ms binning (zoomed)
- 16 ms binning (zoomed)
- 8 ms binning (zoomed)
- 2 ms binning (zoomed)
- SN=5 or 10 s binning (full-time range)
- Raw light curve
Spectra
- 64 ms binning (zoomed)
- 16 ms binning (zoomed)
- 8 ms binning (zoomed)
- 2 ms binning (zoomed)
- SN=5 or 10 s binning (full-time range)
- Raw light curve
Spectra
Notes:
- 1) The fitting includes the systematic errors.
- 2) When the burst includes telescope slew time periods, the fitting uses an average response file made from multiple 5-s response files through out the slew time plus single time preiod for the non-slew times, and weighted by the total counts in the corresponding time period using addrmf. An average response file is needed becuase a spectral fit using the pre-slew DRM will introduce some errors in both a spectral shape and a normalization if the PHA file contains a lot of the slew/post-slew time interval.
- 3) For fits to more complicated models (e.g. a power-law over a cutoff power-law), the BAT team has decided to require a chi-square improvement of more than 6 for each extra dof.
Time averaged spectrum fit using the average DRM
Power-law model
Time interval is from  -13.588 sec. to   25.324 sec.

Spectral model in power-law:
------------------------------------------------------------
Parameters  : value       lower 90%   higher 90%
Photon index: -1.62703     ( -0.206829   0.202389 )
Norm@50keV  : 2.24986E-03    ( -0.000278374   0.000273608 )
------------------------------------------------------------
#Fit statistic : Chi-Squared =          46.40 using 59 PHA bins.
# Reduced chi-squared =         0.8140 for     57 degrees of freedom
# Null hypothesis probability =   8.410904e-01

Photon flux (15-150 keV)    in 38.91 sec: 0.291601 ( -0.0329  0.032922 ) ph/cm2/s
Energy fluence (15-150 keV)             : 8.16246e-07 ( -1.07793e-07  1.09541e-07 ) ergs/cm2
Cutoff power-law model

Time interval is from  -13.588 sec. to   25.324 sec.
Spectral model in the cutoff power-law:
------------------------------------------------------------
Parameters  : value       lower 90%   higher 90%
Photon index: -1.62531     ( -0.786135   0.671384 )
Epeak [keV] : 9998.14      ( -9998.46 -9998.46 )
Norm@50keV  : 2.25488E-03    ( -0.00148343   0.00309307 )
------------------------------------------------------------
#Fit statistic : Chi-Squared =          46.40 using 59 PHA bins.
# Reduced chi-squared =         0.8285 for     56 degrees of freedom
# Null hypothesis probability =   8.162696e-01

Photon flux (15-150 keV)    in 38.91 sec: 0.291868 ( -0.033893  0.032878 ) ph/cm2/s
Energy fluence (15-150 keV)             : 8.17958e-07 ( -1.22003e-07  8.67347e-08 ) ergs/cm2
1-s peak spectrum fit
Power-law model

Time interval is from    2.084 sec. to    3.084 sec.

Spectral model in power-law:
------------------------------------------------------------
Parameters  : value       lower 90%   higher 90%
Photon index: -1.55049     ( -0.393505   0.378285 )
Norm@50keV  : 6.85899E-03    ( -0.00176515   0.00173292 )
------------------------------------------------------------
#Fit statistic : Chi-Squared =          52.57 using 59 PHA bins.
# Reduced chi-squared =         0.9223 for     57 degrees of freedom
# Null hypothesis probability =   6.416616e-01

Photon flux (15-150 keV)    in 1 sec: 0.868459 ( -0.210105  0.210251 ) ph/cm2/s
Energy fluence (15-150 keV)             : 6.45743e-08 ( -1.75903e-08  1.80124e-08 ) ergs/cm2
Cutoff power-law model
Time interval is from    2.084 sec. to    3.084 sec.
Spectral model in the cutoff power-law:
------------------------------------------------------------
Parameters  : value       lower 90%   higher 90%
Photon index: -0.663571     ( -1.18526   2.11716 )
Epeak [keV] : 69.1877      ( -19.0834 -69.1879 )
Norm@50keV  : 2.10638E-02    ( -0.0210635   0.311009 )
------------------------------------------------------------
#Fit statistic : Chi-Squared =          51.50 using 59 PHA bins.
# Reduced chi-squared =         0.9196 for     56 degrees of freedom
# Null hypothesis probability =   6.458207e-01

Photon flux (15-150 keV)    in 1 sec: 0.855306 ( -0.211073  0.211394 ) ph/cm2/s
Energy fluence (15-150 keV)             : 6.04979e-08 ( -1.87408e-08  1.93475e-08 ) ergs/cm2
Time-resolved spectra
Distribution
T90 vs. Hardness ratio plot
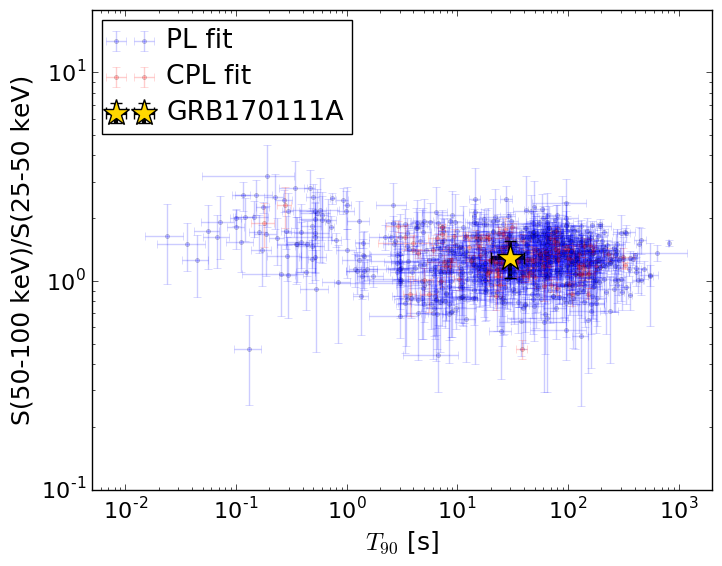
T90                                   = 29.876 sec.
Hardness ratio (energy fluence ratio) = 1.29503044689
S(15-50 keV) vs. S(50-150 keV) plot
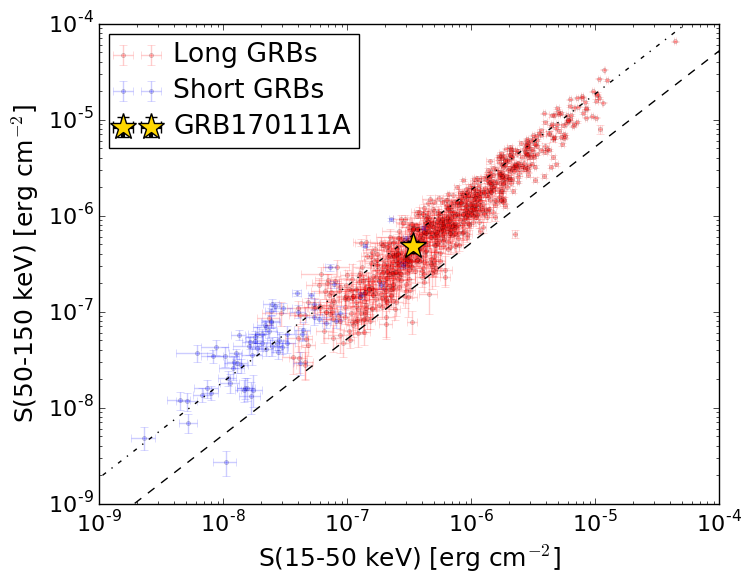
S(15-50 keV)  = 3.401242e-07
S(50-150 keV) = 4.761303e-07
The dash-dotted line and the dashed line traces the fluences calculated from the Band function with Epeak = 15 and 150 keV, respectively. Both lines assume a canonical values of alpha = -1 and beta = -2.5.
Spacecraft aspect plot
Bright source in the pre-burst/pre-slew/post-slew images
Pre-burst image of 15-350 keV band
Time interval of the image:
-239.624000 -13.588000

# RAcent  DECcent POSerr Theta    Phi  PeakCts   SNR AngSep     Name
#  [deg]    [deg]    ['] [deg]  [deg]                   [']
 15.3041  37.7432    2.4  51.6    8.6   2.9010   4.9 ------	UNKNOWN
 80.0230 -57.3032    2.3  57.8 -170.6   6.1351   4.9 ------	UNKNOWN
 23.5393 -30.6580    2.8  27.1 -113.9   1.0384   4.2 ------	UNKNOWN
354.9989  15.6327    2.5  50.7  -28.2   2.1505   4.6 ------	UNKNOWN
 39.4999 -63.2053    3.4  54.8 -146.1   3.7418   3.4 ------	UNKNOWN
  8.4323 -38.6886    3.0  41.5 -108.2   3.2054   3.8 ------	UNKNOWN
Pre-slew background subtracted image of 15-350 keV band
Time interval of the image:
-13.588000 25.324000

# RAcent  DECcent POSerr Theta    Phi  PeakCts   SNR AngSep     Name
#  [deg]    [deg]    ['] [deg]  [deg]                   [']
 49.8681 -32.4084    2.5  25.7 -165.7   0.3157   4.5 ------	UNKNOWN
 20.6912 -32.5433    0.8  30.1 -112.5   1.3768  13.6 ------	UNKNOWN
353.1037  10.2308    2.2  50.3  -35.6   1.0978   5.2 ------	UNKNOWN
Post-slew image of 15-350 keV band
Time interval of the image:
90.876600 782.486000

# RAcent  DECcent POSerr Theta    Phi  PeakCts   SNR AngSep     Name
#  [deg]    [deg]    ['] [deg]  [deg]                   [']
 38.0733  -4.1235    2.3  32.7   51.3  12.1039   5.0 ------	UNKNOWN
352.9685  18.9954    2.4  58.0  -13.4  34.7273   4.8 ------	UNKNOWN