Analysis Summary
Notes:
- 1) No attempt has been made to eliminate the non-significant decimal places.
- 2) This batgrbproduct analysis is done using the HEASARC data.
- 3) This batgrbproduct analysis is using the flight position for the mask-weighting calculation.
======================================================================
BAT GRB EVENT DATA PROCESSING REPORT
Process Script Ver: batgrbproduct v2.46
Process Start Time: Fri Feb 10 13:29:20 EST 2017
Host Name: bat1
Current Working Dir: /local/data/bat1/alien/Swift_3rdBATcatalog/event/batevent_reproc/trigger735326
======================================================================
Trigger: 00735326 Segment: 000
BAT Trigger Time: 507219694.208 [s; MET]
Trigger Stop: 507219706.368 [s; MET]
UTC: 2017-01-27T14:21:15.684000 [includes UTCF correction]
Where From?: TDRSS position message
BAT
RA: 174.335826083407 Dec: -45.8518164749582 [deg; J2000]
Catalogged Source?: NO
Point Source?: YES
GRB Indicated?: YES [ by BAT flight software ]
Image S/N Ratio: 7.67
Image Trigger?: NO
Rate S/N Ratio: 10.6770782520313 [ if not an image trigger ]
Image S/N Ratio: 7.67
Analysis Position: [ source = BAT ]
RA: 174.335826083407 Dec: -45.8518164749582 [deg; J2000]
Refined Position: [ source = BAT pre-slew burst ]
RA: 174.36632972461 Dec: -45.8449762071626 [deg; J2000]
{ 11h 37m 27.9s , -45d 50' 41.9" }
+/- 2.26026121638691 [arcmin] (estimated 90% radius based on SNR)
+/- 0.904201261992873 [arcmin] (formal 1-sigma fit error)
SNR: 9.48806116223111
Angular difference between the analysis and refined position is 1.339290 arcmin
Partial Coding Fraction: 0.9765625 [ including projection effects ]
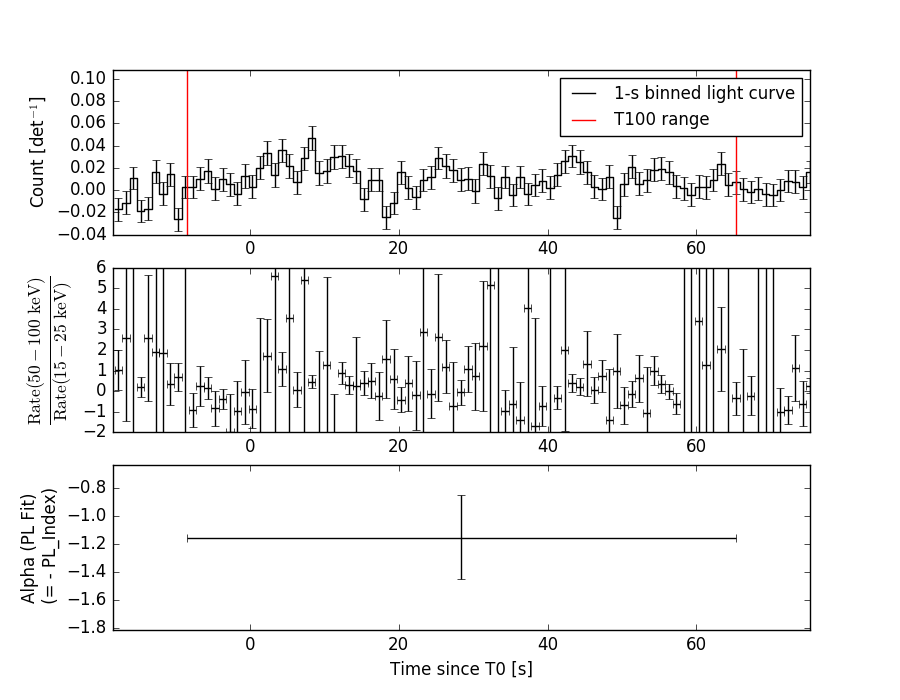
Duration
T90: 67.3759999871254 +/- 12.032902197789
Measured from: -4.89200001955032
to: 62.4839999675751 [s; relative to TRIGTIME]
T50: 36.2519999742508 +/- 11.3712312422895
Measured from: 6.98399996757507
to: 43.2359999418259 [s; relative to TRIGTIME]
Fluence
Peak Flux (peak 1 second)
Measured from: 7.30799996852875
to: 8.30799996852875 [s; relative to TRIGTIME]
Total Fluence
Measured from: -8.49599999189377
to: 65.2680000066757 [s; relative to TRIGTIME]
Band 1 Band 2 Band 3 Band 4
15-25 25-50 50-100 100-350 keV
Total 0.166213 0.313025 0.234871 0.114418
0.048041 0.048701 0.042328 0.038393 [error]
Peak 0.018209 0.013463 0.011916 0.012812
0.005772 0.005751 0.005227 0.004480 [error]
[ fluence units of on-axis counts / fully illuminated detector ]
======================================================================
====== Table of the duration information =============================
Value tstart tstop
T100 73.764 -8.496 65.268
T90 67.376 -4.892 62.484
T50 36.252 6.984 43.236
Peak 1.000 7.308 8.308
====== Spectral Analysis Summary =====================================
Model : spectral model: simple power-law (PL) and cutoff power-law (CPL)
Ph_index : photon index: E^{Ph_index}
Ph_90err : 90% error of the photon index
Epeak : Epeak in keV
Epeak_90err: 90% error of Epeak
Norm : normalization at 50 keV in both the PL model and CPL model
Nomr_90err : 90% error of the normalization
chi2 : Chi-Squared
dof : degree of freedo
=== Time-averaged spectral analysis ===
(Best model with acceptable fit: PL)
Model Ph_index Ph_90err_low Ph_90err_hi Epeak Epeak_90err_low Epeak_90err_hi Norm Nomr_90err_low Norm_90err_hi chi2 dof
PL -1.155 -0.295 0.308 - - - 7.01e-04 -1.20e-04 1.20e-04 70.000 57
CPL -0.577 -1.002 1.577 127.581 -127.581 -127.581 1.35e-03 -7.44e-04 6.22e-03 69.330 56
=== 1-s peak spectral analysis ===
(Best model with acceptable fit: N/A)
Model Ph_index Ph_90err_low Ph_90err_hi Epeak Epeak_90err_low Epeak_90err_hi Norm Nomr_90err_low Norm_90err_hi chi2 dof
PL -1.090 -1.057 1.365 - - - 3.03e-03 -1.51e-03 1.07e-03 48.240 57
CPL -1.130 -3.505 0.782 9999.360 N/A N/A 3.05e-03 N/A N/A 48.270 56
=== Fluence/Peak Flux Summary ===
Model Band1 Band2 Band3 Band4 Band5 Total
15-25 25-50 50-100 100-350 15-150 15-350 keV
Fluence PL 4.78e-08 1.09e-07 1.95e-07 8.30e-07 5.32e-07 1.18e-06 erg/cm2
90%_error_low -1.49e-08 -2.18e-08 -3.99e-08 -3.20e-07 -1.01e-07 -3.52e-07 erg/cm2
90%_error_hi 1.64e-08 2.12e-08 3.94e-08 4.47e-07 1.02e-07 4.62e-07 erg/cm2
Peak flux PL 8.36e-02 1.08e-01 1.02e-01 1.71e-01 3.51e-01 4.64e-01 ph/cm2/s
90%_error_low -8.36e-02 -7.25e-02 -5.46e-02 -1.40e-01 -3.51e-01 -1.78e-01 ph/cm2/s
90%_error_hi 9.92e-02 5.12e-02 4.17e-02 4.52e-01 1.33e-01 3.22e-01 ph/cm2/s
Fluence CPL 4.30e-08 1.15e-07 2.03e-07 3.66e-07 5.07e-07 7.27e-07 erg/cm2
90%_error_low -1.55e-08 -2.51e-08 -4.37e-08 -2.89e-07 -6.60e-08 -3.08e-07 erg/cm2
90%_error_hi 1.90e-08 2.69e-08 4.55e-08 7.49e-07 1.14e-07 6.00e-07 erg/cm2
Peak flux CPL 8.37e-02 5.81e-02 2.77e-02 2.24e-02 1.79e-01 1.92e-01 ph/cm2/s
90%_error_low -8.37e-02 N/A -2.77e-02 -2.24e-02 -1.79e-01 -1.92e-01 ph/cm2/s
90%_error_hi 1.02e-01 N/A 1.06e-02 2.16e-02 9.53e-02 9.18e-02 ph/cm2/s
======================================================================
Image
Light Curves
Note: The mask-weighted lightcurves have units of either count/det or counts/sec/det, where a det is 0.4 x 0.4 = 0.16 sq cm.
Full-time range; 1 s binning
Other quick-look light curves:
- 64 ms binning (zoomed)
- 16 ms binning (zoomed)
- 8 ms binning (zoomed)
- 2 ms binning (zoomed)
- SN=5 or 10 s binning (full-time range)
- Raw light curve
Spectra
- 64 ms binning (zoomed)
- 16 ms binning (zoomed)
- 8 ms binning (zoomed)
- 2 ms binning (zoomed)
- SN=5 or 10 s binning (full-time range)
- Raw light curve
Spectra
Notes:
- 1) The fitting includes the systematic errors.
- 2) When the burst includes telescope slew time periods, the fitting uses an average response file made from multiple 5-s response files through out the slew time plus single time preiod for the non-slew times, and weighted by the total counts in the corresponding time period using addrmf. An average response file is needed becuase a spectral fit using the pre-slew DRM will introduce some errors in both a spectral shape and a normalization if the PHA file contains a lot of the slew/post-slew time interval.
- 3) For fits to more complicated models (e.g. a power-law over a cutoff power-law), the BAT team has decided to require a chi-square improvement of more than 6 for each extra dof.
Time averaged spectrum fit using the average DRM
Power-law model
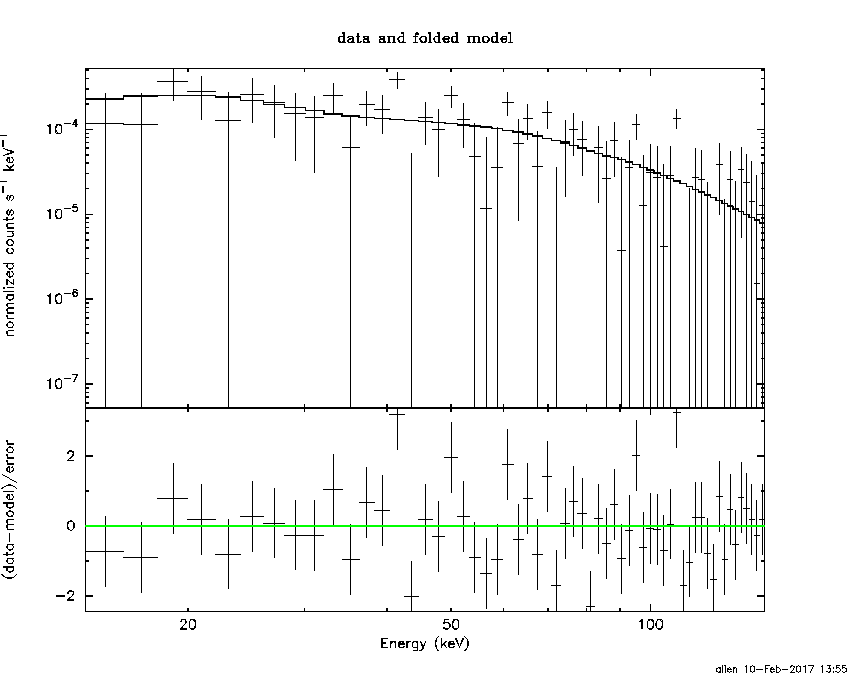
Time interval is from   -8.496 sec. to   65.268 sec.

Spectral model in power-law:
------------------------------------------------------------
Parameters  : value       lower 90%   higher 90%
Photon index: -1.15458     ( -0.295181   0.307627 )
Norm@50keV  : 7.01309E-04    ( -0.000120489   0.000120444 )
------------------------------------------------------------
#Fit statistic : Chi-Squared =          70.00 using 59 PHA bins.
# Reduced chi-squared =          1.228 for     57 degrees of freedom
# Null hypothesis probability =   1.156423e-01

Photon flux (15-150 keV)    in 73.76 sec: 8.18319E-02 ( -0.0144065  0.0144555 ) ph/cm2/s
Energy fluence (15-150 keV)             : 5.3184e-07 ( -1.00837e-07  1.02367e-07 ) ergs/cm2
Cutoff power-law model
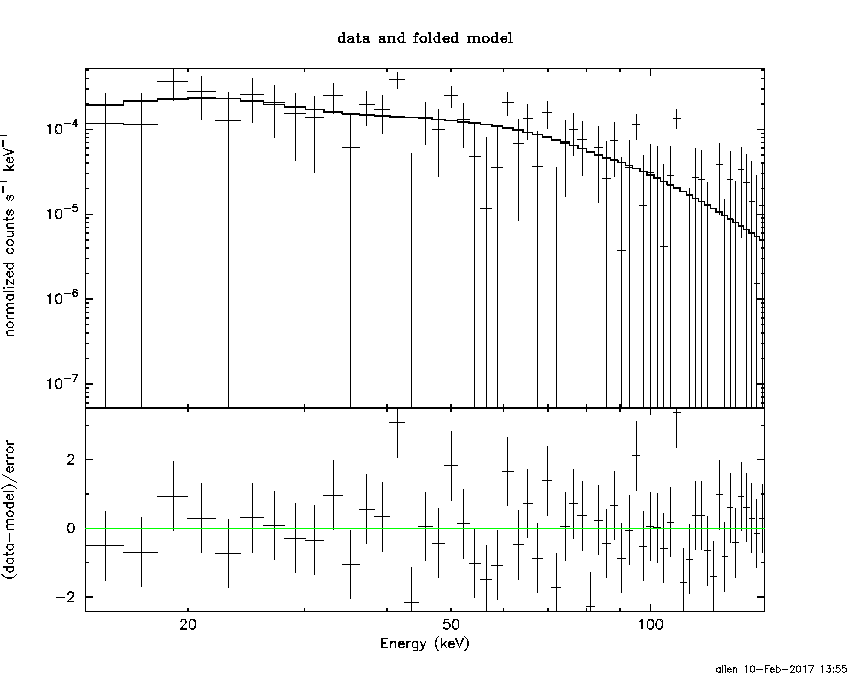
Time interval is from   -8.496 sec. to   65.268 sec.
Spectral model in the cutoff power-law:
------------------------------------------------------------
Parameters  : value       lower 90%   higher 90%
Photon index: -0.576837     ( -1.00167   1.5775 )
Epeak [keV] : 127.581      ( -127.583 -127.583 )
Norm@50keV  : 1.34511E-03    ( -0.000743642   0.00622305 )
------------------------------------------------------------
#Fit statistic : Chi-Squared =          69.33 using 59 PHA bins.
# Reduced chi-squared =          1.238 for     56 degrees of freedom
# Null hypothesis probability =   1.087315e-01

Photon flux (15-150 keV)    in 73.76 sec: 7.97569E-02 ( -0.0151666  0.0150834 ) ph/cm2/s
Energy fluence (15-150 keV)             : 5.06851e-07 ( -6.60115e-08  1.14262e-07 ) ergs/cm2
1-s peak spectrum fit
Power-law model
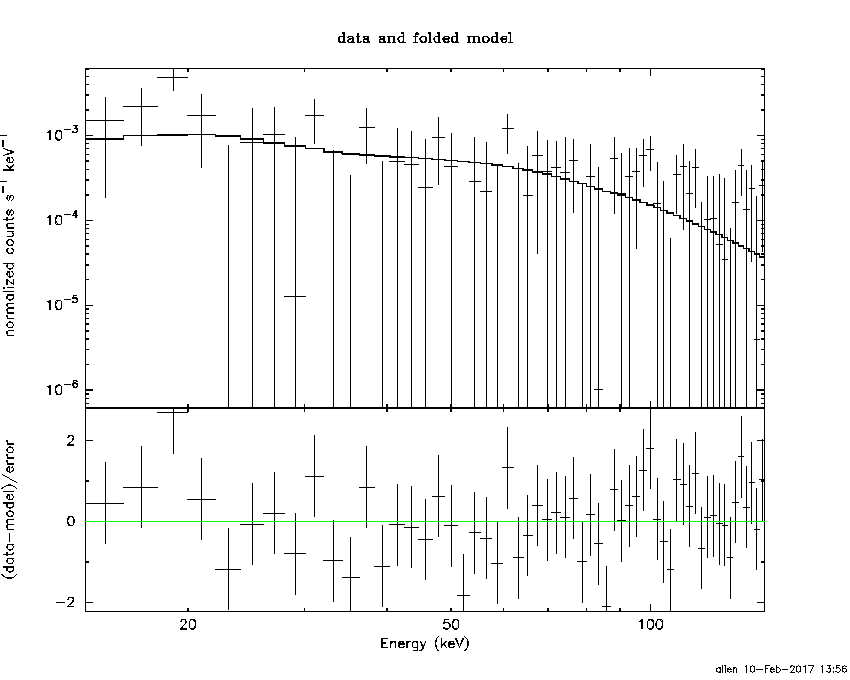
Time interval is from    7.308 sec. to    8.308 sec.

Spectral model in power-law:
------------------------------------------------------------
Parameters  : value       lower 90%   higher 90%
Photon index: -1.09021     ( -1.06229   1.35956 )
Norm@50keV  : 3.03462E-03    ( -0.00151033   0.00106994 )
------------------------------------------------------------
#Fit statistic : Chi-Squared =          48.24 using 59 PHA bins.
# Reduced chi-squared =         0.8463 for     57 degrees of freedom
# Null hypothesis probability =   7.891492e-01

Photon flux (15-150 keV)    in 1 sec: 0.351074 ( -0.351074  0.132859 ) ph/cm2/s
Energy fluence (15-150 keV)             : 3.19271e-08 ( -1.42044e-08  1.36818e-08 ) ergs/cm2
Cutoff power-law model
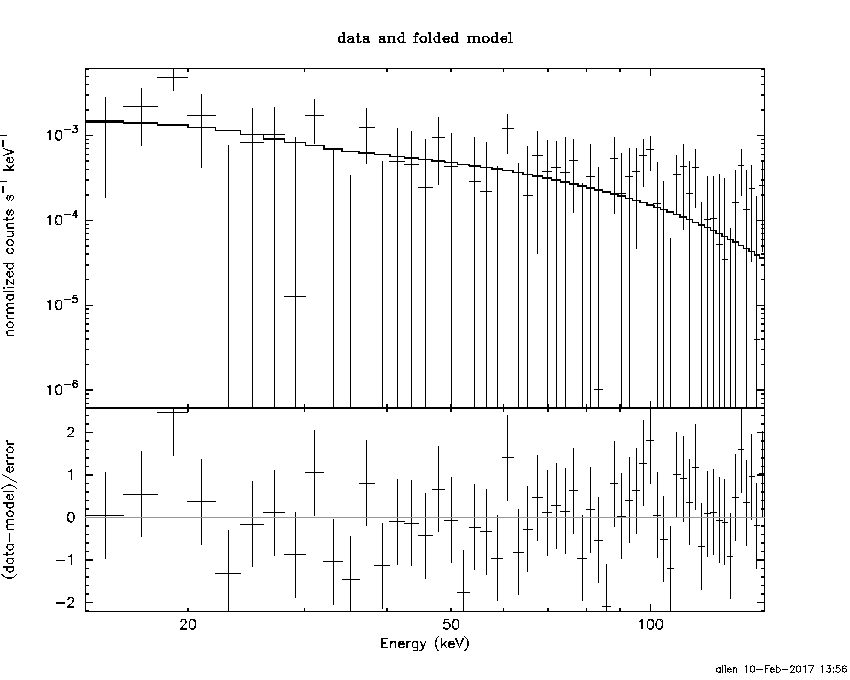
Time interval is from    7.308 sec. to    8.308 sec.
Spectral model in the cutoff power-law:
------------------------------------------------------------
Parameters  : value       lower 90%   higher 90%
Photon index: -2.15627     ( -2.47841   1.80853 )
Epeak [keV] : 56.4306      (   )
Norm@50keV  : 1.01047E-03    (     )
------------------------------------------------------------
#Fit statistic : Chi-Squared =          46.62 using 59 PHA bins.
# Reduced chi-squared =         0.8324 for     56 degrees of freedom
# Null hypothesis probability =   8.099817e-01

Photon flux (15-150 keV)    in 1 sec: 0.179390 ( -0.17939  0.095286 ) ph/cm2/s
Energy fluence (15-150 keV)             : 1.17114e-08 ( 0  0 ) ergs/cm2
Time-resolved spectra
Distribution
T90 vs. Hardness ratio plot
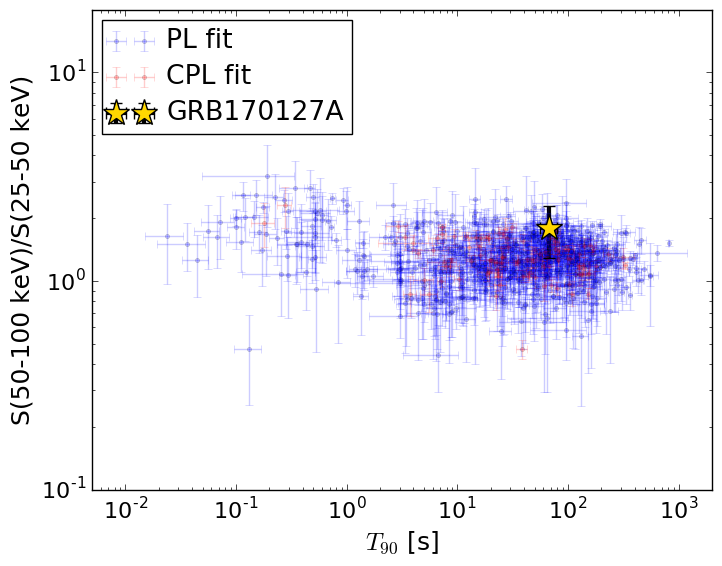
T90                                   = 67.376 sec.
Hardness ratio (energy fluence ratio) = 1.79680126021
S(15-50 keV) vs. S(50-150 keV) plot
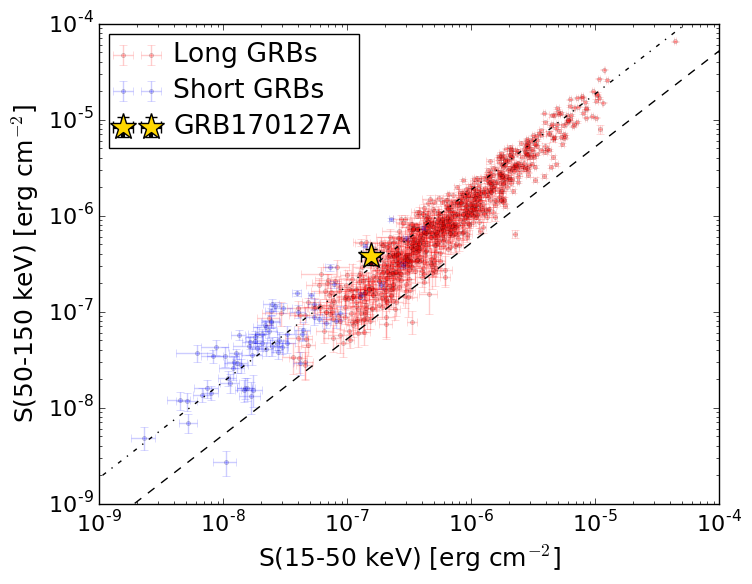
S(15-50 keV)  = 1.5651807e-07
S(50-150 keV) = 3.753259e-07
The dash-dotted line and the dashed line traces the fluences calculated from the Band function with Epeak = 15 and 150 keV, respectively. Both lines assume a canonical values of alpha = -1 and beta = -2.5.
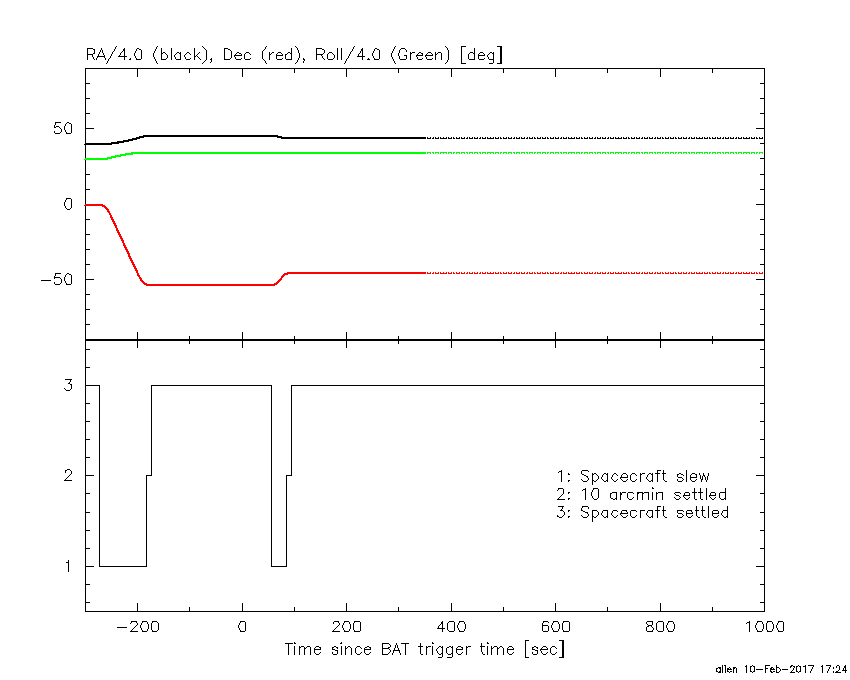
Spacecraft aspect plot
Bright source in the pre-burst/pre-slew/post-slew images
Pre-burst image of 15-350 keV band
Time interval of the image:
-183.107410 -8.496000

# RAcent  DECcent POSerr Theta    Phi  PeakCts   SNR AngSep     Name
#  [deg]    [deg]    ['] [deg]  [deg]                   [']
135.4858 -40.4180    5.2  32.6   49.3   0.5815   2.2    8.4	Vela X-1
170.3239 -60.6009    1.8   9.1  -12.6   1.0609   6.4    1.3	Cen X-3
186.6406 -62.8058    1.1  10.0  -62.1   1.7243  10.8    2.2	GX 301-2
162.1048 -40.9385    3.2  17.5   82.3   0.6596   3.6 ------	UNKNOWN
176.8614 -62.0346    2.3   8.9  -34.7   0.8180   5.0 ------	UNKNOWN
221.0182  -5.4242    2.2  58.2 -175.8   5.7223   5.3 ------	UNKNOWN
214.4004 -66.6161    2.7  21.1  -83.5   0.8660   4.3 ------	UNKNOWN
 57.4035 -60.1383    2.5  57.7  -15.9   3.9008   4.6 ------	UNKNOWN
  3.5234 -75.8790    3.7  50.8  -44.5   2.7895   3.1 ------	UNKNOWN
Pre-slew background subtracted image of 15-350 keV band
Time interval of the image:
-8.496000 57.092590

# RAcent  DECcent POSerr Theta    Phi  PeakCts   SNR AngSep     Name
#  [deg]    [deg]    ['] [deg]  [deg]                   [']
135.5039 -40.6781    5.0  32.5   48.9   0.3685   2.3    7.5	Vela X-1
170.3605 -60.4241    5.6   8.9  -11.9  -0.1934  -2.0   12.0	Cen X-3
186.6046 -62.7381    3.2  10.0  -62.2  -0.3503  -3.6    2.4	GX 301-2
 90.7065 -49.4256    2.6  52.3    9.8   1.4814   4.5 ------	UNKNOWN
185.0504 -33.6621    2.7  19.9  145.9   0.4353   4.2 ------	UNKNOWN
174.3663 -45.8450    1.2   8.4  104.5   0.9143   9.5 ------	UNKNOWN
239.0731 -25.0636    2.2  51.6 -144.7   2.0915   5.3 ------	UNKNOWN
Post-slew image of 15-350 keV band
Time interval of the image:
85.092590 962.916800

# RAcent  DECcent POSerr Theta    Phi  PeakCts   SNR AngSep     Name
#  [deg]    [deg]    ['] [deg]  [deg]                   [']
135.5018 -40.5818    1.7  28.5   39.8   4.6523   6.9    2.0	Vela X-1
170.2895 -60.5938    1.4  14.9  -39.1   4.2727   8.0    1.9	Cen X-3
186.7165 -62.7933    0.9  18.3  -65.0   7.3726  12.4    2.1	GX 301-2
178.1457 -16.1991    2.7  29.8  140.5   3.1066   4.3 ------	UNKNOWN
132.7411 -41.9793    2.4  29.9   35.5   3.0986   4.7 ------	UNKNOWN
211.2886   0.8082    3.6  56.9  179.0  11.6386   3.2 ------	UNKNOWN
213.8398  -2.0669    3.4  55.7 -176.5   8.6911   3.4 ------	UNKNOWN
208.5703 -24.6124    2.7  34.7 -162.8   2.6067   4.3 ------	UNKNOWN
176.7581 -61.9654    2.3  16.2  -50.9   2.7345   5.1 ------	UNKNOWN
201.4760 -43.0197    2.3  19.5 -135.4   2.5070   5.0 ------	UNKNOWN
219.1476  -3.1551    2.8  57.8 -170.6  13.8812   4.1 ------	UNKNOWN