Analysis Summary
Notes:
- 1) No attempt has been made to eliminate the non-significant decimal places.
- 2) This batgrbproduct analysis is done using the HEASARC data.
- 3) This batgrbproduct analysis is using the flight position for the mask-weighting calculation.
==========================================================================
           BAT GROUND-DETECTED GRB DATA PROCESSING REPORT
    Process Script Ver: batgrbproduct v2.46
    Process Start Time: Tue Mar  7 14:50:11 EST 2017
             Host Name: bat1
   Current Working Dir: /local/data/bat1/alien/Swift_3rdBATcatalog/event/ground_detect_bursts/scripts
======================================================================

  Trigger: 00736108      Segment: 000

  BAT Trigger Time: 507597313.6
               UTC: 2017-01-31T23:14:55.054   [includes UTCF correction]
       Where From?: Ground analysis (best_duration.txt)
  NOTE: BAT trigger time for ground-detected burst is the T100 start time.

  Analysis Position:   [ source = GCN ]
    RA: 341.447   Dec: 64.006  [deg; J2000]

  Refined Position:   [ source = BAT pre-slew image ]
    RA: 341.346810486   Dec: 64.0450862333  [deg; J2000]
        { 22h 45m 23.2s , +64d 02' 42.3" }
        +/- 4.29394887133 [arcmin] (estimated 90% radius based on SNR)
    SNR: 3.79397055799


  Angular difference between the analysis and refined position is 3.525831 arcmin

  Partial Coding Fraction: 0.09277344    [ including projection effects ]

  Duration
     T90: 22.3999999761581 +/- 1.6
        Measured from: 0
                   to: 22.4     [s; relative to TRIGTIME]
     T50: 12.8000000715256 +/- 1.6
        Measured from: 4.8
                   to: 17.6     [s; relative to TRIGTIME]


====== Table of the duration information =============================

        Value   tstart    tstop
T100   22.400    0.000   22.400
T90    22.400    0.000   22.400
T50    12.800    4.800   17.600
Peak    1.000   19.500   20.500


====== Spectral Analysis Summary =====================================

Model      : spectral model: simple power-law (PL) and cutoff power-law (CPL)
Ph_index   : photon index: E^{Ph_index}
Ph_90err   : 90% error of the photon index
Epeak      : Epeak in keV
Epeak_90err: 90% error of Epeak
Norm       : normalization at 50 keV in both the PL model and CPL model
Nomr_90err : 90% error of the normalization
chi2       : Chi-Squared
dof        : degree of freedo

=== Time-averaged spectral analysis ===
(Best model with acceptable fit: PL)

Model Ph_index Ph_90err_low Ph_90err_hi  Epeak  Epeak_90err_low  Epeak_90err_hi  Norm       Nomr_90err_low    Norm_90err_hi    chi2    dof
PL      -1.255    -0.248      0.255       -           -               -         1.27e-02     -1.84e-03          1.84e-03      39.860   57
CPL     -0.988    -0.499      1.124      214.376    -214.376      -214.376      1.69e-02     -5.78e-03          3.49e-02      39.630   56


=== 1-s peak spectral analysis ===
(Best model with acceptable fit: N/A)

Model Ph_index Ph_90err_low Ph_90err_hi  Epeak  Epeak_90err_low  Epeak_90err_hi  Norm       Nomr_90err_low    Norm_90err_hi    chi2    dof
PL      -1.597     -0.615     0.560       -           -               -         1.52e-02     -5.27e-03          5.03e-03      75.860   57
CPL     -1.594     -0.677     1.368     9998.910    -9998.910      -9998.910      1.53e-02     -1.53e-02          1.32e-01      75.860   56


=== Fluence/Peak Flux Summary ===

              Model    Band1     Band2     Band3     Band4     Band5     Total
                       15-25     25-50    50-100    100-350    15-150    15-350    keV
Fluence         PL   7.76e-08  1.66e-07  2.78e-07  1.06e-06  7.64e-07  1.58e-06   erg/cm2
      90%_error_low -2.10e-08 -2.87e-08 -4.62e-08 -3.45e-07 -1.16e-07 -3.79e-07   erg/cm2
      90%_error_hi   2.29e-08  2.80e-08  4.54e-08  4.45e-07  1.17e-07  4.60e-07   erg/cm2
Peak flux       PL   6.88e-01  6.53e-01  4.32e-01  4.44e-01  1.95e+00  2.22e+00   ph/cm2/s
      90%_error_low -3.38e-01 -2.22e-01 -1.88e-01 -2.92e-01 -6.33e-01 -7.10e-01   ph/cm2/s
      90%_error_hi   3.86e-01  2.16e-01  1.79e-01  4.78e-01  6.34e-01  7.15e-01   ph/cm2/s

Fluence        CPL   7.29e-08  1.69e-07  2.86e-07  7.53e-07  7.56e-07  1.28e-06   erg/cm2
      90%_error_low -2.63e-08 -3.07e-08 -5.24e-08 -5.03e-07 -1.22e-07 -5.14e-07   erg/cm2
      90%_error_hi   2.65e-08  3.20e-08  5.60e-08  5.93e-07  1.20e-07  5.09e-07   erg/cm2
Peak flux      CPL   7.10e-01  6.37e-01  4.23e-01  4.42e-01  1.96e+00  2.30e+00   ph/cm2/s
      90%_error_low -7.10e-01 -2.32e-01     N/A       N/A   -7.11e-01 -1.02e+00   ph/cm2/s
      90%_error_hi   4.23e-01  3.94e-01     N/A       N/A    6.92e-01  7.50e-01   ph/cm2/s

======================================================================
Image
15.0-350.0 keV image (Event data)
#RAcent DECcent POSerr Theta  Phi  Peak_Cts  SNR Name
341.347 64.045 0.050 45.291 -125.783 0.542 3.794 TRIG_00736108

Image time interval: 18.400 to 22.400 [sec]
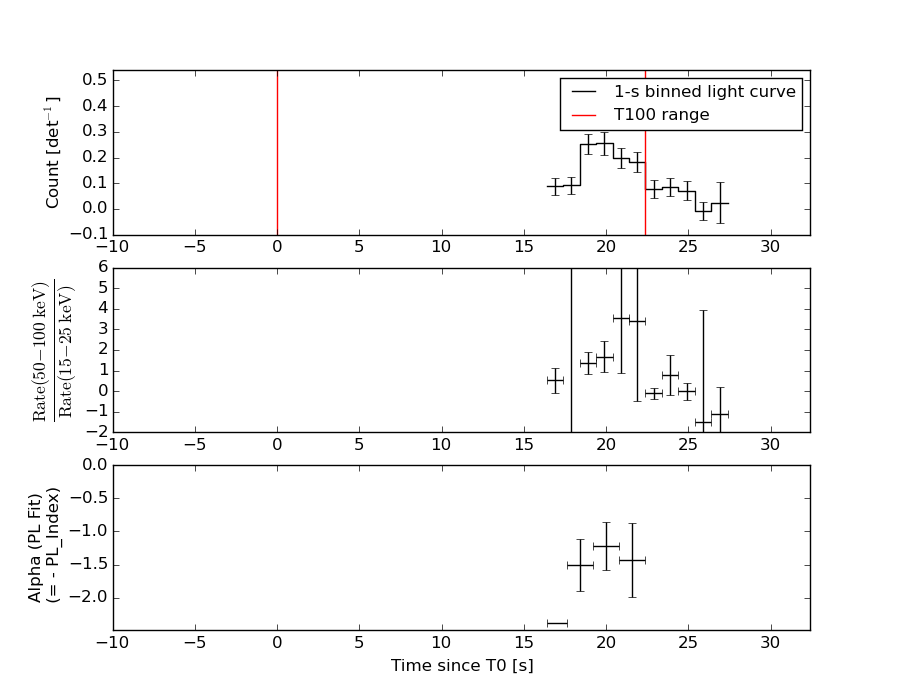
Light Curves
Note: The mask-weighted lightcurves have units of either count/det or counts/sec/det, where a det is 0.4 x 0.4 = 0.16 sq cm.
Full-time range; 1 s binning
Other quick-look light curves:
- 64 ms binning (zoomed)
- 16 ms binning (zoomed)
- 8 ms binning (zoomed)
- 2 ms binning (zoomed)
- SN=5 or 10 s binning (full-time range)
- Raw light curve
Spectra
- 64 ms binning (zoomed)
- 16 ms binning (zoomed)
- 8 ms binning (zoomed)
- 2 ms binning (zoomed)
- SN=5 or 10 s binning (full-time range)
- Raw light curve
Spectra
Notes:
- 1) The fitting includes the systematic errors.
- 2) When the burst includes telescope slew time periods, the fitting uses an average response file made from multiple 5-s response files through out the slew time plus single time preiod for the non-slew times, and weighted by the total counts in the corresponding time period using addrmf. An average response file is needed becuase a spectral fit using the pre-slew DRM will introduce some errors in both a spectral shape and a normalization if the PHA file contains a lot of the slew/post-slew time interval.
- 3) For fits to more complicated models (e.g. a power-law over a cutoff power-law), the BAT team has decided to require a chi-square improvement of more than 6 for each extra dof.
Time averaged spectrum fit using the average DRM
Power-law model
Time interval is from   16.400 sec. to   22.400 sec.

Spectral model in power-law:
------------------------------------------------------------
Parameters  : value       lower 90%   higher 90%
Photon index: -1.25501     ( -0.248181   0.254717 )
Norm@50keV  : 1.27328E-02    ( -0.00184148   0.00183894 )
------------------------------------------------------------
#Fit statistic : Chi-Squared =          39.86 using 59 PHA bins.
# Reduced chi-squared =         0.6993 for     57 degrees of freedom
# Null hypothesis probability =   9.588832e-01

Photon flux (15-150 keV)    in 6 sec: 1.50719 ( -0.23103  0.23231 ) ph/cm2/s
Energy fluence (15-150 keV)             : 7.63662e-07 ( -1.16488e-07  1.16963e-07 ) ergs/cm2
Cutoff power-law model
Time interval is from   16.400 sec. to   22.400 sec.
Spectral model in the cutoff power-law:
------------------------------------------------------------
Parameters  : value       lower 90%   higher 90%
Photon index: -0.987738     ( -0.499084   1.12387 )
Epeak [keV] : 214.376      ( -214.376 -214.376 )
Norm@50keV  : 1.68520E-02    ( -0.00577905   0.0348781 )
------------------------------------------------------------
#Fit statistic : Chi-Squared =          39.63 using 59 PHA bins.
# Reduced chi-squared =         0.7077 for     56 degrees of freedom
# Null hypothesis probability =   9.520375e-01

Photon flux (15-150 keV)    in 6 sec: 1.49008 ( -0.23934  0.23974 ) ph/cm2/s
Energy fluence (15-150 keV)             : 7.5558e-07 ( -1.21796e-07  1.20374e-07 ) ergs/cm2
1-s peak spectrum fit
Power-law model

Time interval is from   19.500 sec. to   20.500 sec.

Spectral model in power-law:
------------------------------------------------------------
Parameters  : value       lower 90%   higher 90%
Photon index: -1.59719     ( -0.614612   0.560072 )
Norm@50keV  : 1.52165E-02    ( -0.00527257   0.00502962 )
------------------------------------------------------------
#Fit statistic : Chi-Squared =          75.86 using 59 PHA bins.
# Reduced chi-squared =          1.331 for     57 degrees of freedom
# Null hypothesis probability =   4.816096e-02

Photon flux (15-150 keV)    in 1 sec: 1.95375 ( -0.63296  0.63438 ) ph/cm2/s
Energy fluence (15-150 keV)             : 1.42374e-07 ( -5.08321e-08  5.16431e-08 ) ergs/cm2
Cutoff power-law model
Time interval is from   19.500 sec. to   20.500 sec.
Spectral model in the cutoff power-law:
------------------------------------------------------------
Parameters  : value       lower 90%   higher 90%
Photon index: -1.59424     ( -0.676694   1.36853 )
Epeak [keV] : 9998.91      ( -9999.35 -9999.35 )
Norm@50keV  : 1.52625E-02    ( -0.0152556   0.132141 )
------------------------------------------------------------
#Fit statistic : Chi-Squared =          75.86 using 59 PHA bins.
# Reduced chi-squared =          1.355 for     56 degrees of freedom
# Null hypothesis probability =   3.980827e-02

Photon flux (15-150 keV)    in 1 sec: 1.96384 ( -0.71064  0.69182 ) ph/cm2/s
Energy fluence (15-150 keV)             : 1.43433e-07 ( -6.00438e-08  5.11747e-08 ) ergs/cm2
Time-resolved spectra
Distribution
T90 vs. Hardness ratio plot
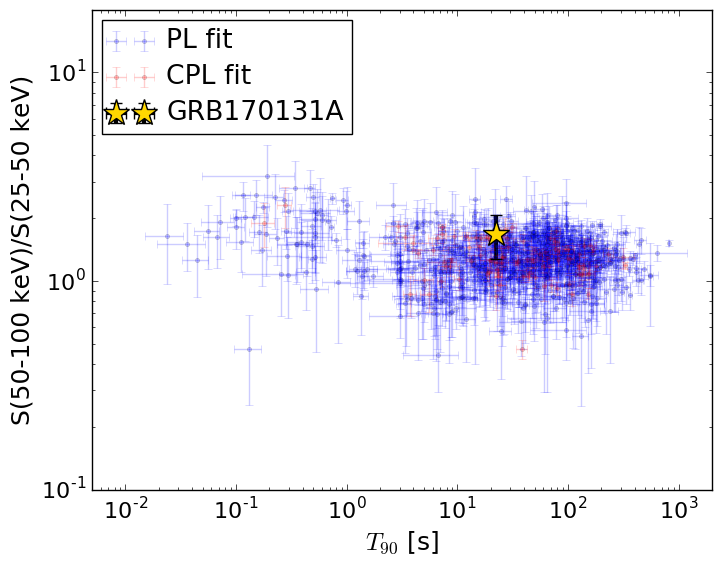
T90                                   = 22.4 sec.
Hardness ratio (energy fluence ratio) = 1.67602308753
S(15-50 keV) vs. S(50-150 keV) plot
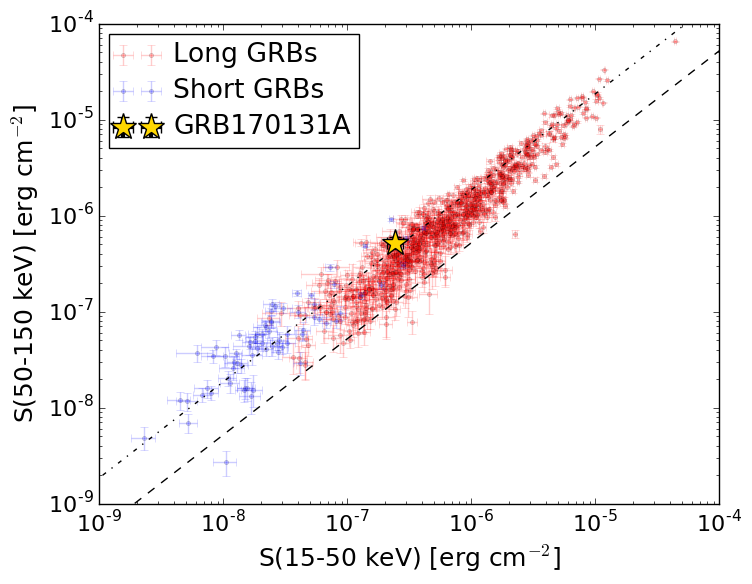
S(15-50 keV)  = 2.432419e-07
S(50-150 keV) = 5.20421e-07
The dash-dotted line and the dashed line traces the fluences calculated from the Band function with Epeak = 15 and 150 keV, respectively. Both lines assume a canonical values of alpha = -1 and beta = -2.5.
Mask shadow pattern
IMX = -0.590690149668, IMY = 0.819526278474
Spacecraft aspect plot
Bright source in the event data image
Event data image of 15-350 keV band
Time interval of the image:
18.400000 22.400000

# RAcent  DECcent POSerr Theta    Phi  PeakCts   SNR AngSep     Name
#  [deg]    [deg]    ['] [deg]  [deg]                   [']
106.0467  37.3169    2.7  42.6  123.4   0.5776   4.3 ------	UNKNOWN
Webpage updated on:
Tue Mar  7 17:47:22 EST 2017