Analysis Summary
Notes:
- 1) No attempt has been made to eliminate the non-significant decimal places.
- 2) This batgrbproduct analysis is done using the HEASARC data.
- 3) This batgrbproduct analysis is using the flight position for the mask-weighting calculation.
======================================================================
BAT GRB EVENT DATA PROCESSING REPORT
Process Script Ver: batgrbproduct v2.46
Process Start Time: Wed Apr 12 15:27:32 EDT 2017
Host Name: bat1
Current Working Dir: /local/data/bat1/alien/Swift_3rdBATcatalog/event/batevent_reproc/trigger736432
======================================================================
Trigger: 00736432 Segment: 000
BAT Trigger Time: 507773039.616 [s; MET]
Trigger Stop: 507773043.712 [s; MET]
UTC: 2017-02-03T00:03:41.060220 [includes UTCF correction]
Where From?: TDRSS position message
BAT
RA: 332.860488803399 Dec: 25.1734109087689 [deg; J2000]
Catalogged Source?: NO
Point Source?: YES
GRB Indicated?: YES [ by BAT flight software ]
Image S/N Ratio: 7.81
Image Trigger?: NO
Rate S/N Ratio: 11.4891252930761 [ if not an image trigger ]
Image S/N Ratio: 7.81
Analysis Position: [ source = BAT ]
RA: 332.860488803399 Dec: 25.1734109087689 [deg; J2000]
Refined Position: [ source = BAT pre-slew burst ]
RA: 332.859323193104 Dec: 25.1854591260923 [deg; J2000]
{ 22h 11m 26.2s , +25d 11' 07.7" }
+/- 2.18779393219831 [arcmin] (estimated 90% radius based on SNR)
+/- 1.02968493737673 [arcmin] (formal 1-sigma fit error)
SNR: 9.94019564009821
Angular difference between the analysis and refined position is 0.725658 arcmin
Partial Coding Fraction: 0.671875 [ including projection effects ]
Duration
T90: 45.9039999246597 +/- 5.96155414134771
Measured from: 0.748000025749207
to: 46.6519999504089 [s; relative to TRIGTIME]
T50: 12.4359999299049 +/- 12.9255890910487
Measured from: 3.80000001192093
to: 16.2359999418259 [s; relative to TRIGTIME]
Fluence
Peak Flux (peak 1 second)
Measured from: 3.7039999961853
to: 4.7039999961853 [s; relative to TRIGTIME]
Total Fluence
Measured from: -0.0400000214576721
to: 48.9760000109673 [s; relative to TRIGTIME]
Band 1 Band 2 Band 3 Band 4
15-25 25-50 50-100 100-350 keV
Total 0.301190 0.329008 0.250571 0.086948
0.049112 0.051254 0.044633 0.039170 [error]
Peak 0.022752 0.039297 0.026377 0.003386
0.007297 0.007852 0.006827 0.005712 [error]
[ fluence units of on-axis counts / fully illuminated detector ]
======================================================================
====== Table of the duration information =============================
Value tstart tstop
T100 49.016 -0.040 48.976
T90 45.904 0.748 46.652
T50 12.436 3.800 16.236
Peak 1.000 3.704 4.704
====== Spectral Analysis Summary =====================================
Model : spectral model: simple power-law (PL) and cutoff power-law (CPL)
Ph_index : photon index: E^{Ph_index}
Ph_90err : 90% error of the photon index
Epeak : Epeak in keV
Epeak_90err: 90% error of Epeak
Norm : normalization at 50 keV in both the PL model and CPL model
Nomr_90err : 90% error of the normalization
chi2 : Chi-Squared
dof : degree of freedo
=== Time-averaged spectral analysis ===
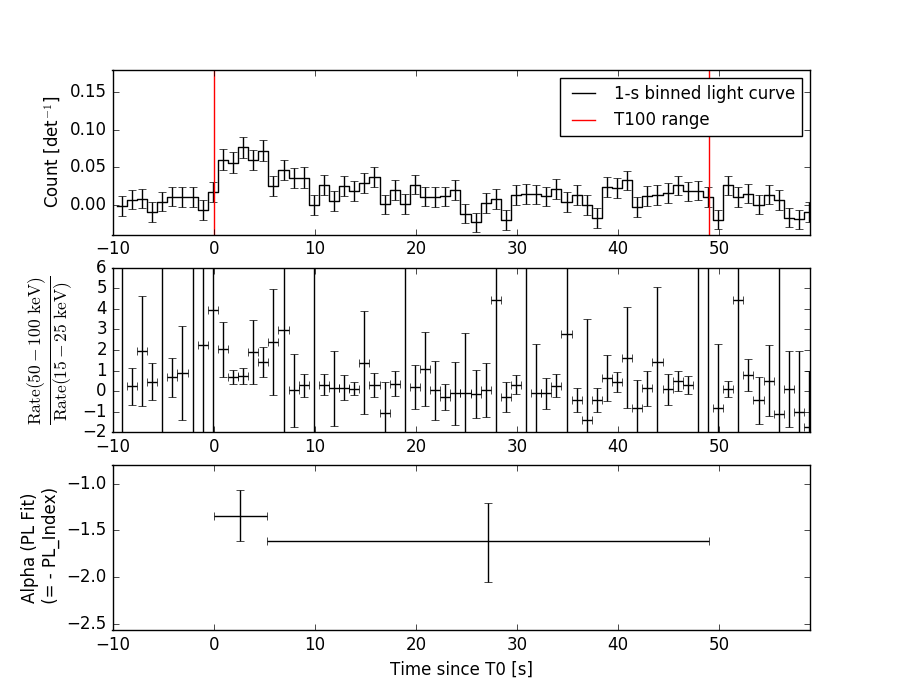
(Best model with acceptable fit: PL)
Model Ph_index Ph_90err_low Ph_90err_hi Epeak Epeak_90err_low Epeak_90err_hi Norm Nomr_90err_low Norm_90err_hi chi2 dof
PL -1.510 -0.291 0.286 - - - 1.33e-03 -2.10e-04 2.08e-04 51.830 57
CPL -1.520 -0.280 0.489 9999.320 -9999.320 -9999.320 1.33e-03 -2.02e-04 7.07e-04 51.850 56
=== 1-s peak spectral analysis ===
(Best model with acceptable fit: PL)
Model Ph_index Ph_90err_low Ph_90err_hi Epeak Epeak_90err_low Epeak_90err_hi Norm Nomr_90err_low Norm_90err_hi chi2 dof
PL -1.800 -0.442 0.405 - - - 5.66e-03 -1.61e-03 1.55e-03 46.440 57
CPL -0.887 -1.266 2.988 53.285 -45.468 -53.285 1.85e-02 -1.85e-02 1.24e+00 45.580 56
=== Fluence/Peak Flux Summary ===
Model Band1 Band2 Band3 Band4 Band5 Total
15-25 25-50 50-100 100-350 15-150 15-350 keV
Fluence PL 8.40e-08 1.53e-07 2.16e-07 6.34e-07 6.18e-07 1.09e-06 erg/cm2
90%_error_low -2.24e-08 -2.54e-08 -4.50e-08 -2.48e-07 -1.06e-07 -2.87e-07 erg/cm2
90%_error_hi 2.40e-08 2.49e-08 4.40e-08 3.38e-07 1.07e-07 3.59e-07 erg/cm2
Peak flux PL 3.11e-01 2.62e-01 1.51e-01 1.29e-01 7.80e-01 8.52e-01 ph/cm2/s
90%_error_low -1.07e-01 -6.43e-02 -5.34e-02 -7.06e-02 -1.91e-01 -2.10e-01 ph/cm2/s
90%_error_hi 1.15e-01 6.42e-02 5.38e-02 1.06e-01 1.92e-01 2.11e-01 ph/cm2/s
Fluence CPL 8.41e-08 1.54e-07 2.12e-07 6.31e-07 6.21e-07 1.08e-06 erg/cm2
90%_error_low N/A N/A N/A N/A -1.46e-07 -3.96e-07 erg/cm2
90%_error_hi N/A N/A N/A N/A 1.41e-07 3.62e-07 erg/cm2
Peak flux CPL 2.82e-01 2.93e-01 1.53e-01 4.46e-02 7.61e-01 7.73e-01 ph/cm2/s
90%_error_low -1.21e-01 -8.70e-02 N/A -4.46e-02 -1.95e-01 -2.04e-01 ph/cm2/s
90%_error_hi 1.26e-01 9.63e-02 N/A 1.15e-01 1.95e-01 2.42e-01 ph/cm2/s
======================================================================
Image
Pre-slew 15.0-350.0 keV image (Event data)
#   RAcent    DECcent   POSerr    Theta     Phi              Peak Cts       SNR   Name
  332.8593    25.1855   0.0192    38.6025   -12.9895         1.0876962      9.940 TRIG_00736432

Foreground time interval of the image:
 -0.040  48.976 (delta_t =  49.016 [sec])
Background time interval of the image:
-129.315  -0.040 (delta_t = 129.275 [sec])
Light Curves
Note: The mask-weighted lightcurves have units of either count/det or counts/sec/det, where a det is 0.4 x 0.4 = 0.16 sq cm.
Full-time range; 1 s binning
Other quick-look light curves:
- 64 ms binning (zoomed)
- 16 ms binning (zoomed)
- 8 ms binning (zoomed)
- 2 ms binning (zoomed)
- SN=5 or 10 s binning (full-time range)
- Raw light curve
Spectra
- 64 ms binning (zoomed)
- 16 ms binning (zoomed)
- 8 ms binning (zoomed)
- 2 ms binning (zoomed)
- SN=5 or 10 s binning (full-time range)
- Raw light curve
Spectra
Notes:
- 1) The fitting includes the systematic errors.
- 2) When the burst includes telescope slew time periods, the fitting uses an average response file made from multiple 5-s response files through out the slew time plus single time preiod for the non-slew times, and weighted by the total counts in the corresponding time period using addrmf. An average response file is needed becuase a spectral fit using the pre-slew DRM will introduce some errors in both a spectral shape and a normalization if the PHA file contains a lot of the slew/post-slew time interval.
- 3) For fits to more complicated models (e.g. a power-law over a cutoff power-law), the BAT team has decided to require a chi-square improvement of more than 6 for each extra dof.
Time averaged spectrum fit using the average DRM
Power-law model
Time interval is from   -0.040 sec. to   48.976 sec.

Spectral model in power-law:
------------------------------------------------------------
Parameters  : value       lower 90%   higher 90%
Photon index: -1.51013     ( -0.290789   0.28611 )
Norm@50keV  : 1.33004E-03    ( -0.000209833   0.000207645 )
------------------------------------------------------------
#Fit statistic : Chi-Squared =          51.83 using 59 PHA bins.
# Reduced chi-squared =         0.9093 for     57 degrees of freedom
# Null hypothesis probability =   6.687945e-01

Photon flux (15-150 keV)    in 49.02 sec: 0.166502 ( -0.026304  0.026428 ) ph/cm2/s
Energy fluence (15-150 keV)             : 6.17578e-07 ( -1.06011e-07  1.07046e-07 ) ergs/cm2
Cutoff power-law model
Time interval is from   -0.040 sec. to   48.976 sec.
Spectral model in the cutoff power-law:
------------------------------------------------------------
Parameters  : value       lower 90%   higher 90%
Photon index: -1.52043     ( -0.282822   0.486457 )
Epeak [keV] : 9999.32      ( -9999.36 -9999.36 )
Norm@50keV  : 1.32614E-03    ( -0.000207774   0.000700642 )
------------------------------------------------------------
#Fit statistic : Chi-Squared =          51.85 using 59 PHA bins.
# Reduced chi-squared =         0.9258 for     56 degrees of freedom
# Null hypothesis probability =   6.327858e-01

Photon flux (15-150 keV)    in 49.02 sec: 0.166860 ( -0.026989  0.026298 ) ph/cm2/s
Energy fluence (15-150 keV)             : 6.21147e-07 ( -1.46366e-07  1.40885e-07 ) ergs/cm2
1-s peak spectrum fit
Power-law model
Time interval is from    3.704 sec. to    4.704 sec.

Spectral model in power-law:
------------------------------------------------------------
Parameters  : value       lower 90%   higher 90%
Photon index: -1.79993     ( -0.442514   0.404605 )
Norm@50keV  : 5.65788E-03    ( -0.00160882   0.00155086 )
------------------------------------------------------------
#Fit statistic : Chi-Squared =          46.44 using 59 PHA bins.
# Reduced chi-squared =         0.8148 for     57 degrees of freedom
# Null hypothesis probability =   8.398090e-01

Photon flux (15-150 keV)    in 1 sec: 0.779664 ( -0.191377  0.191532 ) ph/cm2/s
Energy fluence (15-150 keV)             : 5.20955e-08 ( -1.45904e-08  1.50489e-08 ) ergs/cm2
Cutoff power-law model
Time interval is from    3.704 sec. to    4.704 sec.
Spectral model in the cutoff power-law:
------------------------------------------------------------
Parameters  : value       lower 90%   higher 90%
Photon index: -0.887351     ( -1.2663   2.98843 )
Epeak [keV] : 53.2849      ( -45.468 -53.2849 )
Norm@50keV  : 1.84944E-02    ( -0.0184943   1.24023 )
------------------------------------------------------------
#Fit statistic : Chi-Squared =          45.58 using 59 PHA bins.
# Reduced chi-squared =         0.8139 for     56 degrees of freedom
# Null hypothesis probability =   8.387034e-01

Photon flux (15-150 keV)    in 1 sec: 0.761222 ( -0.194512  0.194605 ) ph/cm2/s
Energy fluence (15-150 keV)             : 4.83682e-08 ( -1.57305e-08  1.65296e-08 ) ergs/cm2
Time-resolved spectra
Distribution
T90 vs. Hardness ratio plot
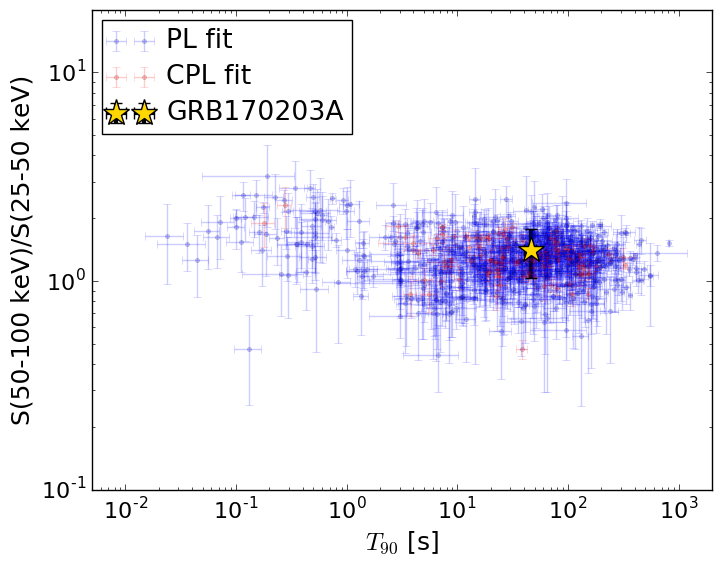
T90                                   = 45.904 sec.
Hardness ratio (energy fluence ratio) = 1.40433298846
S(15-50 keV) vs. S(50-150 keV) plot
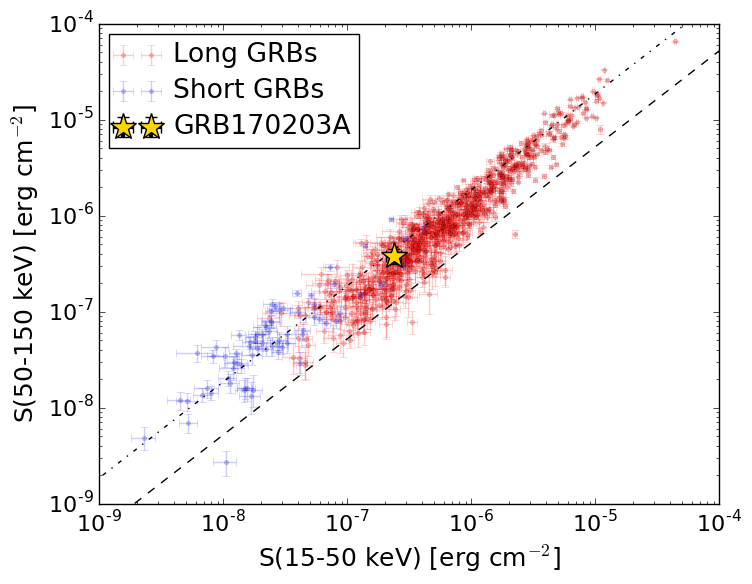
S(15-50 keV)  = 2.3753479e-07
S(50-150 keV) = 3.800392e-07
The dash-dotted line and the dashed line traces the fluences calculated from the Band function with Epeak = 15 and 150 keV, respectively. Both lines assume a canonical values of alpha = -1 and beta = -2.5.
Mask shadow pattern
IMX = 7.779330831607052E-01, IMY = 1.794501499320349E-01
Spacecraft aspect plot
Bright source in the pre-burst/pre-slew/post-slew images
Pre-burst image of 15-350 keV band
Time interval of the image:
-129.315410 -0.040000

# RAcent  DECcent POSerr Theta    Phi  PeakCts   SNR AngSep     Name
#  [deg]    [deg]    ['] [deg]  [deg]                   [']
326.3367  38.3233   10.6  51.2   -3.4   0.3314   1.1    7.8	Cyg X-2
350.9316  -1.9010    2.5  11.9  -63.9   0.6072   4.6  555.8	UNKNOWN
  5.3267 -38.1164    2.7  37.7 -150.1   0.8383   4.2 ------	UNKNOWN
Pre-slew background subtracted image of 15-350 keV band
Time interval of the image:
-0.040000 48.976000

# RAcent  DECcent POSerr Theta    Phi  PeakCts   SNR AngSep     Name
#  [deg]    [deg]    ['] [deg]  [deg]                   [']
326.1744  38.3229   56.9  51.3   -3.5  -0.0391  -0.2    0.1	Cyg X-2
341.9749  46.6029    2.3  50.4   14.8   1.2051   4.9 ------	UNKNOWN
342.5822  42.7837    3.1  46.9   13.0   0.6813   3.7 ------	UNKNOWN
332.8573  25.1839    1.1  38.6  -13.0   1.0991  10.0 ------	UNKNOWN
Post-slew image of 15-350 keV band
Time interval of the image:
-239.616000 358.384000
360.384000 838.180300
840.384000 962.385800

# RAcent  DECcent POSerr Theta    Phi  PeakCts   SNR AngSep     Name
#  [deg]    [deg]    ['] [deg]  [deg]                   [']
326.1194  38.4988    0.0  51.4   -3.4   2.2036   1.4   10.9	Cyg X-2
 36.1993  10.1333    3.5  35.0  104.7   5.5229   3.3 ------	UNKNOWN
 43.6160 -44.3819    4.0  56.9  179.3  13.9138   2.9 ------	UNKNOWN
352.5951 -20.9289    2.7  22.7 -121.7   2.9292   4.2 ------	UNKNOWN
  0.9180 -46.3218    4.4  45.9 -145.1   4.1472   2.6 ------	UNKNOWN
343.7865 -45.5161    4.0  48.1 -129.0  10.5116   2.9 ------	UNKNOWN