Analysis Summary
Notes:
- 1) No attempt has been made to eliminate the non-significant decimal places.
- 2) This batgrbproduct analysis is done using the HEASARC data.
- 3) This batgrbproduct analysis is using the flight position for the mask-weighting calculation.
======================================================================
                  BAT GRB EVENT DATA PROCESSING REPORT
    Process Script Ver: batgrbproduct v2.46
    Process Start Time: Wed Apr 12 15:17:48 EDT 2017
             Host Name: bat1
   Current Working Dir: /local/data/bat1/alien/Swift_3rdBATcatalog/event/batevent_reproc/trigger737125
======================================================================

  Trigger: 00737125      Segment: 000

  BAT Trigger Time: 508111064.064   [s; MET]
      Trigger Stop: 508111068.16   [s; MET]
               UTC: 2017-02-06T21:57:25.488720    [includes UTCF correction]
       Where From?: TDRSS position message

  BAT
    RA: 271.785667508088   Dec: 11.2228219729964  [deg; J2000]

     Catalogged Source?: NO
     Point Source?:      YES
     GRB Indicated?:     YES    [ by BAT flight software ]
     Image S/N Ratio:    7.48
     Image Trigger?:     NO
     Rate S/N Ratio:     9.32737905308882  [ if not an image trigger ]
     Image S/N Ratio:    7.48

  Analysis Position:   [ source = BAT ]
    RA: 271.785667508088   Dec: 11.2228219729964  [deg; J2000]

  Refined Position:   [ source = BAT pre-slew burst ]
    RA: 271.782770487604   Dec: 11.1751130970994  [deg; J2000]
        { 18h 07m 07.9s , +11d 10' 30.4" }
         +/- 2.19988005435562 [arcmin] (estimated 90% radius based on SNR)
         +/- 1.00249872004088 [arcmin] (formal 1-sigma fit error)
    SNR: 9.86227136990764

  Angular difference between the analysis and refined position is 2.867606 arcmin

  Partial Coding Fraction: 0.7890625    [ including projection effects ]

  Duration
     T90: 13.3600000143051 +/- 2.6770251832304
        Measured from: -0.00800001621246338
                   to: 13.3519999980927     [s; relative to TRIGTIME]
     T50: 7.44000005722046 +/- 2.97294468953417
        Measured from: 1.92799997329712
                   to: 9.36800003051758     [s; relative to TRIGTIME]


  Fluence
     Peak Flux  (peak 1 second)
        Measured from: 2.57199996709824
                   to: 3.57199996709824     [s; relative to TRIGTIME]
     Total Fluence
        Measured from: -0.328000009059906
                   to: 15.6079999804497     [s; relative to TRIGTIME]

             Band 1     Band 2     Band 3     Band 4
              15-25      25-50     50-100    100-350     keV
 Total     0.149471   0.198568   0.121013   0.023497
           0.029870   0.027781   0.023359   0.019568 [error]
 Peak      0.017849   0.024634   0.019804   0.002206
           0.007566   0.007171   0.006073   0.004820 [error]

     [ fluence units of on-axis counts / fully illuminated detector ]

======================================================================


====== Table of the duration information =============================

        Value   tstart    tstop
T100   15.936   -0.328   15.608
T90    13.360   -0.008   13.352
T50     7.440    1.928    9.368
Peak    1.000    2.572    3.572


====== Spectral Analysis Summary =====================================

Model      : spectral model: simple power-law (PL) and cutoff power-law (CPL)
Ph_index   : photon index: E^{Ph_index}
Ph_90err   : 90% error of the photon index
Epeak      : Epeak in keV
Epeak_90err: 90% error of Epeak
Norm       : normalization at 50 keV in both the PL model and CPL model
Nomr_90err : 90% error of the normalization
chi2       : Chi-Squared
dof        : degree of freedo

=== Time-averaged spectral analysis ===
(Best model with acceptable fit: N/A)

Model Ph_index Ph_90err_low Ph_90err_hi  Epeak  Epeak_90err_low  Epeak_90err_hi  Norm       Nomr_90err_low    Norm_90err_hi    chi2    dof
PL      -1.424    -0.274      0.276       -           -               -         2.07e-03     -3.31e-04          3.30e-04      81.150   57
CPL     -0.307    -1.235      2.074       72.897     -21.402       -72.897      7.78e-03     -7.78e-03          7.76e-02      79.300   56


=== 1-s peak spectral analysis ===
(Best model with acceptable fit: PL)

Model Ph_index Ph_90err_low Ph_90err_hi  Epeak  Epeak_90err_low  Epeak_90err_hi  Norm       Nomr_90err_low    Norm_90err_hi    chi2    dof
PL      -1.175     -0.624     0.692       -           -               -         4.12e-03     -1.36e-03          1.33e-03      59.600   57
CPL     -1.184     -0.614     0.712     9999.340    -9999.340      -9999.340      4.14e-03     -4.14e-03          1.48e-02      59.600   56


=== Fluence/Peak Flux Summary ===

              Model    Band1     Band2     Band3     Band4     Band5     Total
                       15-25     25-50    50-100    100-350    15-150    15-350    keV
Fluence         PL   3.92e-08  7.54e-08  1.12e-07  3.61e-07  3.17e-07  5.88e-07   erg/cm2
      90%_error_low -1.05e-08 -1.30e-08 -2.26e-08 -1.34e-07 -5.51e-08 -1.55e-07   erg/cm2
      90%_error_hi   1.13e-08  1.28e-08  2.25e-08  1.82e-07  5.60e-08  1.93e-07   erg/cm2
Peak flux       PL   1.24e-01  1.52e-01  1.34e-01  2.05e-01  4.82e-01  6.15e-01   ph/cm2/s
      90%_error_low -7.61e-02 -6.59e-02 -4.99e-02 -1.28e-01 -1.65e-01 -2.02e-01   ph/cm2/s
      90%_error_hi   9.71e-02  6.11e-02  4.75e-02  2.30e-01  1.67e-01  2.12e-01   ph/cm2/s

Fluence        CPL   3.28e-08  8.40e-08  1.16e-07  8.55e-08  2.86e-07  3.18e-07   erg/cm2
      90%_error_low -1.35e-08 -1.69e-08 -2.73e-08 -6.92e-08 -6.50e-08 -9.46e-08   erg/cm2
      90%_error_hi   1.38e-08  1.81e-08  2.61e-08  4.58e-07  6.84e-08  3.39e-07   erg/cm2
Peak flux      CPL   1.24e-01  1.52e-01  1.34e-01  2.04e-01  4.82e-01  6.47e-01   ph/cm2/s
      90%_error_low     N/A       N/A       N/A       N/A   -1.65e-01 -2.80e-01   ph/cm2/s
      90%_error_hi      N/A       N/A       N/A       N/A    1.67e-01  2.07e-01   ph/cm2/s

======================================================================
Image
Pre-slew 15.0-350.0 keV image (Event data)
#   RAcent    DECcent   POSerr    Theta     Phi              Peak Cts       SNR   Name
  271.7828    11.1751   0.0195    20.0153  -120.8554         0.5042435      9.862 TRIG_00737125

Foreground time interval of the image:
 -0.328  15.608 (delta_t =  15.936 [sec])
Background time interval of the image:
-239.064  -0.328 (delta_t = 238.736 [sec])
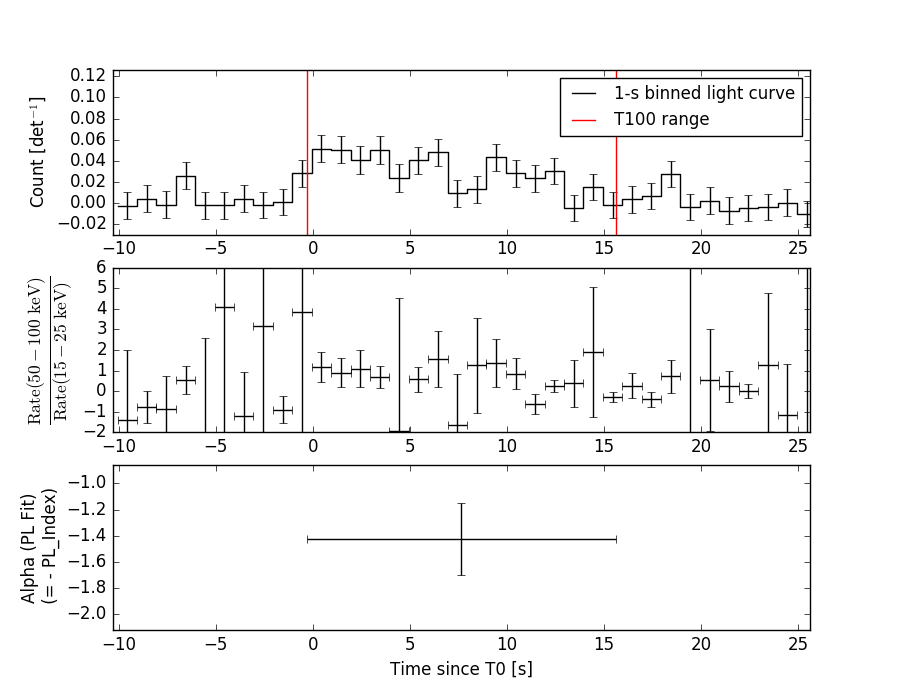
Light Curves
Note: The mask-weighted lightcurves have units of either count/det or counts/sec/det, where a det is 0.4 x 0.4 = 0.16 sq cm.
Full-time range; 1 s binning
Other quick-look light curves:
- 64 ms binning (zoomed)
- 16 ms binning (zoomed)
- 8 ms binning (zoomed)
- 2 ms binning (zoomed)
- SN=5 or 10 s binning (full-time range)
- Raw light curve
Spectra
- 64 ms binning (zoomed)
- 16 ms binning (zoomed)
- 8 ms binning (zoomed)
- 2 ms binning (zoomed)
- SN=5 or 10 s binning (full-time range)
- Raw light curve
Spectra
Notes:
- 1) The fitting includes the systematic errors.
- 2) When the burst includes telescope slew time periods, the fitting uses an average response file made from multiple 5-s response files through out the slew time plus single time preiod for the non-slew times, and weighted by the total counts in the corresponding time period using addrmf. An average response file is needed becuase a spectral fit using the pre-slew DRM will introduce some errors in both a spectral shape and a normalization if the PHA file contains a lot of the slew/post-slew time interval.
- 3) For fits to more complicated models (e.g. a power-law over a cutoff power-law), the BAT team has decided to require a chi-square improvement of more than 6 for each extra dof.
Time averaged spectrum fit using the average DRM
Power-law model
Time interval is from   -0.328 sec. to   15.608 sec.

Spectral model in power-law:
------------------------------------------------------------
Parameters  : value       lower 90%   higher 90%
Photon index: -1.42428     ( -0.273583   0.275902 )
Norm@50keV  : 2.06708E-03    ( -0.000331202   0.000330223 )
------------------------------------------------------------
#Fit statistic : Chi-Squared =          81.15 using 59 PHA bins.
# Reduced chi-squared =          1.424 for     57 degrees of freedom
# Null hypothesis probability =   1.949568e-02

Photon flux (15-150 keV)    in 15.94 sec: 0.253159 ( -0.041307  0.041486 ) ph/cm2/s
Energy fluence (15-150 keV)             : 3.16882e-07 ( -5.51374e-08  5.59626e-08 ) ergs/cm2
Cutoff power-law model
Time interval is from   -0.328 sec. to   15.608 sec.
Spectral model in the cutoff power-law:
------------------------------------------------------------
Parameters  : value       lower 90%   higher 90%
Photon index: -0.30653     ( -1.23578   2.07305 )
Epeak [keV] : 72.8971      ( -21.3844 -72.8796 )
Norm@50keV  : 7.77779E-03    ( -0.00778483   0.0776228 )
------------------------------------------------------------
#Fit statistic : Chi-Squared =          79.30 using 59 PHA bins.
# Reduced chi-squared =          1.416 for     56 degrees of freedom
# Null hypothesis probability =   2.195390e-02

Photon flux (15-150 keV)    in 15.94 sec: 0.239700 ( -0.045824  0.04506 ) ph/cm2/s
Energy fluence (15-150 keV)             : 2.85548e-07 ( -6.50325e-08  6.84403e-08 ) ergs/cm2
1-s peak spectrum fit
Power-law model
Time interval is from    2.572 sec. to    3.572 sec.

Spectral model in power-law:
------------------------------------------------------------
Parameters  : value       lower 90%   higher 90%
Photon index: -1.17454     ( -0.624447   0.692138 )
Norm@50keV  : 4.11713E-03    ( -0.00135768   0.00133151 )
------------------------------------------------------------
#Fit statistic : Chi-Squared =          59.60 using 59 PHA bins.
# Reduced chi-squared =          1.046 for     57 degrees of freedom
# Null hypothesis probability =   3.813640e-01

Photon flux (15-150 keV)    in 1 sec: 0.481608 ( -0.164924  0.166878 ) ph/cm2/s
Energy fluence (15-150 keV)             : 4.20814e-08 ( -1.45004e-08  1.4694e-08 ) ergs/cm2
Cutoff power-law model
Time interval is from    2.572 sec. to    3.572 sec.
Spectral model in the cutoff power-law:
------------------------------------------------------------
Parameters  : value       lower 90%   higher 90%
Photon index: -2.1738     ( -0.615282   0.710963 )
Epeak [keV] : 61.6752      ( -9999.36 -9999.36 )
Norm@50keV  : 1.07698E-03    ( -0.00108627   0.0178457 )
------------------------------------------------------------
#Fit statistic : Chi-Squared =          59.08 using 59 PHA bins.
# Reduced chi-squared =          1.055 for     56 degrees of freedom
# Null hypothesis probability =   3.635445e-01

Photon flux (15-150 keV)    in 1 sec: 0.481800 ( -0.165145  0.16661 ) ph/cm2/s
Energy fluence (15-150 keV)             : 4.22727e-08 ( -1.66379e-08  1.64519e-08 ) ergs/cm2
Time-resolved spectra
Distribution
T90 vs. Hardness ratio plot
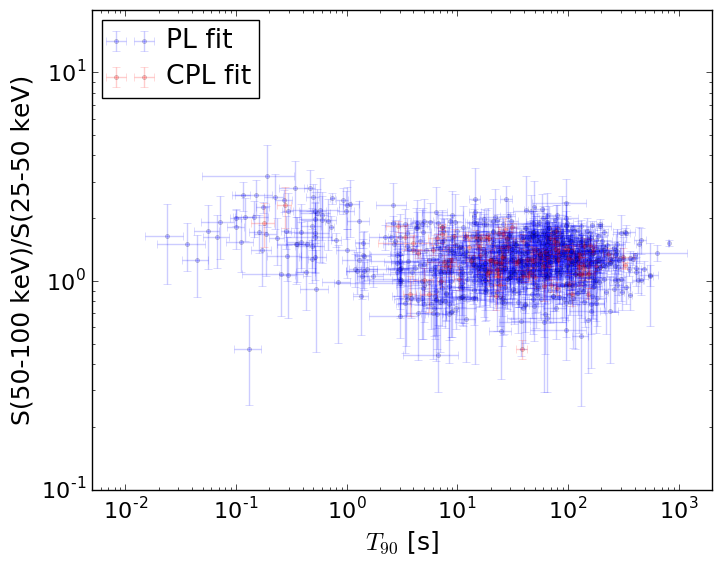
T90                                   = N/A sec.
Hardness ratio (energy fluence ratio) = N/A
S(15-50 keV) vs. S(50-150 keV) plot
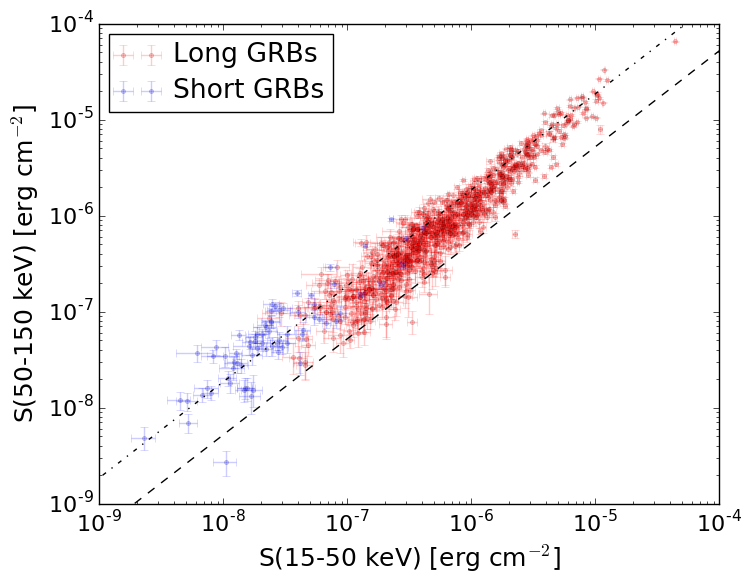
S(15-50 keV)  = N/A
S(50-150 keV) = N/A
The dash-dotted line and the dashed line traces the fluences calculated from the Band function with Epeak = 15 and 150 keV, respectively. Both lines assume a canonical values of alpha = -1 and beta = -2.5.
Mask shadow pattern
IMX = -1.868250373348678E-01, IMY = 3.127144116583480E-01
Spacecraft aspect plot
Bright source in the pre-burst/pre-slew/post-slew images
Pre-burst image of 15-350 keV band
Time interval of the image:
-239.064000 -0.328000

# RAcent  DECcent POSerr Theta    Phi  PeakCts   SNR AngSep     Name
#  [deg]    [deg]    ['] [deg]  [deg]                   [']
244.9655 -15.6334    0.2  21.6   10.0  11.8103  48.1    0.9	Sco X-1
254.4101  35.5014    6.0  31.0  172.2  -0.6449  -1.9    9.8	Her X-1
255.7953 -37.9773    0.0  42.7  -14.1  -0.1829  -0.5   12.1	4U 1700-377
256.4402 -36.4075   34.6  41.1  -15.1   0.1184   0.3    1.0	GX 349+2
262.9966 -24.7310    1.5  31.0  -28.9   2.3742   7.9    1.1	GX 1+4
264.7815 -44.3356    4.0  50.1  -21.8   1.5685   2.9    7.1	4U 1735-44
268.5103  -1.5053   10.8  16.9  -79.8   0.2870   1.1    9.1	SW J1753.5-0127
270.1175 -25.2139    7.3  34.3  -39.3   0.5530   1.6   12.1	GX 5-1
270.4536 -25.7511    5.3  34.9  -39.2   0.7947   2.2    8.2	GRS 1758-258
273.9628 -14.0524    5.1  28.2  -58.7   0.7592   2.2    2.7	GX 17+2
276.0447 -30.4966    0.0  41.6  -41.5  -1.0939  -2.5    9.9	H1820-303
284.8499 -25.0507   75.5  43.1  -55.4  -0.1094  -0.2   12.8	HT1900.1-2455
288.7804  10.9319    1.8  36.3 -112.8   3.4601   6.4    1.3	GRS 1915+105
299.6389  35.1958    4.9  53.0 -142.1   3.8322   2.4    2.4	Cyg X-1
262.8163 -33.9729    4.9  39.7  -23.7  -0.8314  -2.3   12.0	GX 354-0
230.5465  20.8057    3.5  26.9  118.4   1.2876   3.3 ------	UNKNOWN
227.6890 -34.3084    3.2  45.5   18.8   1.9696   3.6 ------	UNKNOWN
255.1060  58.4253    2.5  53.9  171.1   5.6150   4.6 ------	UNKNOWN
233.2301 -48.0869    3.9  55.4    5.2   3.7950   3.0 ------	UNKNOWN
259.8936 -25.0225    0.6  30.4  -23.5   5.7987  20.0 ------	UNKNOWN
277.1978   3.5141    3.1  24.5  -98.9   1.1003   3.7 ------	UNKNOWN
	UNKNOWN
	UNKNOWN
Pre-slew background subtracted image of 15-350 keV band
Time interval of the image:
-0.328000 15.608000

# RAcent  DECcent POSerr Theta    Phi  PeakCts   SNR AngSep     Name
#  [deg]    [deg]    ['] [deg]  [deg]                   [']
244.8659 -15.4640    0.0  21.5   10.5  -0.0514  -1.1   12.4	Sco X-1
254.5743  35.1734    0.0  30.6  172.5  -0.1127  -2.0   11.6	Her X-1
255.8031 -37.9673   12.0  42.7  -14.1   0.0719   1.0   11.4	4U 1700-377
256.2601 -36.5097   44.6  41.2  -14.9   0.0177   0.3    9.9	GX 349+2
263.0261 -24.8271    5.7  31.1  -28.9  -0.1070  -2.0    5.0	GX 1+4
264.7221 -44.4936    6.5  50.3  -21.7  -0.2032  -1.8    2.8	4U 1735-44
268.5027  -1.5429    4.1  17.0  -79.7   0.1396   2.8    9.7	SW J1753.5-0127
270.2280 -24.9372    3.5  34.1  -39.7  -0.2251  -3.3    9.0	GX 5-1
270.4767 -25.6591    8.2  34.8  -39.3  -0.0989  -1.4   10.7	GRS 1758-258
274.1421 -14.1149    3.3  28.3  -58.9   0.2253   3.5    9.2	GX 17+2
275.8511 -30.4313    4.4  41.4  -41.3  -0.2342  -2.6    5.4	H1820-303
285.1671 -24.9984    7.4  43.3  -55.8  -0.2229  -1.6    8.5	HT1900.1-2455
288.6405  10.9163    6.1  36.2 -112.8  -0.1783  -1.9    9.5	GRS 1915+105
299.4868  35.1019    5.7  52.8 -142.1   0.4980   2.0    7.8	Cyg X-1
263.1809 -33.6972    0.0  39.6  -24.3  -0.0281  -0.4   12.6	GX 354-0
244.7086  21.9567    2.6  19.0  146.2   0.2207   4.4 ------	UNKNOWN
275.3432  34.1542    2.3  36.3 -157.9   0.2909   4.9 ------	UNKNOWN
271.7828  11.1751    1.2  20.0 -120.9   0.5043   9.9 ------	UNKNOWN
Post-slew image of 15-350 keV band
Time interval of the image:
85.236600 963.056000

# RAcent  DECcent POSerr Theta    Phi  PeakCts   SNR AngSep     Name
#  [deg]    [deg]    ['] [deg]  [deg]                   [']
244.9775 -15.6400    0.3  37.7   17.6  39.6985  37.1    0.1	Sco X-1
254.2408  35.2592    6.7  28.8  121.9  -2.2040  -1.7   11.7	Her X-1
255.8295 -37.9469   23.9  51.4  -11.4   0.9714   0.5    9.7	4U 1700-377
256.4373 -36.5393    5.7  49.9  -11.4   3.0527   2.0    7.0	GX 349+2
263.0445 -24.7448    1.1  37.0  -14.3  10.1946  10.9    1.9	GX 1+4
264.6037 -44.4687    9.7  56.1  -21.3  -3.5371  -1.2    6.1	4U 1735-44
268.4537  -1.5397    7.2  13.2  -12.9   1.2343   1.6    7.3	SW J1753.5-0127
270.3222 -25.1389   10.6  36.4  -25.3   1.1209   1.1    4.1	GX 5-1
270.1699 -25.7370    9.3  37.0  -25.1   1.2555   1.2    7.2	GRS 1758-258
274.0162 -13.9814    1.7  25.3  -32.6   5.2609   6.7    3.4	GX 17+2
276.1616 -30.2913    0.0  41.7  -33.2   0.9209   0.7   13.1	H1820-303
285.2022 -24.9374    8.4  38.5  -47.3   1.8338   1.4    9.1	HT1900.1-2455
288.8074  10.9241    0.7  16.7 -118.1  13.8470  16.9    1.4	GRS 1915+105
299.5851  35.2102    0.3  34.8 -165.6  31.3211  33.0    0.6	Cyg X-1
308.1089  40.9826    2.5  43.6 -167.0   7.0160   4.5    1.8	Cyg X-3
326.1040  38.3400   16.0  55.3 -156.7   3.3286   0.7    3.4	Cyg X-2
262.9252 -33.9605    7.0  46.0  -17.3   2.3613   1.6    8.2	GX 354-0
249.4432  33.6474    2.8  30.3  113.7   5.1796   4.2 ------	UNKNOWN
249.4138 -10.5645    2.9  31.1   18.8   3.3355   4.0 ------	UNKNOWN
259.9173 -25.0248    0.5  38.1   -9.9  22.2490  22.8 ------	UNKNOWN
323.7161  49.8600    3.5  57.4 -170.4  18.9293   3.3 ------	UNKNOWN
	UNKNOWN