Analysis Summary
Notes:
- 1) No attempt has been made to eliminate the non-significant decimal places.
- 2) This batgrbproduct analysis is done using the HEASARC data.
- 3) This batgrbproduct analysis is using the flight position for the mask-weighting calculation.
======================================================================
                  BAT GRB EVENT DATA PROCESSING REPORT
    Process Script Ver: batgrbproduct v2.46
    Process Start Time: Wed Apr 12 15:13:20 EDT 2017
             Host Name: bat1
   Current Working Dir: /local/data/bat1/alien/Swift_3rdBATcatalog/event/batevent_reproc/trigger737438
======================================================================

  Trigger: 00737438      Segment: 000

  BAT Trigger Time: 508270294.912   [s; MET]
      Trigger Stop: 508270295.424   [s; MET]
               UTC: 2017-02-08T18:11:16.327540    [includes UTCF correction]
       Where From?: TDRSS position message

  BAT
    RA: 166.562700100311   Dec: -46.779089937229  [deg; J2000]

     Catalogged Source?: NO
     Point Source?:      YES
     GRB Indicated?:     YES    [ by BAT flight software ]
     Image S/N Ratio:    10.1
     Image Trigger?:     NO
     Rate S/N Ratio:     30  [ if not an image trigger ]
     Image S/N Ratio:    10.1

  Analysis Position:   [ source = BAT ]
    RA: 166.562700100311   Dec: -46.779089937229  [deg; J2000]

  Refined Position:   [ source = BAT pre-slew burst ]
    RA: 166.543749895983   Dec: -46.7859274228712  [deg; J2000]
        { 11h 06m 10.5s , -46d 47' 09.3" }
         +/- 1.38506592102022 [arcmin] (estimated 90% radius based on SNR)
         +/- 0.598865017180604 [arcmin] (formal 1-sigma fit error)
    SNR: 19.0993130012904

  Angular difference between the analysis and refined position is 0.880062 arcmin

  Partial Coding Fraction: 0.1796875    [ including projection effects ]

  Duration
     T90: 7.44799995422363 +/- 0.543293661245789
        Measured from: 0.0879999995231628
                   to: 7.5359999537468     [s; relative to TRIGTIME]
     T50: 4.97199994325638 +/- 1.07837842869592
        Measured from: 0.628000020980835
                   to: 5.59999996423721     [s; relative to TRIGTIME]


  Fluence
     Peak Flux  (peak 1 second)
        Measured from: -0.0360000133514404
                   to: 0.96399998664856     [s; relative to TRIGTIME]
     Total Fluence
        Measured from: -0.0360000133514404
                   to: 8.06000000238419     [s; relative to TRIGTIME]

             Band 1     Band 2     Band 3     Band 4
              15-25      25-50     50-100    100-350     keV
 Total     0.251649   0.605438   0.732522   0.289853
           0.047018   0.051834   0.047469   0.038076 [error]
 Peak      0.083729   0.180017   0.273886   0.096177
           0.017868   0.021800   0.022094   0.016871 [error]

     [ fluence units of on-axis counts / fully illuminated detector ]

======================================================================


====== Table of the duration information =============================

        Value   tstart    tstop
T100    8.096   -0.036    8.060
T90     7.448    0.088    7.536
T50     4.972    0.628    5.600
Peak    1.000   -0.036    0.964


====== Spectral Analysis Summary =====================================

Model      : spectral model: simple power-law (PL) and cutoff power-law (CPL)
Ph_index   : photon index: E^{Ph_index}
Ph_90err   : 90% error of the photon index
Epeak      : Epeak in keV
Epeak_90err: 90% error of Epeak
Norm       : normalization at 50 keV in both the PL model and CPL model
Nomr_90err : 90% error of the normalization
chi2       : Chi-Squared
dof        : degree of freedo

=== Time-averaged spectral analysis ===
(Best model with acceptable fit: N/A)

Model Ph_index Ph_90err_low Ph_90err_hi  Epeak  Epeak_90err_low  Epeak_90err_hi  Norm       Nomr_90err_low    Norm_90err_hi    chi2    dof
PL      -1.039    -0.131      0.136       -           -               -         1.78e-02     -1.49e-03          1.47e-03      86.960   57
CPL     -0.687    -0.409      0.592      233.046    -233.046      -233.046      2.49e-02     -8.00e-03          1.76e-02      85.680   56


=== 1-s peak spectral analysis ===
(Best model with acceptable fit: N/A)

Model Ph_index Ph_90err_low Ph_90err_hi  Epeak  Epeak_90err_low  Epeak_90err_hi  Norm       Nomr_90err_low    Norm_90err_hi    chi2    dof
PL      -1.028     -0.167     0.172       -           -               -         4.69e-02     -5.07e-03          5.02e-03      71.660   57
CPL     -0.149     -0.770     0.942      133.467     -38.593       413.316      1.06e-01     -5.34e-02          1.35e-01      67.830   56


=== Fluence/Peak Flux Summary ===

              Model    Band1     Band2     Band3     Band4     Band5     Total
                       15-25     25-50    50-100    100-350    15-150    15-350    keV
Fluence         PL   1.20e-07  2.93e-07  5.70e-07  2.73e-06  1.54e-06  3.72e-06   erg/cm2
      90%_error_low -2.03e-08 -3.15e-08 -4.37e-08 -4.45e-07 -1.17e-07 -4.61e-07   erg/cm2
      90%_error_hi   2.17e-08  3.12e-08  4.37e-08  5.05e-07  1.17e-07  5.09e-07   erg/cm2
Peak flux       PL   2.45e-04  3.03e-03  3.15e-02  2.98e+00  1.42e-01  3.00e+00   ph/cm2/s
      90%_error_low -2.47e-05 -2.96e-04 -6.37e-04 -2.97e-01 -1.90e-03 -2.79e-01   ph/cm2/s
      90%_error_hi   1.88e-04  2.00e-03  2.17e-02  1.11e+00  9.15e-02  1.17e+00   ph/cm2/s

Fluence        CPL   1.08e-07  2.97e-07  5.97e-07  1.87e-06  1.53e-06  2.87e-06   erg/cm2
      90%_error_low -2.58e-08 -3.31e-08 -5.89e-08 -7.72e-07 -1.18e-07 -7.62e-07   erg/cm2
      90%_error_hi   2.66e-08  3.33e-08  5.99e-08  8.24e-07  1.18e-07  1.04e-06   erg/cm2
Peak flux      CPL   9.24e-01  1.66e+00  1.81e+00  1.56e+00  5.24e+00  5.97e+00   ph/cm2/s
      90%_error_low -3.28e-01 -2.53e-01 -2.44e-01 -6.00e-01 -6.15e-01 -9.05e-01   ph/cm2/s
      90%_error_hi   3.71e-01  2.50e-01  2.49e-01  1.09e+00  6.20e-01  1.23e+00   ph/cm2/s

======================================================================
Image
Pre-slew 15.0-350.0 keV image (Event data)
#   RAcent    DECcent   POSerr    Theta     Phi              Peak Cts       SNR   Name
  166.5437   -46.7859   0.0101    53.2460   -20.0970         2.0011949     19.099 TRIG_00737438

Foreground time interval of the image:
 -0.036   8.060 (delta_t =   8.096 [sec])
Background time interval of the image:
-239.912  -0.036 (delta_t = 239.876 [sec])
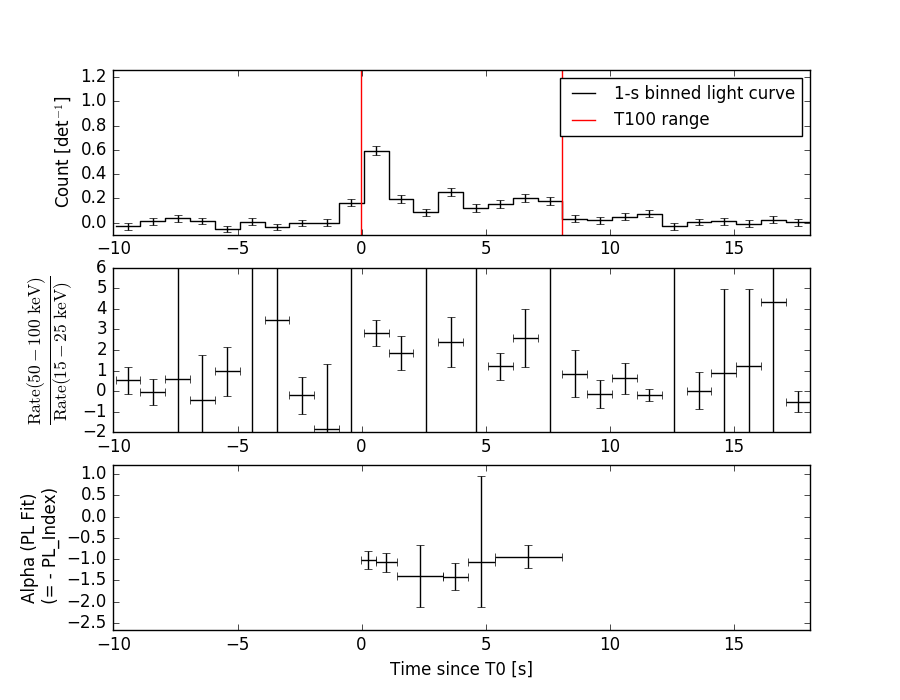
Light Curves
Note: The mask-weighted lightcurves have units of either count/det or counts/sec/det, where a det is 0.4 x 0.4 = 0.16 sq cm.
Full-time range; 1 s binning
Other quick-look light curves:
- 64 ms binning (zoomed)
- 16 ms binning (zoomed)
- 8 ms binning (zoomed)
- 2 ms binning (zoomed)
- SN=5 or 10 s binning (full-time range)
- Raw light curve
Spectra
- 64 ms binning (zoomed)
- 16 ms binning (zoomed)
- 8 ms binning (zoomed)
- 2 ms binning (zoomed)
- SN=5 or 10 s binning (full-time range)
- Raw light curve
Spectra
Notes:
- 1) The fitting includes the systematic errors.
- 2) When the burst includes telescope slew time periods, the fitting uses an average response file made from multiple 5-s response files through out the slew time plus single time preiod for the non-slew times, and weighted by the total counts in the corresponding time period using addrmf. An average response file is needed becuase a spectral fit using the pre-slew DRM will introduce some errors in both a spectral shape and a normalization if the PHA file contains a lot of the slew/post-slew time interval.
- 3) For fits to more complicated models (e.g. a power-law over a cutoff power-law), the BAT team has decided to require a chi-square improvement of more than 6 for each extra dof.
Time averaged spectrum fit using the average DRM
Power-law model
Time interval is from   -0.036 sec. to    8.060 sec.

Spectral model in power-law:
------------------------------------------------------------
Parameters  : value       lower 90%   higher 90%
Photon index: -1.03939     ( -0.130677   0.135775 )
Norm@50keV  : 1.78433E-02    ( -0.0014898   0.00147122 )
------------------------------------------------------------
#Fit statistic : Chi-Squared =          86.96 using 59 PHA bins.
# Reduced chi-squared =          1.526 for     57 degrees of freedom
# Null hypothesis probability =   6.459716e-03

Photon flux (15-150 keV)    in 8.096 sec: 2.05926 ( -0.17903  0.18036 ) ph/cm2/s
Energy fluence (15-150 keV)             : 1.54103e-06 ( -1.16531e-07  1.16693e-07 ) ergs/cm2
Cutoff power-law model
Time interval is from   -0.036 sec. to    8.060 sec.
Spectral model in the cutoff power-law:
------------------------------------------------------------
Parameters  : value       lower 90%   higher 90%
Photon index: -0.686979     ( -0.408507   0.591923 )
Epeak [keV] : 233.046      ( -233.053 -233.053 )
Norm@50keV  : 2.48953E-02    ( -0.00800007   0.017638 )
------------------------------------------------------------
#Fit statistic : Chi-Squared =          85.68 using 59 PHA bins.
# Reduced chi-squared =          1.530 for     56 degrees of freedom
# Null hypothesis probability =   6.518602e-03

Photon flux (15-150 keV)    in 8.096 sec: 2.02963 ( -0.18316  0.18509 ) ph/cm2/s
Energy fluence (15-150 keV)             : 1.5332e-06 ( -1.18191e-07  1.17961e-07 ) ergs/cm2
1-s peak spectrum fit
Power-law model
Time interval is from   -0.036 sec. to    0.964 sec.

Spectral model in power-law:
------------------------------------------------------------
Parameters  : value       lower 90%   higher 90%
Photon index: -1.02797     ( -0.167279   0.172336 )
Norm@50keV  : 4.68991E-02    ( -0.00506723   0.00502054 )
------------------------------------------------------------
#Fit statistic : Chi-Squared =          71.66 using 59 PHA bins.
# Reduced chi-squared =          1.257 for     57 degrees of freedom
# Null hypothesis probability =   9.148741e-02

Photon flux (15-150 keV)    in 1 sec: 0.141958 ( -0.001896  0.091529 ) ph/cm2/s
Energy fluence (15-150 keV)             : 5.02262e-07 ( -5.25029e-08  5.25425e-08 ) ergs/cm2
Cutoff power-law model
Time interval is from   -0.036 sec. to    0.964 sec.
Spectral model in the cutoff power-law:
------------------------------------------------------------
Parameters  : value       lower 90%   higher 90%
Photon index: -0.14945     ( -0.770484   0.942 )
Epeak [keV] : 133.467      ( -38.5922 413.316 )
Norm@50keV  : 0.105972    ( -0.0534449   0.134718 )
------------------------------------------------------------
#Fit statistic : Chi-Squared =          67.83 using 59 PHA bins.
# Reduced chi-squared =          1.211 for     56 degrees of freedom
# Null hypothesis probability =   1.335846e-01

Photon flux (15-150 keV)    in 1 sec: 5.23877 ( -0.61528  0.62044 ) ph/cm2/s
Energy fluence (15-150 keV)             : 4.98712e-07 ( -5.40603e-08  5.36833e-08 ) ergs/cm2
Time-resolved spectra
Distribution
T90 vs. Hardness ratio plot
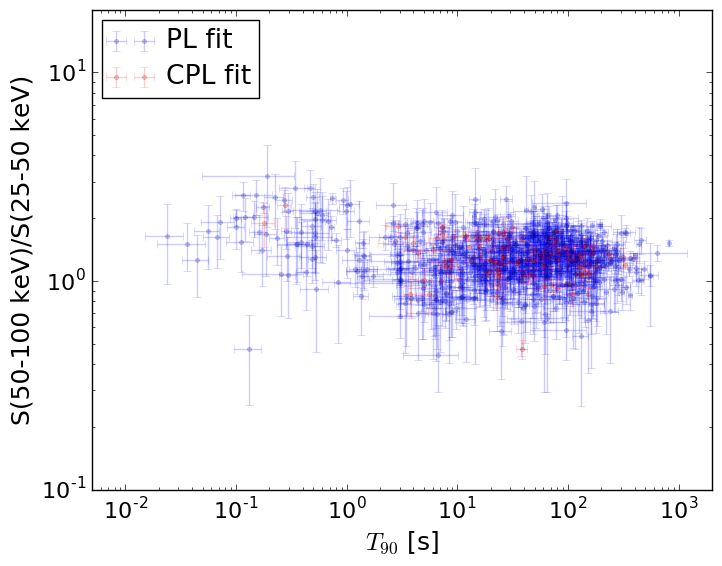
T90                                   = N/A sec.
Hardness ratio (energy fluence ratio) = N/A
S(15-50 keV) vs. S(50-150 keV) plot
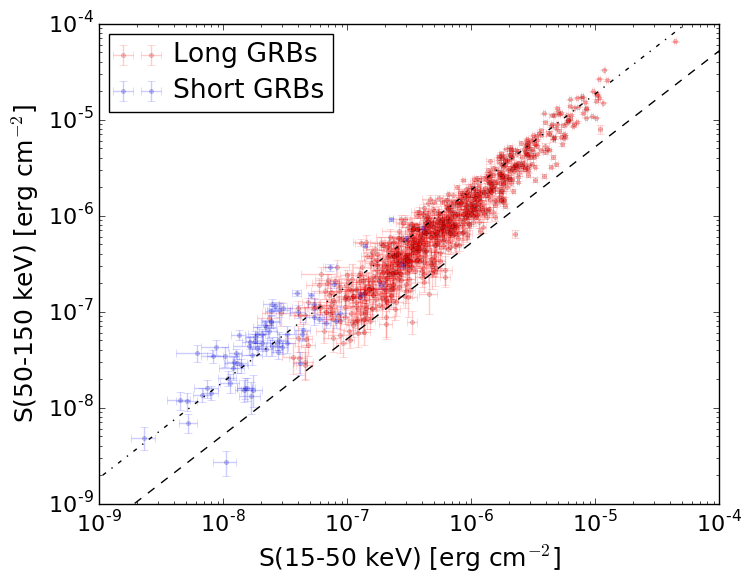
S(15-50 keV)  = N/A
S(50-150 keV) = N/A
The dash-dotted line and the dashed line traces the fluences calculated from the Band function with Epeak = 15 and 150 keV, respectively. Both lines assume a canonical values of alpha = -1 and beta = -2.5.
Mask shadow pattern
IMX = 1.257439648129232E+00, IMY = 4.600820549632218E-01
Spacecraft aspect plot
Bright source in the pre-burst/pre-slew/post-slew images
Pre-burst image of 15-350 keV band
Time interval of the image:
-239.912000 -0.036000

# RAcent  DECcent POSerr Theta    Phi  PeakCts   SNR AngSep     Name
#  [deg]    [deg]    ['] [deg]  [deg]                   [']
135.5138 -40.5555    1.3  48.1    9.2   3.6547   8.7    0.7	Vela X-1
148.9789 -50.8842    2.5  55.9   -5.4   3.2205   4.7 ------	UNKNOWN
163.6309 -13.7957    2.2  21.8  -38.5   1.0304   5.3 ------	UNKNOWN
191.0589   2.3858    4.7  38.6  -95.7   1.7359   2.5 ------	UNKNOWN
197.6880  25.9723    3.3  48.0 -129.0   3.3692   3.5 ------	UNKNOWN
Pre-slew background subtracted image of 15-350 keV band
Time interval of the image:
-0.036000 8.060000

# RAcent  DECcent POSerr Theta    Phi  PeakCts   SNR AngSep     Name
#  [deg]    [deg]    ['] [deg]  [deg]                   [']
135.6516 -40.6129   13.3  48.1    9.1   0.0674   0.9    6.6	Vela X-1
112.4244  11.4829    2.6  40.1   93.8   0.6498   4.5 ------	UNKNOWN
122.7581  49.2588    1.9  50.9  147.3   0.9399   6.2 ------	UNKNOWN
166.5437 -46.7859    0.6  53.2  -20.1   2.0007  19.1 ------	UNKNOWN
180.0453   7.8376    2.7  27.5 -105.5   0.2094   4.2 ------	UNKNOWN
185.3580  20.6360    3.1  35.6 -127.2   0.2114   3.8 ------	UNKNOWN
Post-slew image of 15-350 keV band
Time interval of the image:
103.388580 962.135100

# RAcent  DECcent POSerr Theta    Phi  PeakCts   SNR AngSep     Name
#  [deg]    [deg]    ['] [deg]  [deg]                   [']
135.5212 -40.5601    0.6  23.1   30.1  12.8837  20.7    0.5	Vela X-1
170.3839 -60.6347    2.5  14.1  -71.9   3.0103   4.6    2.1	Cen X-3
186.6444 -62.8012    2.5  19.6  -92.0   3.0997   4.7    1.9	GX 301-2
134.8277 -14.9467    2.8  41.3   65.6   9.5592   4.2 ------	UNKNOWN
145.7428 -32.7130    2.9  21.2   60.0   2.6537   4.0 ------	UNKNOWN
 83.4537 -41.7329    4.0  56.9   -1.9   7.6503   2.9 ------	UNKNOWN
 91.9563 -46.4346    2.9  49.2   -2.8   4.6846   4.0 ------	UNKNOWN
226.0253 -38.1774    3.8  43.6 -143.0   3.9950   3.1 ------	UNKNOWN
 55.4516 -81.1270    3.1  47.0  -52.8  12.8836   3.7 ------	UNKNOWN
237.9731 -50.8593    3.1  45.4 -121.4  10.3165   3.8 ------	UNKNOWN
237.8291 -44.8617    3.8  48.0 -128.8  10.1519   3.1 ------	UNKNOWN