Analysis Summary
Notes:
- 1) No attempt has been made to eliminate the non-significant decimal places.
- 2) This batgrbproduct analysis is done using the HEASARC data.
- 3) This batgrbproduct analysis is using the flight position for the mask-weighting calculation.
======================================================================
                  BAT GRB EVENT DATA PROCESSING REPORT
    Process Script Ver: batgrbproduct v2.46
    Process Start Time: Wed Apr 12 15:09:49 EDT 2017
             Host Name: bat1
   Current Working Dir: /local/data/bat1/alien/Swift_3rdBATcatalog/event/batevent_reproc/trigger737463
======================================================================

  Trigger: 00737463      Segment: 000

  BAT Trigger Time: 508286037.504   [s; MET]
      Trigger Stop: 508286038.528   [s; MET]
               UTC: 2017-02-08T22:33:38.918640    [includes UTCF correction]
       Where From?: TDRSS position message

  BAT
    RA: 127.154926883595   Dec: -9.02663175947905  [deg; J2000]

     Catalogged Source?: NO
     Point Source?:      YES
     GRB Indicated?:     YES    [ by BAT flight software ]
     Image S/N Ratio:    24.42
     Image Trigger?:     NO
     Rate S/N Ratio:     162.104904305823  [ if not an image trigger ]
     Image S/N Ratio:    24.42

  Analysis Position:   [ source = BAT ]
    RA: 127.154926883595   Dec: -9.02663175947905  [deg; J2000]

  Refined Position:   [ source = BAT pre-slew burst ]
    RA: 127.145176593062   Dec: -9.0276530394913  [deg; J2000]
        { 08h 28m 34.8s , -09d 01' 39.6" }
         +/- 0.504156686477321 [arcmin] (estimated 90% radius based on SNR)
         +/- 0.136884104728147 [arcmin] (formal 1-sigma fit error)
    SNR: 80.9142035358205

  Angular difference between the analysis and refined position is 0.581012 arcmin

  Partial Coding Fraction: 1.015625    [ including projection effects ]

  Duration
     T90: 128.135999917984 +/- 5.7189677071751
        Measured from: -5.47200000286102
                   to: 122.663999915123     [s; relative to TRIGTIME]
     T50: 7.69999992847443 +/- 0.482012482525025
        Measured from: 1.28799998760223
                   to: 8.98799991607666     [s; relative to TRIGTIME]


  Fluence
     Peak Flux  (peak 1 second)
        Measured from: 0.420000016689301
                   to: 1.4200000166893     [s; relative to TRIGTIME]
     Total Fluence
        Measured from: -18.1999999880791
                   to: 159.300000011921     [s; relative to TRIGTIME]

             Band 1     Band 2     Band 3     Band 4
              15-25      25-50     50-100    100-350     keV
 Total     3.154018   4.240395   2.863969   0.619649
           0.077338   0.080268   0.068566   0.056833 [error]
 Peak      0.176390   0.410385   0.415972   0.103736
           0.008292   0.010904   0.010975   0.006714 [error]

     [ fluence units of on-axis counts / fully illuminated detector ]

======================================================================


====== Table of the duration information =============================

        Value   tstart    tstop
T100  177.500  -18.200  159.300
T90   128.136   -5.472  122.664
T50     7.700    1.288    8.988
Peak    1.000    0.420    1.420


====== Spectral Analysis Summary =====================================

Model      : spectral model: simple power-law (PL) and cutoff power-law (CPL)
Ph_index   : photon index: E^{Ph_index}
Ph_90err   : 90% error of the photon index
Epeak      : Epeak in keV
Epeak_90err: 90% error of Epeak
Norm       : normalization at 50 keV in both the PL model and CPL model
Nomr_90err : 90% error of the normalization
chi2       : Chi-Squared
dof        : degree of freedo

=== Time-averaged spectral analysis ===
(Best model with acceptable fit: CPL)

Model Ph_index Ph_90err_low Ph_90err_hi  Epeak  Epeak_90err_low  Epeak_90err_hi  Norm       Nomr_90err_low    Norm_90err_hi    chi2    dof
PL      -1.622    -0.049      0.048       -           -               -         3.82e-03     -9.77e-05          9.76e-05      71.740   57
CPL     -1.185    -0.204      0.214       97.788     -16.157        39.215      6.16e-03     -1.20e-03          1.58e-03      57.690   56


=== 1-s peak spectral analysis ===
(Best model with acceptable fit: N/A)

Model Ph_index Ph_90err_low Ph_90err_hi  Epeak  Epeak_90err_low  Epeak_90err_hi  Norm       Nomr_90err_low    Norm_90err_hi    chi2    dof
PL      -1.009     -0.050     0.050       -           -               -         7.29e-02     -2.24e-03          2.24e-03     112.180   57
CPL     -0.186     -0.225     0.236      127.821     -16.310        26.459      1.69e-01     -3.38e-02          4.44e-02      68.590   56


=== Fluence/Peak Flux Summary ===

              Model    Band1     Band2     Band3     Band4     Band5     Total
                       15-25     25-50    50-100    100-350    15-150    15-350    keV
Fluence         PL   9.71e-07  1.66e-06  2.15e-06  5.66e-06  6.33e-06  1.04e-05   erg/cm2
      90%_error_low -4.75e-08 -4.71e-08 -7.07e-08 -4.09e-07 -1.69e-07 -4.52e-07   erg/cm2
      90%_error_hi   4.84e-08  4.70e-08  7.05e-08  4.30e-07  1.70e-07  4.69e-07   erg/cm2
Peak flux       PL   1.88e+00  2.53e+00  2.52e+00  4.51e+00  8.40e+00  1.14e+01   ph/cm2/s
      90%_error_low -1.12e-01 -9.51e-02 -8.32e-02 -3.02e-01 -2.63e-01 -3.80e-01   ph/cm2/s
      90%_error_hi   1.14e-01  9.48e-02  8.30e-02  3.15e-01  2.63e-01  3.83e-01   ph/cm2/s

Fluence        CPL   8.81e-07  1.70e-06  2.21e-06  3.18e-06  6.11e-06  7.97e-06   erg/cm2
      90%_error_low -6.06e-08 -5.25e-08 -7.71e-08 -6.88e-07 -1.97e-07 -7.15e-07   erg/cm2
      90%_error_hi   6.19e-08  5.28e-08  7.76e-08  9.23e-07  1.96e-07  9.38e-07   erg/cm2
Peak flux      CPL   1.52e+00  2.65e+00  2.79e+00  2.27e+00  8.20e+00  9.23e+00   ph/cm2/s
      90%_error_low -1.37e-01 -1.07e-01 -1.10e-01 -3.50e-01 -2.67e-01 -4.36e-01   ph/cm2/s
      90%_error_hi   1.41e-01  1.07e-01  1.11e-01  4.25e-01  2.67e-01  4.85e-01   ph/cm2/s

======================================================================
Image
Pre-slew 15.0-350.0 keV image (Event data)
#   RAcent    DECcent   POSerr    Theta     Phi              Peak Cts       SNR   Name
  127.1452    -9.0277   0.0024     5.2096   -88.5661         9.0754375     80.914 TRIG_00737463

Foreground time interval of the image:
-18.200  13.597 (delta_t =  31.797 [sec])
Background time interval of the image:
-239.504 -18.200 (delta_t = 221.304 [sec])
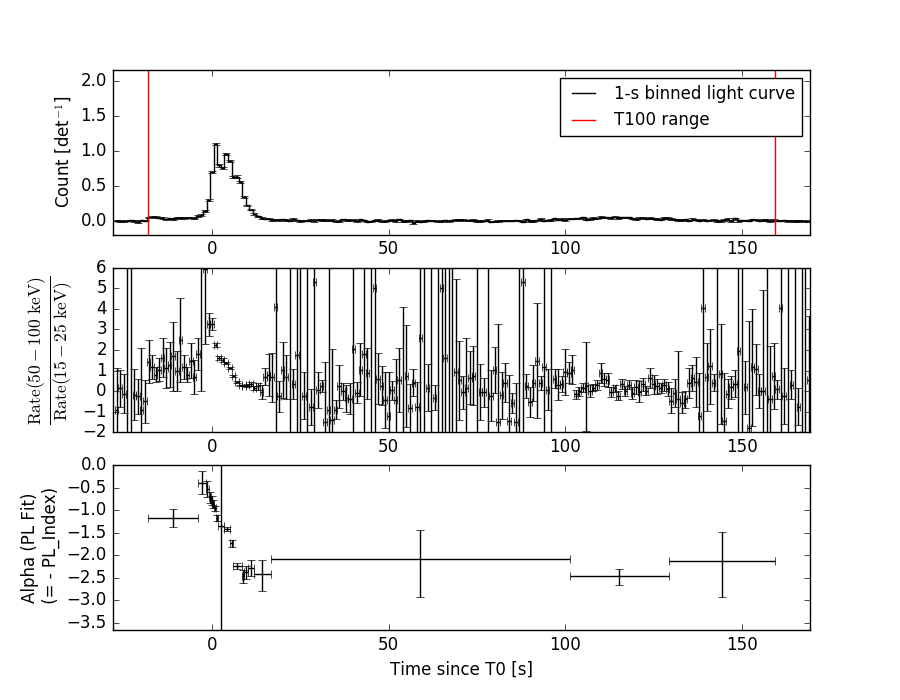
Light Curves
Note: The mask-weighted lightcurves have units of either count/det or counts/sec/det, where a det is 0.4 x 0.4 = 0.16 sq cm.
Full-time range; 1 s binning
Other quick-look light curves:
- 64 ms binning (zoomed)
- 16 ms binning (zoomed)
- 8 ms binning (zoomed)
- 2 ms binning (zoomed)
- SN=5 or 10 s binning (full-time range)
- Raw light curve
Spectra
- 64 ms binning (zoomed)
- 16 ms binning (zoomed)
- 8 ms binning (zoomed)
- 2 ms binning (zoomed)
- SN=5 or 10 s binning (full-time range)
- Raw light curve
Spectra
Notes:
- 1) The fitting includes the systematic errors.
- 2) When the burst includes telescope slew time periods, the fitting uses an average response file made from multiple 5-s response files through out the slew time plus single time preiod for the non-slew times, and weighted by the total counts in the corresponding time period using addrmf. An average response file is needed becuase a spectral fit using the pre-slew DRM will introduce some errors in both a spectral shape and a normalization if the PHA file contains a lot of the slew/post-slew time interval.
- 3) For fits to more complicated models (e.g. a power-law over a cutoff power-law), the BAT team has decided to require a chi-square improvement of more than 6 for each extra dof.
Time averaged spectrum fit using the average DRM
Power-law model
Time interval is from  -18.200 sec. to  159.300 sec.

Spectral model in power-law:
------------------------------------------------------------
Parameters  : value       lower 90%   higher 90%
Photon index: -1.62197     ( -0.048611   0.0485067 )
Norm@50keV  : 3.82088E-03    ( -9.76805e-05   9.76399e-05 )
------------------------------------------------------------
#Fit statistic : Chi-Squared =          71.74 using 59 PHA bins.
# Reduced chi-squared =          1.259 for     57 degrees of freedom
# Null hypothesis probability =   9.038666e-02

Photon flux (15-150 keV)    in 177.5 sec: 0.494419 ( -0.013887  0.01393 ) ph/cm2/s
Energy fluence (15-150 keV)             : 6.32731e-06 ( -1.69468e-07  1.69626e-07 ) ergs/cm2
Cutoff power-law model
Time interval is from  -18.200 sec. to  159.300 sec.
Spectral model in the cutoff power-law:
------------------------------------------------------------
Parameters  : value       lower 90%   higher 90%
Photon index: -1.18454     ( -0.203953   0.213698 )
Epeak [keV] : 97.7885      ( -16.1569 39.2159 )
Norm@50keV  : 6.15855E-03    ( -0.00120172   0.00157901 )
------------------------------------------------------------
#Fit statistic : Chi-Squared =          57.69 using 59 PHA bins.
# Reduced chi-squared =          1.030 for     56 degrees of freedom
# Null hypothesis probability =   4.124534e-01

Photon flux (15-150 keV)    in 177.5 sec: 0.477849 ( -0.015584  0.015657 ) ph/cm2/s
Energy fluence (15-150 keV)             : 6.10996e-06 ( -1.96679e-07  1.96251e-07 ) ergs/cm2
1-s peak spectrum fit
Power-law model
Time interval is from    0.420 sec. to    1.420 sec.

Spectral model in power-law:
------------------------------------------------------------
Parameters  : value       lower 90%   higher 90%
Photon index: -1.00873     ( -0.0497516   0.0499937 )
Norm@50keV  : 7.28967E-02    ( -0.00224429   0.00224294 )
------------------------------------------------------------
#Fit statistic : Chi-Squared =         112.18 using 59 PHA bins.
# Reduced chi-squared =         1.9681 for     57 degrees of freedom
# Null hypothesis probability =   1.801411e-05

Photon flux (15-150 keV)    in 1 sec: 8.39651 ( -0.26291  0.26304 ) ph/cm2/s
Energy fluence (15-150 keV)             : 7.85923e-07 ( -2.59818e-08  2.60096e-08 ) ergs/cm2
Cutoff power-law model
Time interval is from    0.420 sec. to    1.420 sec.
Spectral model in the cutoff power-law:
------------------------------------------------------------
Parameters  : value       lower 90%   higher 90%
Photon index: -0.185998     ( -0.225265   0.236424 )
Epeak [keV] : 127.821      ( -16.3097 26.4587 )
Norm@50keV  : 0.168985    ( -0.0337946   0.0443782 )
------------------------------------------------------------
#Fit statistic : Chi-Squared =          68.59 using 59 PHA bins.
# Reduced chi-squared =          1.225 for     56 degrees of freedom
# Null hypothesis probability =   1.205234e-01

Photon flux (15-150 keV)    in 1 sec: 8.20138 ( -0.26715  0.26734 ) ph/cm2/s
Energy fluence (15-150 keV)             : 1.24406e-07 ( 0  0 ) ergs/cm2
Time-resolved spectra
Distribution
T90 vs. Hardness ratio plot
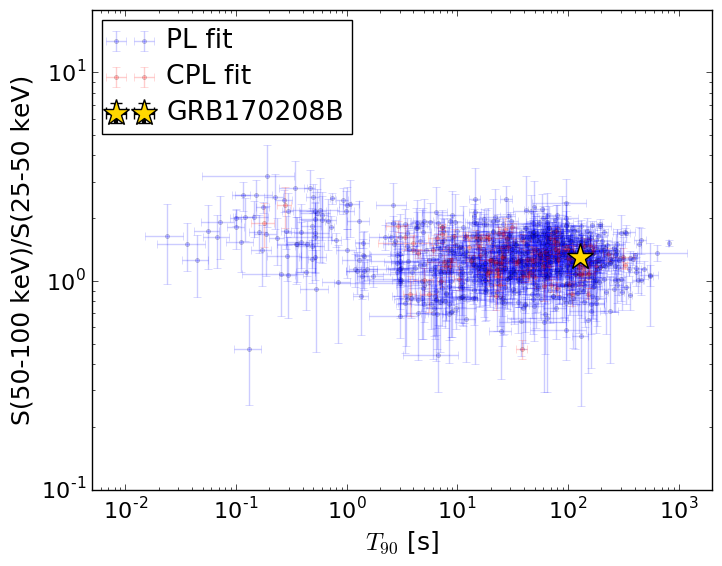
T90                                   = 128.136 sec.
Hardness ratio (energy fluence ratio) = 1.29711924488
S(15-50 keV) vs. S(50-150 keV) plot
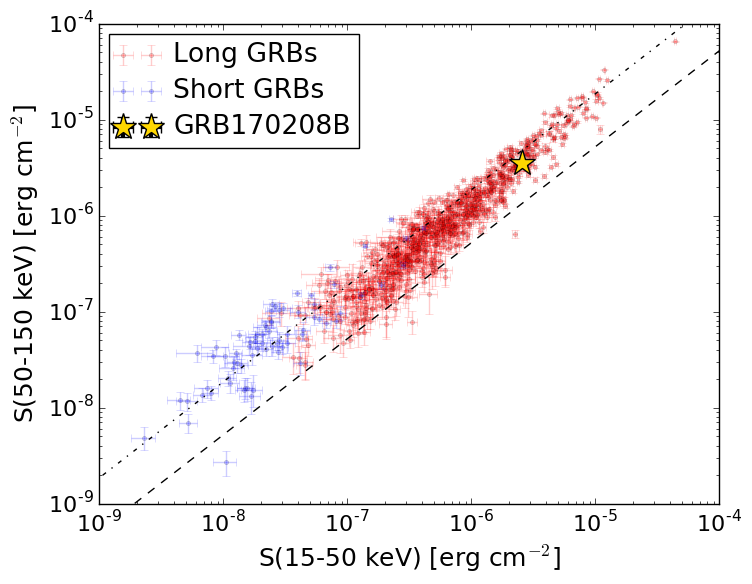
S(15-50 keV)  = 2.5831246e-06
S(50-150 keV) = 3.526786e-06
The dash-dotted line and the dashed line traces the fluences calculated from the Band function with Epeak = 15 and 150 keV, respectively. Both lines assume a canonical values of alpha = -1 and beta = -2.5.
Mask shadow pattern
IMX = 2.281533739279347E-03, IMY = 9.114666211638471E-02
Spacecraft aspect plot
Bright source in the pre-burst/pre-slew/post-slew images
Pre-burst image of 15-350 keV band
Time interval of the image:
-239.504000 -18.200000

# RAcent  DECcent POSerr Theta    Phi  PeakCts   SNR AngSep     Name
#  [deg]    [deg]    ['] [deg]  [deg]                   [']
 83.6266  22.0365    1.0  51.4   15.1   8.0935  11.9    1.4	Crab
135.5309 -40.5365    1.3  36.9 -116.0   3.5162   9.2    1.1	Vela X-1
147.3850  32.6694    2.9  40.8   96.6   3.7622   4.0 ------	UNKNOWN
122.9528  -5.7734    3.5   6.1  -33.6   0.6258   3.3 ------	UNKNOWN
 89.5633 -30.6700    2.8  45.5  -57.8   4.0489   4.1 ------	UNKNOWN
137.7682 -47.4577    2.6  44.0 -116.2   3.6904   4.4 ------	UNKNOWN
Pre-slew background subtracted image of 15-350 keV band
Time interval of the image:
-18.200000 13.596590

# RAcent  DECcent POSerr Theta    Phi  PeakCts   SNR AngSep     Name
#  [deg]    [deg]    ['] [deg]  [deg]                   [']
 83.5125  21.9195    4.8  51.4   14.9   0.8994   2.4    8.8	Crab
135.5422 -40.5893    3.5  37.0 -116.0  -0.6903  -3.2    2.2	Vela X-1
102.3331  24.6047    1.7  38.6   31.8   1.2368   6.6 ------	UNKNOWN
127.1452  -9.0276    0.1   5.2  -88.6   9.0757  80.9 ------	UNKNOWN
 70.2505   2.3413    2.4  58.9  -12.3   3.0995   4.8 ------	UNKNOWN
102.4158 -28.0245    2.5  34.7  -63.9   0.8785   4.6 ------	UNKNOWN
Post-slew image of 15-350 keV band
Time interval of the image:
48.796590 962.556800

# RAcent  DECcent POSerr Theta    Phi  PeakCts   SNR AngSep     Name
#  [deg]    [deg]    ['] [deg]  [deg]                   [']
 83.6276  22.0197    0.6  52.8    3.6  32.2923  19.9    0.4	Crab
135.5480 -40.5468    0.5  32.4 -135.0  18.7947  25.0    1.0	Vela X-1
109.5097  32.7628    3.1  45.0   35.8   5.1612   3.8 ------	UNKNOWN
 78.9301  19.9325    2.5  55.6   -1.2  10.1219   4.7 ------	UNKNOWN
120.9990  -9.1044    3.5   6.1  -34.5   1.8060   3.4 ------	UNKNOWN
169.4881 -51.7153    2.9  54.9 -153.7  12.0467   4.0 ------	UNKNOWN
 93.1021 -33.9597    3.4  40.0  -76.8   8.0411   3.4 ------	UNKNOWN
 83.4662 -25.2838    3.0  44.5  -60.1  12.5257   3.9 ------	UNKNOWN