Analysis Summary
Notes:
- 1) No attempt has been made to eliminate the non-significant decimal places.
- 2) This batgrbproduct analysis is done using the HEASARC data.
- 3) This batgrbproduct analysis is using the flight position for the mask-weighting calculation.
======================================================================
BAT GRB EVENT DATA PROCESSING REPORT
Process Script Ver: batgrbproduct v2.46
Process Start Time: Wed Apr 12 14:54:41 EDT 2017
Host Name: bat1
Current Working Dir: /local/data/bat1/alien/Swift_3rdBATcatalog/event/batevent_reproc/trigger741528
======================================================================
Trigger: 00741528 Segment: 000
BAT Trigger Time: 510611080 [s; MET]
Trigger Stop: 510611152 [s; MET]
UTC: 2017-03-07T20:24:21.280840 [includes UTCF correction]
Where From?: TDRSS position message
BAT
RA: 13.5352800445089 Dec: 9.53652894499694 [deg; J2000]
Catalogged Source?: NO
Point Source?: YES
GRB Indicated?: YES [ by BAT flight software ]
Image S/N Ratio: 7.12
Image Trigger?: YES
Rate S/N Ratio: 0 [ if not an image trigger ]
Image S/N Ratio: 7.12
Analysis Position: [ source = BAT ]
RA: 13.5352800445089 Dec: 9.53652894499694 [deg; J2000]
Refined Position: [ source = BAT pre-slew burst ]
RA: 13.514118959145 Dec: 9.53587930870353 [deg; J2000]
{ 00h 54m 03.4s , +09d 32' 09.2" }
+/- 2.46736282940119 [arcmin] (estimated 90% radius based on SNR)
+/- 1.38057196833961 [arcmin] (formal 1-sigma fit error)
SNR: 8.37115719688091
Angular difference between the analysis and refined position is 1.252726 arcmin
Partial Coding Fraction: 0.4335938 [ including projection effects ]
Duration
T90: 29.91999989748 +/- 28.176160486023
Measured from: 56.160000026226
to: 86.0799999237061 [s; relative to TRIGTIME]
T50: 13.2159999012947 +/- 6.53420695337461
Measured from: 65.2200000286102
to: 78.4359999299049 [s; relative to TRIGTIME]
Fluence
Peak Flux (peak 1 second)
Measured from: 69.7239999771118
to: 70.7239999771118 [s; relative to TRIGTIME]
Total Fluence
Measured from: 55.2039999961853
to: 125.096000015736 [s; relative to TRIGTIME]
Band 1 Band 2 Band 3 Band 4
15-25 25-50 50-100 100-350 keV
Total 0.824420 0.818859 0.501033 0.207930
0.085220 0.092843 0.088831 0.095467 [error]
Peak 0.054904 0.068698 0.035263 -0.012848
0.010868 0.012384 0.011454 0.011525 [error]
[ fluence units of on-axis counts / fully illuminated detector ]
======================================================================
====== Table of the duration information =============================
Value tstart tstop
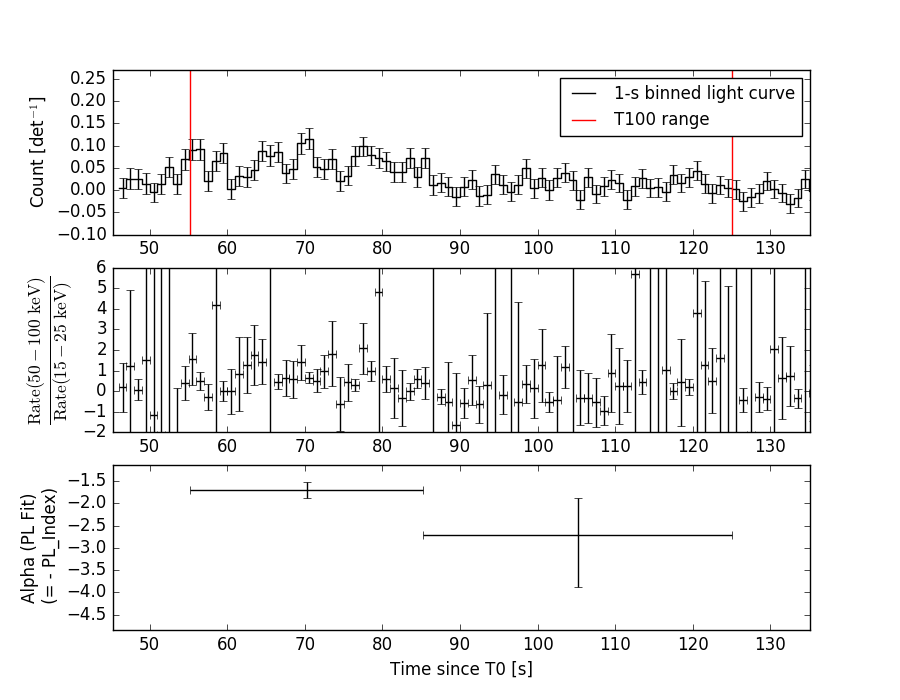
T100 69.892 55.204 125.096
T90 29.920 56.160 86.080
T50 13.216 65.220 78.436
Peak 1.000 69.724 70.724
====== Spectral Analysis Summary =====================================
Model : spectral model: simple power-law (PL) and cutoff power-law (CPL)
Ph_index : photon index: E^{Ph_index}
Ph_90err : 90% error of the photon index
Epeak : Epeak in keV
Epeak_90err: 90% error of Epeak
Norm : normalization at 50 keV in both the PL model and CPL model
Nomr_90err : 90% error of the normalization
chi2 : Chi-Squared
dof : degree of freedo
=== Time-averaged spectral analysis ===
(Best model with acceptable fit: PL)
Model Ph_index Ph_90err_low Ph_90err_hi Epeak Epeak_90err_low Epeak_90err_hi Norm Nomr_90err_low Norm_90err_hi chi2 dof
PL -1.886 -0.236 0.223 - - - 2.05e-03 -3.14e-04 3.06e-04 44.580 57
CPL -1.734 -0.529 0.979 71.924 N/A N/A 2.51e-03 N/A N/A 44.480 56
=== 1-s peak spectral analysis ===
(Best model with acceptable fit: PL)
Model Ph_index Ph_90err_low Ph_90err_hi Epeak Epeak_90err_low Epeak_90err_hi Norm Nomr_90err_low Norm_90err_hi chi2 dof
PL -1.902 -0.399 0.359 - - - 9.90e-03 -2.71e-03 2.63e-03 58.750 57
CPL -0.407 -1.676 4.077 40.478 -14.820 -40.478 8.18e-02 -8.18e-02 4.48e+01 56.550 56
=== Fluence/Peak Flux Summary ===
Model Band1 Band2 Band3 Band4 Band5 Total
15-25 25-50 50-100 100-350 15-150 15-350 keV
Fluence PL 2.63e-07 3.82e-07 4.13e-07 8.36e-07 1.32e-06 1.89e-06 erg/cm2
90%_error_low -4.33e-08 -4.52e-08 -8.58e-08 -3.01e-07 -1.95e-07 -4.03e-07 erg/cm2
90%_error_hi 4.43e-08 4.51e-08 8.82e-08 4.01e-07 2.02e-07 4.85e-07 erg/cm2
Peak flux PL 6.00e-01 4.77e-01 2.55e-01 1.99e-01 1.42e+00 1.53e+00 ph/cm2/s
90%_error_low -1.66e-01 -1.01e-01 -8.73e-02 -1.04e-01 -3.00e-01 -3.33e-01 ph/cm2/s
90%_error_hi 1.74e-01 1.01e-01 9.15e-02 1.58e-01 3.00e-01 3.38e-01 ph/cm2/s
Fluence CPL 2.60e-07 3.89e-07 4.10e-07 6.07e-07 1.29e-06 1.67e-06 erg/cm2
90%_error_low -4.66e-08 -5.13e-08 -9.80e-08 -4.90e-07 -2.38e-07 -5.72e-07 erg/cm2
90%_error_hi 4.64e-08 6.18e-08 9.10e-08 2.99e-07 1.99e-07 3.68e-07 erg/cm2
Peak flux CPL 5.51e-01 5.66e-01 2.23e-01 2.78e-02 1.36e+00 1.37e+00 ph/cm2/s
90%_error_low -1.84e-01 -1.45e-01 -2.23e-01 -2.78e-02 -3.02e-01 -3.05e-01 ph/cm2/s
90%_error_hi 1.87e-01 1.66e-01 1.18e-01 2.17e-01 3.05e-01 3.30e-01 ph/cm2/s
======================================================================
Image
Pre-slew 15.0-350.0 keV image (Event data)
#   RAcent    DECcent   POSerr    Theta     Phi              Peak Cts       SNR   Name
   13.5141     9.5359   0.0229    33.2805   -55.7184         2.1799000      8.371 TRIG_00741528

Foreground time interval of the image:
 55.204 125.096 (delta_t =  69.892 [sec])
Background time interval of the image:
-60.000  55.204 (delta_t = 115.204 [sec])
Light Curves
Note: The mask-weighted lightcurves have units of either count/det or counts/sec/det, where a det is 0.4 x 0.4 = 0.16 sq cm.
Full-time range; 1 s binning
Other quick-look light curves:
- 64 ms binning (zoomed)
- 16 ms binning (zoomed)
- 8 ms binning (zoomed)
- 2 ms binning (zoomed)
- SN=5 or 10 s binning (full-time range)
- Raw light curve
Spectra
- 64 ms binning (zoomed)
- 16 ms binning (zoomed)
- 8 ms binning (zoomed)
- 2 ms binning (zoomed)
- SN=5 or 10 s binning (full-time range)
- Raw light curve
Spectra
Notes:
- 1) The fitting includes the systematic errors.
- 2) When the burst includes telescope slew time periods, the fitting uses an average response file made from multiple 5-s response files through out the slew time plus single time preiod for the non-slew times, and weighted by the total counts in the corresponding time period using addrmf. An average response file is needed becuase a spectral fit using the pre-slew DRM will introduce some errors in both a spectral shape and a normalization if the PHA file contains a lot of the slew/post-slew time interval.
- 3) For fits to more complicated models (e.g. a power-law over a cutoff power-law), the BAT team has decided to require a chi-square improvement of more than 6 for each extra dof.
Time averaged spectrum fit using the average DRM
Power-law model
Time interval is from   55.204 sec. to  125.096 sec.

Spectral model in power-law:
------------------------------------------------------------
Parameters  : value       lower 90%   higher 90%
Photon index: -1.88575     ( -0.235828   0.222683 )
Norm@50keV  : 2.04709E-03    ( -0.000314219   0.000305574 )
------------------------------------------------------------
#Fit statistic : Chi-Squared =          44.58 using 59 PHA bins.
# Reduced chi-squared =         0.7822 for     57 degrees of freedom
# Null hypothesis probability =   8.841957e-01

Photon flux (15-150 keV)    in 69.89 sec: 0.292036 ( -0.034122  0.034122 ) ph/cm2/s
Energy fluence (15-150 keV)             : 1.31545e-06 ( -1.95147e-07  2.01515e-07 ) ergs/cm2
Cutoff power-law model
Time interval is from   55.204 sec. to  125.096 sec.
Spectral model in the cutoff power-law:
------------------------------------------------------------
Parameters  : value       lower 90%   higher 90%
Photon index: -1.73435     ( -0.529437   0.979151 )
Epeak [keV] : 71.9241      (   )
Norm@50keV  : 2.51282E-03    (     )
------------------------------------------------------------
#Fit statistic : Chi-Squared =          44.48 using 59 PHA bins.
# Reduced chi-squared =         0.7944 for     56 degrees of freedom
# Null hypothesis probability =   8.662812e-01

Photon flux (15-150 keV)    in 69.89 sec: 0.290115 ( -0.03562  0.035338 ) ph/cm2/s
Energy fluence (15-150 keV)             : 1.28835e-06 ( -2.38411e-07  1.99381e-07 ) ergs/cm2
1-s peak spectrum fit
Power-law model
Time interval is from   69.724 sec. to   70.724 sec.

Spectral model in power-law:
------------------------------------------------------------
Parameters  : value       lower 90%   higher 90%
Photon index: -1.90211     ( -0.398759   0.359068 )
Norm@50keV  : 9.90036E-03    ( -0.00271006   0.00262972 )
------------------------------------------------------------
#Fit statistic : Chi-Squared =          58.75 using 59 PHA bins.
# Reduced chi-squared =          1.031 for     57 degrees of freedom
# Null hypothesis probability =   4.112803e-01

Photon flux (15-150 keV)    in 1 sec: 1.42218 ( -0.29987  0.29995 ) ph/cm2/s
Energy fluence (15-150 keV)             : 9.10458e-08 ( -2.35992e-08  2.49013e-08 ) ergs/cm2
Cutoff power-law model
Time interval is from   69.724 sec. to   70.724 sec.
Spectral model in the cutoff power-law:
------------------------------------------------------------
Parameters  : value       lower 90%   higher 90%
Photon index: -0.407043     ( -1.68219   4.07077 )
Epeak [keV] : 40.4779      ( -14.7666 -40.4239 )
Norm@50keV  : 8.17516E-02    ( -0.0830045   44.8315 )
------------------------------------------------------------
#Fit statistic : Chi-Squared =          56.55 using 59 PHA bins.
# Reduced chi-squared =          1.010 for     56 degrees of freedom
# Null hypothesis probability =   4.541734e-01

Photon flux (15-150 keV)    in 1 sec: 1.36453 ( -0.30181  0.30513 ) ph/cm2/s
Energy fluence (15-150 keV)             : 7.71472e-08 ( -2.39168e-08  2.90395e-08 ) ergs/cm2
Time-resolved spectra
Distribution
T90 vs. Hardness ratio plot
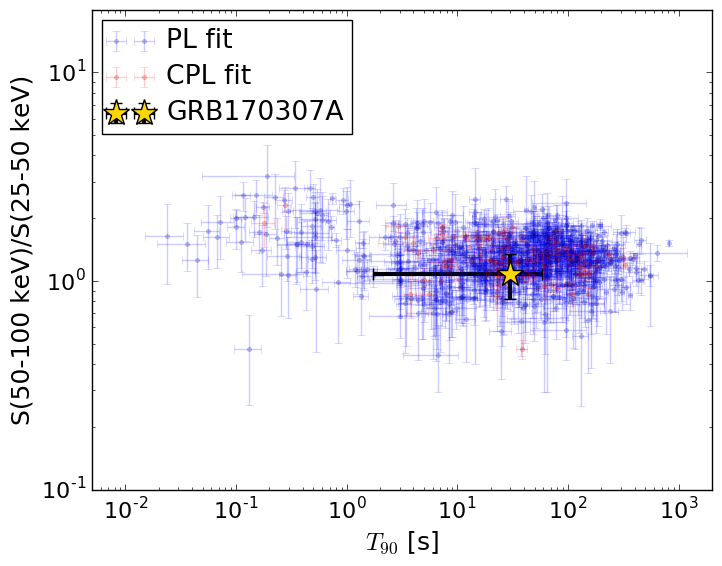
T90                                   = 29.92 sec.
Hardness ratio (energy fluence ratio) = 1.08245538743
S(15-50 keV) vs. S(50-150 keV) plot
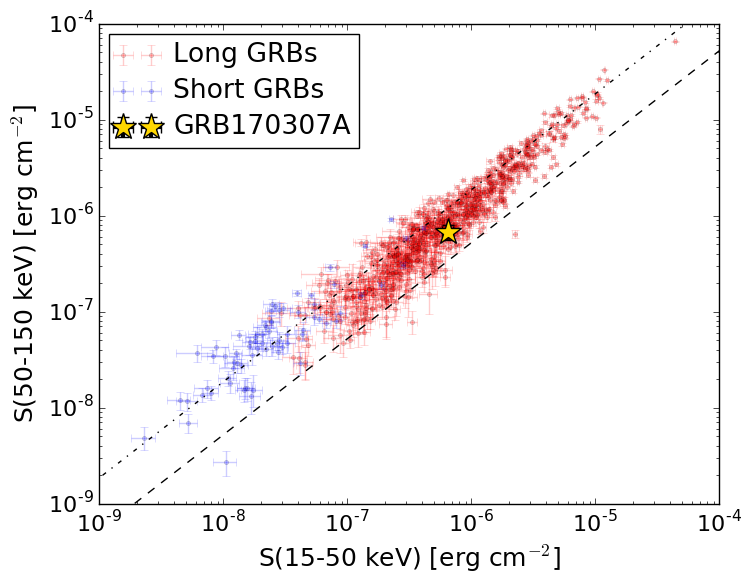
S(15-50 keV)  = 6.44644e-07
S(50-150 keV) = 6.708224e-07
The dash-dotted line and the dashed line traces the fluences calculated from the Band function with Epeak = 15 and 150 keV, respectively. Both lines assume a canonical values of alpha = -1 and beta = -2.5.
Mask shadow pattern
IMX = 3.697188030351253E-01, IMY = 5.423614920818834E-01
Spacecraft aspect plot
Bright source in the pre-burst/pre-slew/post-slew images
Pre-burst image of 15-350 keV band
Time interval of the image:
-60.000000 55.204000

# RAcent  DECcent POSerr Theta    Phi  PeakCts   SNR AngSep     Name
#  [deg]    [deg]    ['] [deg]  [deg]                   [']
 69.4353  35.0971    2.4  52.7   28.9   5.8235   4.8 ------	UNKNOWN
 59.9715   0.9974    2.7  22.2   60.6   0.9995   4.2 ------	UNKNOWN
 28.4947 -44.0532    2.4  35.6 -165.8   1.2271   4.8 ------	UNKNOWN
 19.4498  -1.0193    2.8  22.9  -69.0   1.0980   4.1 ------	UNKNOWN
  2.0541  13.2337    3.1  44.8  -60.3   3.8316   3.7 ------	UNKNOWN
Pre-slew background subtracted image of 15-350 keV band
Time interval of the image:
55.204000 125.096000

# RAcent  DECcent POSerr Theta    Phi  PeakCts   SNR AngSep     Name
#  [deg]    [deg]    ['] [deg]  [deg]                   [']
  5.4658 -61.5338    2.9  57.6 -161.8   3.7872   3.9 ------	UNKNOWN
 13.5156   9.5368    1.4  33.3  -55.7   2.2188   8.5 ------	UNKNOWN
358.5688 -15.4478    2.1  41.3 -102.9   3.9267   5.6 ------	UNKNOWN
Post-slew image of 15-350 keV band
Time interval of the image:
366.200640 963.090000

# RAcent  DECcent POSerr Theta    Phi  PeakCts   SNR AngSep     Name
#  [deg]    [deg]    ['] [deg]  [deg]                   [']
135.5115 -40.5241    0.9  30.3    5.5   6.7708  12.2    2.0	Vela X-1
170.4827 -60.4494   22.6  22.9  -61.4   0.3827   0.5   11.5	Cen X-3
186.4586 -62.8259    7.7  26.1  -79.0   1.1393   1.5    6.4	GX 301-2
155.8464 -22.7280    3.5  22.1   60.7   1.8543   3.3 ------	UNKNOWN
 90.3049 -51.0283    2.8  58.4  -19.5  10.7965   4.1 ------	UNKNOWN
 97.4271 -72.5502    4.3  50.5  -44.5   7.8310   2.7 ------	UNKNOWN
237.0810 -49.1577    4.1  45.3 -121.3   6.6411   2.8 ------	UNKNOWN