Analysis Summary
Notes:
- 1) No attempt has been made to eliminate the non-significant decimal places.
- 2) This batgrbproduct analysis is done using the HEASARC data.
- 3) This batgrbproduct analysis is using the flight position for the mask-weighting calculation.
======================================================================
                  BAT GRB EVENT DATA PROCESSING REPORT
    Process Script Ver: batgrbproduct v2.46
    Process Start Time: Wed Apr 12 14:50:10 EDT 2017
             Host Name: bat1
   Current Working Dir: /local/data/bat1/alien/Swift_3rdBATcatalog/event/batevent_reproc/trigger741965
======================================================================

  Trigger: 00741965      Segment: 000

  BAT Trigger Time: 510912541.696   [s; MET]
      Trigger Stop: 510912545.792   [s; MET]
               UTC: 2017-03-11T08:08:42.959380    [includes UTCF correction]
       Where From?: TDRSS position message

  BAT
    RA: 280.563140731264   Dec: -30.0629025629876  [deg; J2000]

     Catalogged Source?: NO
     Point Source?:      YES
     GRB Indicated?:     YES    [ by BAT flight software ]
     Image S/N Ratio:    7.33
     Image Trigger?:     NO
     Rate S/N Ratio:     10.6770782520313  [ if not an image trigger ]
     Image S/N Ratio:    7.33

  Analysis Position:   [ source = BAT ]
    RA: 280.563140731264   Dec: -30.0629025629876  [deg; J2000]

  Refined Position:   [ source = BAT pre-slew burst ]
    RA: 280.54104496463   Dec: -30.0380810995338  [deg; J2000]
        { 18h 42m 09.9s , -30d 02' 17.1" }
         +/- 1.99126309102757 [arcmin] (estimated 90% radius based on SNR)
         +/- 0.935597673806017 [arcmin] (formal 1-sigma fit error)
    SNR: 11.3708189797564

  Angular difference between the analysis and refined position is 1.880116 arcmin

  Partial Coding Fraction: 0.6484375    [ including projection effects ]

  Duration
     T90: 9 +/- 2.82842712474619
        Measured from: -3.69599997997284
                   to: 5.30400002002716     [s; relative to TRIGTIME]
     T50: 3 +/- 2.82842712474619
        Measured from: -0.695999979972839
                   to: 2.30400002002716     [s; relative to TRIGTIME]


  Fluence
     Peak Flux  (peak 1 second)
        Measured from: 1.30400002002716
                   to: 2.30400002002716     [s; relative to TRIGTIME]
     Total Fluence
        Measured from: -3.69599997997284
                   to: 6.30400002002716     [s; relative to TRIGTIME]

             Band 1     Band 2     Band 3     Band 4
              15-25      25-50     50-100    100-350     keV
 Total     0.126156   0.153136   0.117645   0.050374
           0.025619   0.025839   0.022495   0.018260 [error]
 Peak      0.008891   0.023565   0.027577   0.019661
           0.008452   0.008219   0.007735   0.005829 [error]

     [ fluence units of on-axis counts / fully illuminated detector ]

======================================================================


====== Table of the duration information =============================

        Value   tstart    tstop
T100   10.000   -3.696    6.304
T90     9.000   -3.696    5.304
T50     3.000   -0.696    2.304
Peak    1.000    1.304    2.304


====== Spectral Analysis Summary =====================================

Model      : spectral model: simple power-law (PL) and cutoff power-law (CPL)
Ph_index   : photon index: E^{Ph_index}
Ph_90err   : 90% error of the photon index
Epeak      : Epeak in keV
Epeak_90err: 90% error of Epeak
Norm       : normalization at 50 keV in both the PL model and CPL model
Nomr_90err : 90% error of the normalization
chi2       : Chi-Squared
dof        : degree of freedo

=== Time-averaged spectral analysis ===
(Best model with acceptable fit: PL)

Model Ph_index Ph_90err_low Ph_90err_hi  Epeak  Epeak_90err_low  Epeak_90err_hi  Norm       Nomr_90err_low    Norm_90err_hi    chi2    dof
PL      -1.301    -0.330      0.341       -           -               -         3.09e-03     -5.06e-04          5.06e-04      59.210   57
CPL     -1.328    -1.764     -0.501     9999.360      N/A           N/A         3.07e-03        N/A               N/A         59.270   56


=== 1-s peak spectral analysis ===
(Best model with acceptable fit: PL)

Model Ph_index Ph_90err_low Ph_90err_hi  Epeak  Epeak_90err_low  Epeak_90err_hi  Norm       Nomr_90err_low    Norm_90err_hi    chi2    dof
PL      -1.071     -0.612     0.671       -           -               -         4.99e-03     -1.69e-03          1.65e-03      60.240   57
CPL     -0.826      0.826     4.443      274.383    -274.383      -274.383      6.41e-03     -3.04e-03          2.91e-01      60.290   56


=== Fluence/Peak Flux Summary ===

              Model    Band1     Band2     Band3     Band4     Band5     Total
                       15-25     25-50    50-100    100-350    15-150    15-350    keV
Fluence         PL   3.27e-08  6.80e-08  1.10e-07  4.03e-07  3.05e-07  6.14e-07   erg/cm2
      90%_error_low -1.06e-08 -1.33e-08 -2.35e-08 -1.68e-07 -5.64e-08 -1.85e-07   erg/cm2
      90%_error_hi   1.16e-08  1.27e-08  2.27e-08  2.44e-07  5.69e-08  2.50e-07   erg/cm2
Peak flux       PL   1.36e-01  1.77e-01  1.69e-01  2.84e-01  5.77e-01  7.67e-01   ph/cm2/s
      90%_error_low -8.33e-02 -7.75e-02 -6.16e-02 -1.75e-01 -1.98e-01 -2.59e-01   ph/cm2/s
      90%_error_hi   1.09e-01  7.37e-02  5.93e-02  3.05e-01  2.00e-01  2.82e-01   ph/cm2/s

Fluence        CPL   3.28e-08  6.79e-08  1.05e-07  3.99e-07  3.02e-07  6.01e-07   erg/cm2
      90%_error_low -1.07e-08 -1.39e-08    N/A       N/A       N/A    -2.04e-07   erg/cm2
      90%_error_hi   1.16e-08  1.34e-08    N/A       N/A       N/A     2.59e-07   erg/cm2
Peak flux      CPL   1.39e-01  1.77e-01  1.67e-01  2.83e-01  5.79e-01  7.91e-01   ph/cm2/s
      90%_error_low -9.82e-02     N/A   -6.08e-02     N/A   -2.14e-01 -4.26e-01   ph/cm2/s
      90%_error_hi   1.09e-01     N/A    8.43e-02     N/A    2.00e-01  2.37e-01   ph/cm2/s

======================================================================
Image
Pre-slew 15.0-350.0 keV image (Event data)
#   RAcent    DECcent   POSerr    Theta     Phi              Peak Cts       SNR   Name
  280.5410   -30.0381   0.0169    26.8576    42.3843         0.5203280     11.371 TRIG_00741965

Foreground time interval of the image:
 -3.696   6.304 (delta_t =  10.000 [sec])
Background time interval of the image:
-364.195 -346.257 (delta_t =  17.938 [sec])
-239.696  -3.696 (delta_t = 236.000 [sec])
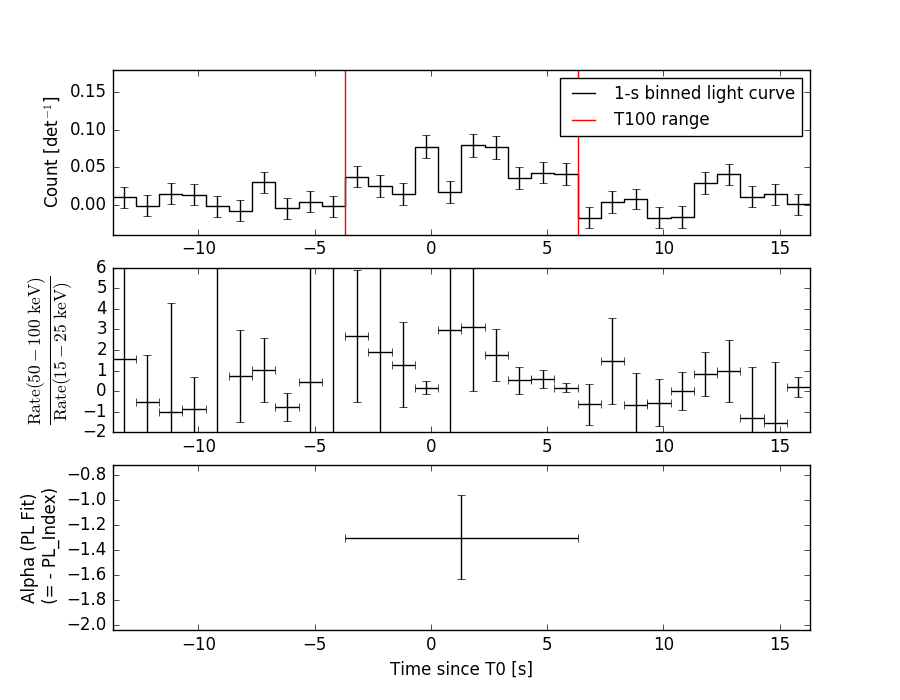
Light Curves
Note: The mask-weighted lightcurves have units of either count/det or counts/sec/det, where a det is 0.4 x 0.4 = 0.16 sq cm.
Full-time range; 1 s binning
Other quick-look light curves:
- 64 ms binning (zoomed)
- 16 ms binning (zoomed)
- 8 ms binning (zoomed)
- 2 ms binning (zoomed)
- SN=5 or 10 s binning (full-time range)
- Raw light curve
Spectra
- 64 ms binning (zoomed)
- 16 ms binning (zoomed)
- 8 ms binning (zoomed)
- 2 ms binning (zoomed)
- SN=5 or 10 s binning (full-time range)
- Raw light curve
Spectra
Notes:
- 1) The fitting includes the systematic errors.
- 2) When the burst includes telescope slew time periods, the fitting uses an average response file made from multiple 5-s response files through out the slew time plus single time preiod for the non-slew times, and weighted by the total counts in the corresponding time period using addrmf. An average response file is needed becuase a spectral fit using the pre-slew DRM will introduce some errors in both a spectral shape and a normalization if the PHA file contains a lot of the slew/post-slew time interval.
- 3) For fits to more complicated models (e.g. a power-law over a cutoff power-law), the BAT team has decided to require a chi-square improvement of more than 6 for each extra dof.
Time averaged spectrum fit using the average DRM
Power-law model
Time interval is from   -3.696 sec. to    6.304 sec.

Spectral model in power-law:
------------------------------------------------------------
Parameters  : value       lower 90%   higher 90%
Photon index: -1.30051     ( -0.329556   0.34072 )
Norm@50keV  : 3.08880E-03    ( -0.000506426   0.00050624 )
------------------------------------------------------------
#Fit statistic : Chi-Squared =          59.21 using 59 PHA bins.
# Reduced chi-squared =          1.039 for     57 degrees of freedom
# Null hypothesis probability =   3.948529e-01

Photon flux (15-150 keV)    in 10 sec: 0.368538 ( -0.063277  0.063514 ) ph/cm2/s
Energy fluence (15-150 keV)             : 3.05232e-07 ( -5.63921e-08  5.69359e-08 ) ergs/cm2
Cutoff power-law model
Time interval is from   -3.696 sec. to    6.304 sec.
Spectral model in the cutoff power-law:
------------------------------------------------------------
Parameters  : value       lower 90%   higher 90%
Photon index: -2.88115     ( -0.209231   1.05416 )
Epeak [keV] : 260.144      (   )
Norm@50keV  : 4.97642E-04    (     )
------------------------------------------------------------
#Fit statistic : Chi-Squared =          55.98 using 59 PHA bins.
# Reduced chi-squared =         0.9997 for     56 degrees of freedom
# Null hypothesis probability =   4.755420e-01

Photon flux (15-150 keV)    in 10 sec: 0.368571 ( -0.063456  0.063399 ) ph/cm2/s
Energy fluence (15-150 keV)             : 3.02093e-07 ( 0  0 ) ergs/cm2
1-s peak spectrum fit
Power-law model

Time interval is from    1.304 sec. to    2.304 sec.

Spectral model in power-law:
------------------------------------------------------------
Parameters  : value       lower 90%   higher 90%
Photon index: -1.07143     ( -0.612438   0.671486 )
Norm@50keV  : 4.98828E-03    ( -0.00168986   0.00164984 )
------------------------------------------------------------
#Fit statistic : Chi-Squared =          60.24 using 59 PHA bins.
# Reduced chi-squared =          1.057 for     57 degrees of freedom
# Null hypothesis probability =   3.592473e-01

Photon flux (15-150 keV)    in 1 sec: 0.577111 ( -0.197823  0.200399 ) ph/cm2/s
Energy fluence (15-150 keV)             : 5.26441e-08 ( -1.8406e-08  1.86839e-08 ) ergs/cm2
Cutoff power-law model
Time interval is from    1.304 sec. to    2.304 sec.
Spectral model in the cutoff power-law:
------------------------------------------------------------
Parameters  : value       lower 90%   higher 90%
Photon index: -1.06606     ( 0.848889   4.46588 )
Epeak [keV] : 9995.80      ( -9996.83 -9996.83 )
Norm@50keV  : 5.01600E-03    ( -0.00164689   0.292122 )
------------------------------------------------------------
#Fit statistic : Chi-Squared =          60.24 using 59 PHA bins.
# Reduced chi-squared =          1.076 for     56 degrees of freedom
# Null hypothesis probability =   3.248966e-01

Photon flux (15-150 keV)    in 1 sec: 0.579311 ( -0.213809  0.200403 ) ph/cm2/s
Energy fluence (15-150 keV)             : 5.28141e-08 ( -2.04137e-08  1.68437e-08 ) ergs/cm2
Time-resolved spectra
Distribution
T90 vs. Hardness ratio plot
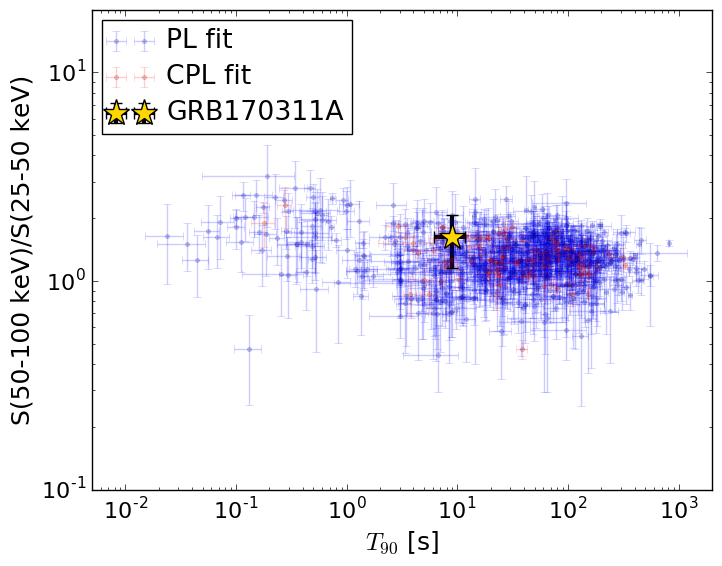
T90                                   = 9.0 sec.
Hardness ratio (energy fluence ratio) = 1.62401526427
S(15-50 keV) vs. S(50-150 keV) plot
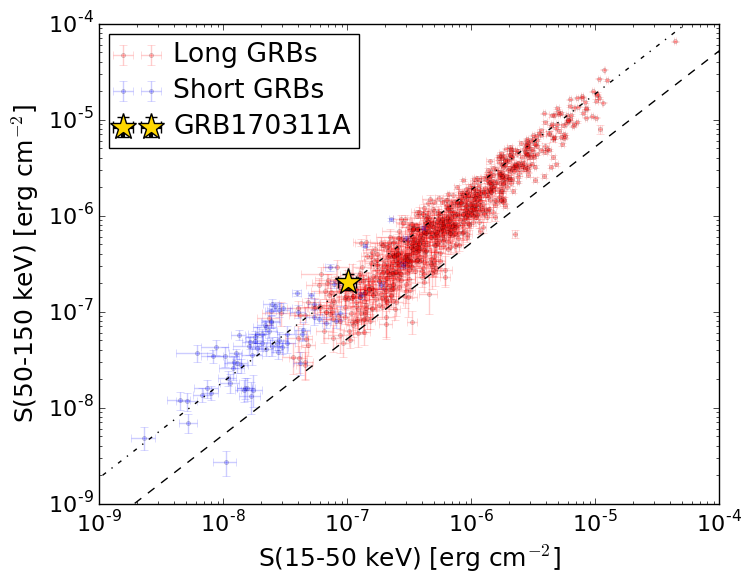
S(15-50 keV)  = 1.006783e-07
S(50-150 keV) = 2.0455073e-07
The dash-dotted line and the dashed line traces the fluences calculated from the Band function with Epeak = 15 and 150 keV, respectively. Both lines assume a canonical values of alpha = -1 and beta = -2.5.
Mask shadow pattern
IMX = 3.740470756710060E-01, IMY = -3.413637314041561E-01
Spacecraft aspect plot
Bright source in the pre-burst/pre-slew/post-slew images
Pre-burst image of 15-350 keV band
Time interval of the image:
-364.195410 -346.257400
-239.696000 -3.696000

# RAcent  DECcent POSerr Theta    Phi  PeakCts   SNR AngSep     Name
#  [deg]    [deg]    ['] [deg]  [deg]                   [']
263.0164 -24.8014    3.2  38.6   64.0   2.5032   3.6    3.4	GX 1+4
264.7339 -44.4432    9.1  45.6   36.4   0.9076   1.3    0.6	4U 1735-44
268.3707  -1.4803  812.1  34.0  104.3   0.0082   0.0    1.7	SW J1753.5-0127
270.3493 -25.0388    6.5  32.3   60.3   0.8116   1.8    4.3	GX 5-1
270.3380 -25.6139   34.1  32.5   59.3   0.1539   0.3    8.0	GRS 1758-258
274.0174 -14.0123    4.4  26.6   81.0   0.9760   2.6    1.6	GX 17+2
275.8760 -30.4775    3.7  30.3   46.7   1.1077   3.2    7.1	H1820-303
285.1866 -25.0834    0.0  20.5   45.3   0.2022   0.8   12.8	HT1900.1-2455
288.8225  10.9470    1.4  25.3  150.6   2.3318   8.1    1.4	GRS 1915+105
299.5811  35.1945    0.8  46.4  178.2   8.4028  14.5    0.6	Cyg X-1
307.9857  41.0008   19.2  52.6 -173.5  -0.4814  -0.6    6.3	Cyg X-3
326.1559  38.2015    8.7  54.7 -156.0   1.7243   1.3    7.2	Cyg X-2
263.0459 -33.8099    7.3  41.5   50.7   1.1674   1.6    3.2	GX 354-0
267.2983  22.0302    2.4  47.0  135.0   5.6801   4.8 ------	UNKNOWN
258.4530 -43.0451    2.3  48.7   41.2   5.3510   5.2 ------	UNKNOWN
328.4911 -57.6657    2.7  50.9  -18.5   2.5327   4.3 ------	UNKNOWN
347.5778 -41.6092    4.2  50.6  -44.5   4.4726   2.7 ------	UNKNOWN
339.7445  13.0362    3.0  45.3 -121.3   4.8149   3.8 ------	UNKNOWN
Pre-slew background subtracted image of 15-350 keV band
Time interval of the image:
-3.696000 6.304000

# RAcent  DECcent POSerr Theta    Phi  PeakCts   SNR AngSep     Name
#  [deg]    [deg]    ['] [deg]  [deg]                   [']
262.9346 -24.6212    7.3  38.6   64.3   0.1808   1.6    8.5	GX 1+4
264.8100 -44.6278    7.2  45.7   36.1   0.1849   1.6   11.0	4U 1735-44
268.4187  -1.4637   10.6  33.9  104.3   0.0809   1.1    3.1	SW J1753.5-0127
270.1240 -25.0764   12.8  32.5   60.4  -0.0607  -0.9    8.7	GX 5-1
270.1489 -25.6802   52.4  32.6   59.3  -0.0146  -0.2    9.1	GRS 1758-258
274.1567 -14.0801   10.9  26.5   80.9   0.0598   1.1    9.2	GX 17+2
275.9045 -30.3656  279.3  30.3   46.9   0.0022   0.0    1.1	H1820-303
284.9934 -24.9033    5.3  20.5   46.0  -0.0880  -2.2    2.5	HT1900.1-2455
288.9029  11.0966    6.0  25.4  151.0  -0.0842  -1.9   11.0	GRS 1915+105
299.7183  35.3532    0.0  46.6  178.4  -0.1079  -1.3   11.0	Cyg X-1
308.0895  40.9183    4.7  52.5 -173.4   0.2830   2.4    2.3	Cyg X-3
326.1141  38.1874    6.1  54.6 -156.0  -0.3100  -1.9    8.5	Cyg X-2
262.8543 -33.6452    0.0  41.5   51.1   0.2203   2.0   13.2	GX 354-0
270.4292  24.7343    2.1  46.8  140.4   0.8264   5.5 ------	UNKNOWN
280.5410 -30.0381    1.0  26.9   42.4   0.5205  11.4 ------	UNKNOWN
Post-slew image of 15-350 keV band
Time interval of the image:
88.804590 962.370500

# RAcent  DECcent POSerr Theta    Phi  PeakCts   SNR AngSep     Name
#  [deg]    [deg]    ['] [deg]  [deg]                   [']
244.9801 -15.6468    0.8  35.7  112.5  27.1832  14.0    0.4	Sco X-1
255.9905 -37.8508    0.6  21.8   69.2  20.9187  20.8    0.4	4U 1700-377
256.4200 -36.3684    3.4  21.1   73.0   3.5300   3.4    3.4	GX 349+2
262.9739 -24.7008    1.8  16.5  111.4   5.0868   6.4    3.3	GX 1+4
264.6708 -44.5924    6.3  19.2   43.2   1.6075   1.8    9.1	4U 1735-44
268.2372  -1.4674    7.9  30.9  162.1   1.6545   1.5    7.9	SW J1753.5-0127
270.3000 -25.0088    4.4  10.4  123.3   2.2835   2.6    4.3	GX 5-1
270.3102 -25.7512    5.8  10.1  119.7   1.7691   2.0    0.6	GRS 1758-258
274.0692 -13.9096    3.1  17.2  164.9   3.0272   3.7    8.5	GX 17+2
275.7484 -30.3408    5.6   4.2   91.8   1.6030   2.1    9.3	H1820-303
285.2148 -24.9883    9.5   6.5 -133.4  -1.0025  -1.2   10.5	HT1900.1-2455
288.8270  10.9437    2.3  41.8 -161.1   8.0206   5.1    1.7	GRS 1915+105
262.9772 -33.8470    5.4  15.4   78.0   1.8458   2.2    0.9	GX 354-0
222.3124 -59.7431    3.3  48.5   41.6  11.6865   3.5 ------	UNKNOWN
259.8942 -25.0215    0.4  19.0  107.1  20.7942  26.1 ------	UNKNOWN
287.7513 -58.8460    3.1  29.2   -0.9   3.4804   3.8 ------	UNKNOWN
298.9399 -21.2176    3.5  18.7 -107.2   3.4346   3.4 ------	UNKNOWN
294.0525  23.2156    3.1  54.8 -158.1  15.4903   3.7 ------	UNKNOWN
343.7081 -47.3913    4.9  50.7  -44.6  17.0941   2.3 ------	UNKNOWN
314.6843   1.5319    2.3  45.3 -121.3  26.6629   5.1 ------	UNKNOWN