Analysis Summary
Notes:
- 1) No attempt has been made to eliminate the non-significant decimal places.
- 2) This batgrbproduct analysis is done using the HEASARC data.
- 3) This batgrbproduct analysis is using the flight position for the mask-weighting calculation.
======================================================================
                  BAT GRB EVENT DATA PROCESSING REPORT
    Process Script Ver: batgrbproduct v2.46
    Process Start Time: Thu Apr 13 16:33:48 EDT 2017
             Host Name: bat1
   Current Working Dir: /local/data/bat1/alien/Swift_3rdBATcatalog/event/batevent_reproc/trigger743086
======================================================================

  Trigger: 00743086      Segment: 000

  BAT Trigger Time: 511543691.328   [s; MET]
      Trigger Stop: 511543691.84   [s; MET]
               UTC: 2017-03-18T15:27:52.554820    [includes UTCF correction]
       Where From?: TDRSS position message

  BAT
    RA: 284.279322271095   Dec: 6.26950020290672  [deg; J2000]

     Catalogged Source?: NO
     Point Source?:      YES
     GRB Indicated?:     YES    [ by BAT flight software ]
     Image S/N Ratio:    7.21
     Image Trigger?:     NO
     Rate S/N Ratio:     14.9331845230681  [ if not an image trigger ]
     Image S/N Ratio:    7.21

  Analysis Position:   [ source = BAT ]
    RA: 284.279322271095   Dec: 6.26950020290672  [deg; J2000]

  Refined Position:   [ source = BAT pre-slew burst ]
    RA: 284.292349987551   Dec: 6.31685800630574  [deg; J2000]
        { 18h 57m 10.2s , +06d 19' 00.7" }
         +/- 2.21816638960067 [arcmin] (estimated 90% radius based on SNR)
         +/- 1.03037939340942 [arcmin] (formal 1-sigma fit error)
    SNR: 9.74632894653276

  Angular difference between the analysis and refined position is 2.945776 arcmin

  Partial Coding Fraction: 0.6796875    [ including projection effects ]

  Duration
     T90: 1.07199990749359 +/- 0.221846764251316
        Measured from: -0.46399998664856
                   to: 0.607999920845032     [s; relative to TRIGTIME]
     T50: 0.555999934673309 +/- 0.297617258995808
        Measured from: -0.100000023841858
                   to: 0.455999910831451     [s; relative to TRIGTIME]


  Fluence
     Peak Flux  (peak 1 second)
        Measured from: -0.364000022411346
                   to: 0.635999977588654     [s; relative to TRIGTIME]
     Total Fluence
        Measured from: -0.5
                   to: 0.643999993801117     [s; relative to TRIGTIME]

             Band 1     Band 2     Band 3     Band 4
              15-25      25-50     50-100    100-350     keV
 Total     0.031774   0.047054   0.069911   0.019985
           0.009041   0.009812   0.009560   0.008166 [error]
 Peak      0.030110   0.045104   0.057211   0.015219
           0.008480   0.009271   0.009042   0.007743 [error]

     [ fluence units of on-axis counts / fully illuminated detector ]

======================================================================


====== Table of the duration information =============================

        Value   tstart    tstop
T100    1.144   -0.500    0.644
T90     1.072   -0.464    0.608
T50     0.556   -0.100    0.456
Peak    1.000   -0.364    0.636


====== Spectral Analysis Summary =====================================

Model      : spectral model: simple power-law (PL) and cutoff power-law (CPL)
Ph_index   : photon index: E^{Ph_index}
Ph_90err   : 90% error of the photon index
Epeak      : Epeak in keV
Epeak_90err: 90% error of Epeak
Norm       : normalization at 50 keV in both the PL model and CPL model
Nomr_90err : 90% error of the normalization
chi2       : Chi-Squared
dof        : degree of freedo

=== Time-averaged spectral analysis ===
(Best model with acceptable fit: PL)

Model Ph_index Ph_90err_low Ph_90err_hi  Epeak  Epeak_90err_low  Epeak_90err_hi  Norm       Nomr_90err_low    Norm_90err_hi    chi2    dof
PL      -0.773    -0.322      0.349       -           -               -         9.83e-03     -1.88e-03          1.81e-03      51.150   57
CPL     -0.773    -0.315      0.362     9999.330    -9999.330      -9999.330      9.91e-03     -1.76e-03          1.78e-02      51.160   56


=== 1-s peak spectral analysis ===
(Best model with acceptable fit: PL)

Model Ph_index Ph_90err_low Ph_90err_hi  Epeak  Epeak_90err_low  Epeak_90err_hi  Norm       Nomr_90err_low    Norm_90err_hi    chi2    dof
PL      -0.878     -0.345     0.373       -           -               -         9.90e-03     -1.96e-03          1.91e-03      48.950   57
CPL     -0.802      N/A       N/A         989.203      N/A           N/A         1.06e-02        N/A               N/A         49.030   56


=== Fluence/Peak Flux Summary ===

              Model    Band1     Band2     Band3     Band4     Band5     Total
                       15-25     25-50    50-100    100-350    15-150    15-350    keV
Fluence         PL   7.30e-09  2.10e-08  4.92e-08  3.14e-07  1.33e-07  3.91e-07   erg/cm2
      90%_error_low -2.80e-09 -5.26e-09 -8.64e-09 -1.17e-07 -2.36e-08 -1.21e-07   erg/cm2
      90%_error_hi   3.31e-09  5.10e-09  8.53e-09  1.64e-07  2.36e-08  1.63e-07   erg/cm2
Peak flux       PL   2.25e-01  3.29e-01  3.58e-01  7.29e-01  1.14e+00  1.64e+00   ph/cm2/s
      90%_error_low -9.00e-02 -8.72e-02 -7.01e-02 -2.80e-01 -2.21e-01 -3.33e-01   ph/cm2/s
      90%_error_hi   1.06e-01  8.41e-02  6.90e-02  3.84e-01  2.22e-01  3.64e-01   ph/cm2/s

Fluence        CPL   1.65e-09  2.51e-09  2.56e-09  5.33e-09  1.03e-08  1.77e-08   erg/cm2
      90%_error_low    N/A       N/A       N/A       N/A       N/A       N/A      erg/cm2
      90%_error_hi     N/A       N/A       N/A       N/A       N/A       N/A      erg/cm2
Peak flux      CPL   2.33e-01  3.31e-01  3.57e-01  7.85e-01  1.14e+00  1.64e+00   ph/cm2/s
      90%_error_low -1.18e-01 -8.90e-02 -6.86e-02     N/A   -2.58e-01 -5.13e-01   ph/cm2/s
      90%_error_hi   9.81e-02  8.29e-02  8.32e-02     N/A    2.40e-01  3.31e-01   ph/cm2/s

======================================================================
Image
Pre-slew 15.0-350.0 keV image (Event data)
#   RAcent    DECcent   POSerr    Theta     Phi              Peak Cts       SNR   Name
  284.2923     6.3169   0.0198    29.9372    25.9351         0.1699870      9.746 TRIG_00743086

Foreground time interval of the image:
 -0.500   0.644 (delta_t =   1.144 [sec])
Background time interval of the image:
-239.328  -0.500 (delta_t = 238.828 [sec])
Light Curves
Note: The mask-weighted lightcurves have units of either count/det or counts/sec/det, where a det is 0.4 x 0.4 = 0.16 sq cm.
Full-time range; 1 s binning
Other quick-look light curves:
- 64 ms binning (zoomed)
- 16 ms binning (zoomed)
- 8 ms binning (zoomed)
- 2 ms binning (zoomed)
- SN=5 or 10 s binning (full-time range)
- Raw light curve
Spectra
- 64 ms binning (zoomed)
- 16 ms binning (zoomed)
- 8 ms binning (zoomed)
- 2 ms binning (zoomed)
- SN=5 or 10 s binning (full-time range)
- Raw light curve
Spectra
Notes:
- 1) The fitting includes the systematic errors.
- 2) When the burst includes telescope slew time periods, the fitting uses an average response file made from multiple 5-s response files through out the slew time plus single time preiod for the non-slew times, and weighted by the total counts in the corresponding time period using addrmf. An average response file is needed becuase a spectral fit using the pre-slew DRM will introduce some errors in both a spectral shape and a normalization if the PHA file contains a lot of the slew/post-slew time interval.
- 3) For fits to more complicated models (e.g. a power-law over a cutoff power-law), the BAT team has decided to require a chi-square improvement of more than 6 for each extra dof.
Time averaged spectrum fit using the average DRM
Power-law model

Time interval is from   -0.500 sec. to    0.644 sec.

Spectral model in power-law:
------------------------------------------------------------
Parameters  : value       lower 90%   higher 90%
Photon index: -0.772853     ( -0.321574   0.349206 )
Norm@50keV  : 9.82661E-03    ( -0.00188396   0.0018102 )
------------------------------------------------------------
#Fit statistic : Chi-Squared =          51.15 using 59 PHA bins.
# Reduced chi-squared =         0.8974 for     57 degrees of freedom
# Null hypothesis probability =   6.931728e-01

Photon flux (15-150 keV)    in 1.144 sec: 1.13064 ( -0.203431  0.20488 ) ph/cm2/s
Energy fluence (15-150 keV)             : 1.32906e-07 ( -2.35722e-08  2.36266e-08 ) ergs/cm2
Cutoff power-law model
Time interval is from   -0.500 sec. to    0.644 sec.
Spectral model in the cutoff power-law:
------------------------------------------------------------
Parameters  : value       lower 90%   higher 90%
Photon index: -0.773466     ( -0.31731   0.359579 )
Epeak [keV] : 9999.33      ( -9999.36 -9999.36 )
Norm@50keV  : 9.90778E-03    ( -0.00174531   0.0177629 )
------------------------------------------------------------
#Fit statistic : Chi-Squared =          51.16 using 59 PHA bins.
# Reduced chi-squared =         0.9135 for     56 degrees of freedom
# Null hypothesis probability =   6.583249e-01

Photon flux (15-150 keV)    in 1.144 sec: 1.13282 ( -0.2082  0.20058 ) ph/cm2/s
Energy fluence (15-150 keV)             : 1.03294e-08 ( 0  0 ) ergs/cm2
1-s peak spectrum fit
Power-law model
Time interval is from   -0.364 sec. to    0.636 sec.

Spectral model in power-law:
------------------------------------------------------------
Parameters  : value       lower 90%   higher 90%
Photon index: -0.878173     ( -0.345318   0.372809 )
Norm@50keV  : 9.90319E-03    ( -0.00196394   0.00191268 )
------------------------------------------------------------
#Fit statistic : Chi-Squared =          48.95 using 59 PHA bins.
# Reduced chi-squared =         0.8587 for     57 degrees of freedom
# Null hypothesis probability =   7.672239e-01

Photon flux (15-150 keV)    in 1 sec: 1.13656 ( -0.220728  0.22183 ) ph/cm2/s
Energy fluence (15-150 keV)             : 1.12106e-07 ( -2.22473e-08  2.23468e-08 ) ergs/cm2
Cutoff power-law model
Time interval is from   -0.364 sec. to    0.636 sec.
Spectral model in the cutoff power-law:
------------------------------------------------------------
Parameters  : value       lower 90%   higher 90%
Photon index: -0.802397     (       )
Epeak [keV] : 989.203      (   )
Norm@50keV  : 1.06322E-02    (     )
------------------------------------------------------------
#Fit statistic : Chi-Squared =          49.03 using 59 PHA bins.
# Reduced chi-squared =         0.8756 for     56 degrees of freedom
# Null hypothesis probability =   7.336663e-01

Photon flux (15-150 keV)    in 1 sec: 1.14439 ( -0.257828  0.2395 ) ph/cm2/s
Energy fluence (15-150 keV)             : 1.12336e-07 ( -2.49363e-08  2.45913e-08 ) ergs/cm2
Time-resolved spectra
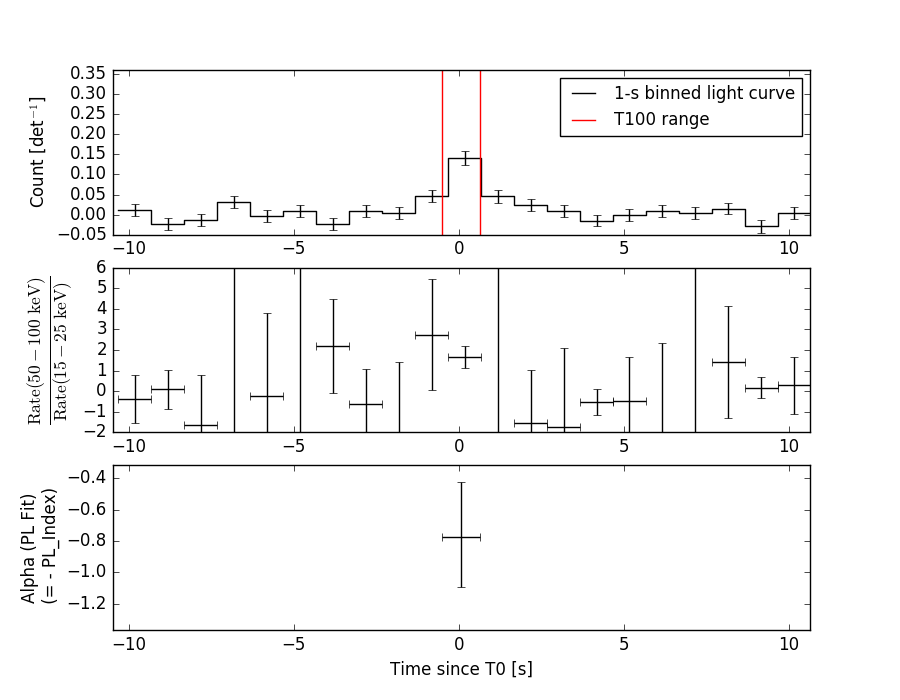
Distribution
T90 vs. Hardness ratio plot
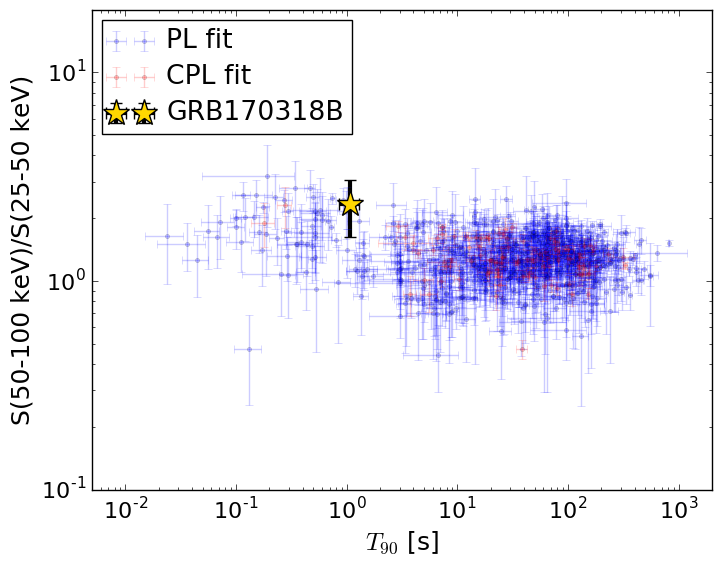
T90                                   = 1.072 sec.
Hardness ratio (energy fluence ratio) = 2.34110038152
S(15-50 keV) vs. S(50-150 keV) plot
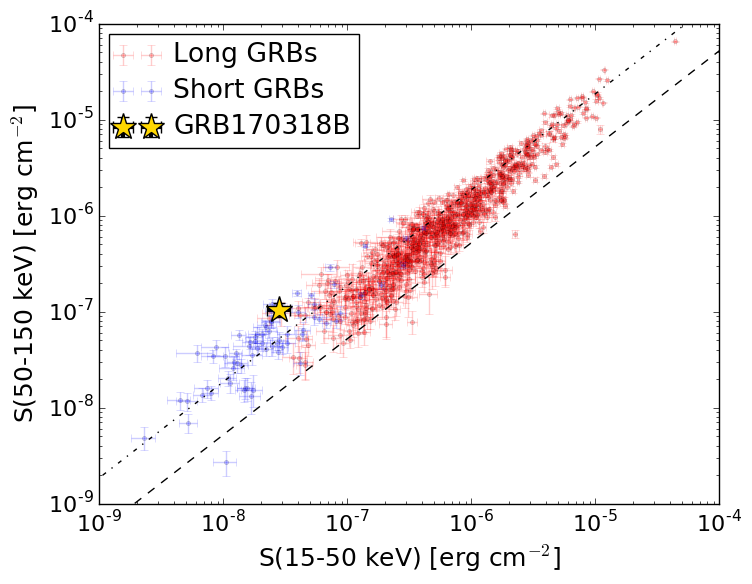
S(15-50 keV)  = 2.8318259e-08
S(50-150 keV) = 1.045873e-07
The dash-dotted line and the dashed line traces the fluences calculated from the Band function with Epeak = 15 and 150 keV, respectively. Both lines assume a canonical values of alpha = -1 and beta = -2.5.
Mask shadow pattern

IMX = 5.178916333020426E-01, IMY = -2.518671730167600E-01
Spacecraft aspect plot
Bright source in the pre-burst/pre-slew/post-slew images
Pre-burst image of 15-350 keV band
Time interval of the image:
-239.328000 -0.500000

# RAcent  DECcent POSerr Theta    Phi  PeakCts   SNR AngSep     Name
#  [deg]    [deg]    ['] [deg]  [deg]                   [']
268.2842  -1.3754    4.9  46.6   36.1   1.8653   2.4    6.8	SW J1753.5-0127
273.9583 -13.9921    4.2  52.3   19.6   2.6440   2.7    3.8	GX 17+2
284.9856 -24.7979    5.3  56.8    2.0  -2.8634  -2.2    7.9	HT1900.1-2455
288.8017  10.9015    1.3  23.6   24.8   2.1573   8.9    2.6	GRS 1915+105
299.5642  35.2070    0.4   8.5  123.8   6.3921  26.2    1.3	Cyg X-1
308.0048  41.1453    0.0  12.9  167.5   0.5488   2.4   12.5	Cyg X-3
326.0513  38.3880    5.2  19.7 -146.2   0.5192   2.2    6.9	Cyg X-2
278.8041 -16.2873    2.2  51.7   13.0   4.0443   5.3 ------	UNKNOWN
294.2095  -5.2822    2.2  35.5   -0.6   1.6114   5.3 ------	UNKNOWN
325.1451 -18.5324    3.5  50.6  -44.7   4.2051   3.3 ------	UNKNOWN
Pre-slew background subtracted image of 15-350 keV band
Time interval of the image:
-0.500000 0.644000

# RAcent  DECcent POSerr Theta    Phi  PeakCts   SNR AngSep     Name
#  [deg]    [deg]    ['] [deg]  [deg]                   [']
268.3690  -1.4524   19.0  46.6   36.0  -0.0278  -0.6    0.1	SW J1753.5-0127
273.9108 -13.9525  249.5  52.3   19.6  -0.0031  -0.0    7.5	GX 17+2
284.9594 -24.9132   10.9  56.9    2.0   0.0944   1.0    4.2	HT1900.1-2455
288.8055  11.0977   11.0  23.4   25.1   0.0163   1.0    9.1	GRS 1915+105
299.7081  35.0235  636.5   8.3  123.7  -0.0003  -0.0   12.2	Cyg X-1
308.3658  41.0370    0.0  12.8  168.8   0.0150   1.0   12.6	Cyg X-3
325.9330  38.2688   40.4  19.5 -146.0  -0.0039  -0.3   11.7	Cyg X-2
284.2923   6.3168    1.2  29.9   25.9   0.1699   9.7 ------	UNKNOWN
304.4703  16.7388    2.8  11.7  -15.0   0.0535   4.2 ------	UNKNOWN
293.7264 -28.9071    2.4  58.4   -8.3   0.4338   4.9 ------	UNKNOWN
Post-slew image of 15-350 keV band
Time interval of the image:
62.572600 962.744600

# RAcent  DECcent POSerr Theta    Phi  PeakCts   SNR AngSep     Name
#  [deg]    [deg]    ['] [deg]  [deg]                   [']
254.5485  35.3431    4.7  39.9  138.6   3.2982   2.4    4.4	Her X-1
256.1273 -38.0342    0.0  51.5   26.1   1.7209   0.7   13.2	4U 1700-377
256.4914 -36.3739   72.8  50.0   27.1  -0.3419  -0.2    4.0	GX 349+2
262.9816 -24.6664    5.4  37.2   30.8   1.8143   2.1    5.0	GX 1+4
264.8750 -44.4089   15.1  53.6   14.8   1.7463   0.8    6.2	4U 1735-44
268.2208  -1.3050    8.5  17.7   63.0  -0.7991  -1.3   12.5	SW J1753.5-0127
270.3550 -24.9649   24.1  34.0   20.6  -0.3426  -0.5    7.9	GX 5-1
270.3196 -25.7280    3.5  34.7   20.1   2.4280   3.3    1.3	GRS 1758-258
273.9256 -13.9737    4.3  22.7   24.6   1.5349   2.7    6.0	GX 17+2
275.8769 -30.2124    6.0  37.3    9.7   1.4621   1.9    9.6	H1820-303
285.1693 -25.0740    0.0  31.3   -3.8  -0.5060  -0.8   11.7	HT1900.1-2455
288.7862  10.9145    0.9   6.4 -139.1   5.8512  12.3    2.0	GRS 1915+105
299.5869  35.1942    0.5  32.2 -158.5  15.8535  24.8    0.5	Cyg X-1
308.1639  41.0909    7.5  40.8 -154.5  -1.4732  -1.5    8.6	Cyg X-3
326.2073  38.3708   17.3  49.6 -138.9   1.7582   0.7    3.4	Cyg X-2
262.8552 -33.9554   12.1  45.0   23.0  -1.1084  -1.0    9.8	GX 354-0
251.5019 -25.0290    2.5  44.7   41.9   7.3514   4.6 ------	UNKNOWN
259.8983 -25.0263    0.8  39.3   33.9  14.1991  14.3 ------	UNKNOWN
282.3701  55.1292    3.1  48.9  176.2   5.0347   3.7 ------	UNKNOWN
306.2214  57.2935    4.0  53.9 -167.9   5.7814   2.9 ------	UNKNOWN
324.2290  10.3690    4.3  39.7 -101.0   6.7780   2.7 ------	UNKNOWN
	UNKNOWN
	UNKNOWN