Analysis Summary
Notes:
- 1) No attempt has been made to eliminate the non-significant decimal places.
- 2) This batgrbproduct analysis is done using the HEASARC data.
- 3) This batgrbproduct analysis is using the flight position for the mask-weighting calculation.
==========================================================================
BAT GROUND-DETECTED GRB DATA PROCESSING REPORT
(This burst occurred during telescope slew)
Process Script Ver: batgrbproduct v2.46
Process Start Time: Sat Mar 25 22:36:25 EDT 2017
Host Name: bat1
Current Working Dir: /local/data/bat1/alien/Swift_3rdBATcatalog/event/batevent_reproc/GRB170325A
======================================================================
Trigger: 00034941 Segment: 009
BAT Trigger Time: 512121436.76
UTC: 2017-03-25T07:56:57.95 [includes UTCF correction]
Where From?: Ground analysis (best_duration.txt)
NOTE: BAT trigger time for ground-detected burst during slew is the T100 start time.
Analysis Position: [ source = GCN ]
RA: 127.4712 Dec: +20.5233 [deg; J2000]
Refined Position: [ source = BAT mosaic image ]
RA: 127.482961976349 Dec: 20.5256868633471 [deg; J2000]
{ 08h 29m 55.9s , +20d 31' 32.5" }
+/- 1.99315840303 [arcmin] (estimated 90% radius based on SNR)
SNR: 11.3568612315
Angular difference between the analysis and refined position is 0.676259 arcmin
Partial Coding Fraction: Unavailable because the burst occurred during slew.
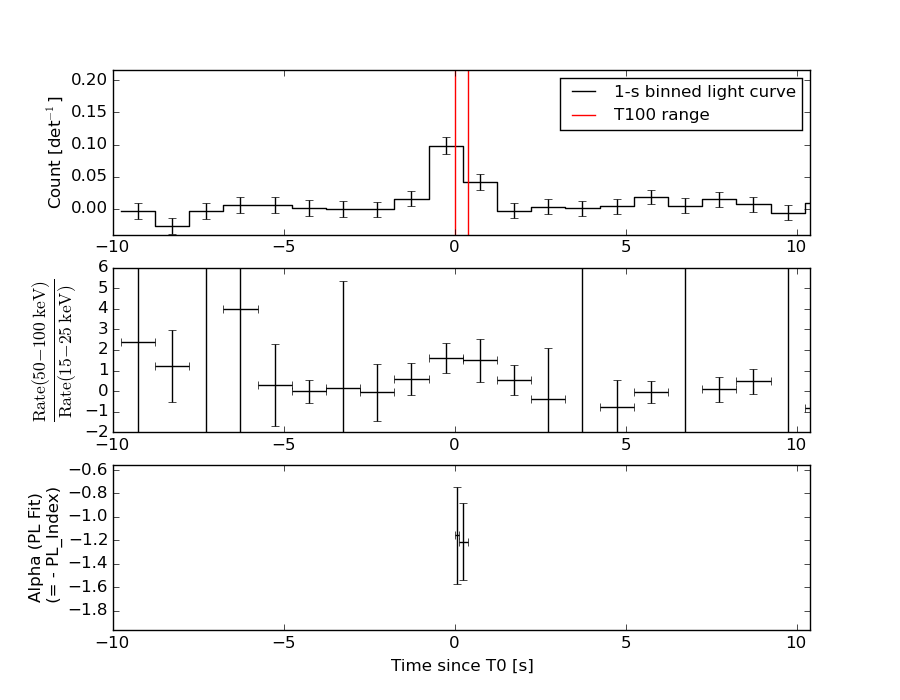
Duration
T90: 0.331999897956848 +/- 0.0708801526815671
Measured from: 0.016
to: 0.348 [s; relative to TRIGTIME]
T50: 0.187999904155731 +/- 0.0432666203311027
Measured from: 0.048
to: 0.236 [s; relative to TRIGTIME]
====== Table of the duration information =============================
Value tstart tstop
T100 0.392 0.000 0.392
T90 0.332 0.016 0.348
T50 0.188 0.048 0.236
Peak 1.000 -0.302 0.698
====== Spectral Analysis Summary =====================================
Model : spectral model: simple power-law (PL) and cutoff power-law (CPL)
Ph_index : photon index: E^{Ph_index}
Ph_90err : 90% error of the photon index
Epeak : Epeak in keV
Epeak_90err: 90% error of Epeak
Norm : normalization at 50 keV in both the PL model and CPL model
Nomr_90err : 90% error of the normalization
chi2 : Chi-Squared
dof : degree of freedo
=== Time-averaged spectral analysis ===
(Best model with acceptable fit: PL)
Model Ph_index Ph_90err_low Ph_90err_hi Epeak Epeak_90err_low Epeak_90err_hi Norm Nomr_90err_low Norm_90err_hi chi2 dof
PL -1.056 -0.254 0.259 - - - 2.06e-02 -2.75e-03 2.75e-03 51.590 57
CPL -1.066 -0.241 0.293 9999.360 -9999.360 -9999.360 2.08e-02 -2.08e-02 -1.79e-02 51.630 56
=== 1-s peak spectral analysis ===
(Best model with acceptable fit: N/A)
Model Ph_index Ph_90err_low Ph_90err_hi Epeak Epeak_90err_low Epeak_90err_hi Norm Nomr_90err_low Norm_90err_hi chi2 dof
PL -1.072 -0.295 0.304 - - - 9.46e-03 -1.50e-03 1.50e-03 50.540 57
CPL -1.015 -1.049 -0.956 997.175 N/A N/A 1.00e-02 N/A N/A 50.630 56
=== Fluence/Peak Flux Summary ===
Model Band1 Band2 Band3 Band4 Band5 Total
15-25 25-50 50-100 100-350 15-150 15-350 keV
Fluence PL 6.83e-09 1.65e-08 3.17e-08 1.49e-07 8.58e-08 2.04e-07 erg/cm2
90%_error_low -1.83e-09 -2.70e-09 -5.08e-09 -4.95e-08 -1.30e-08 -5.29e-08 erg/cm2
90%_error_hi 2.00e-09 2.61e-09 4.95e-09 6.47e-08 1.30e-08 6.62e-08 erg/cm2
Peak flux PL 2.59e-01 3.36e-01 3.20e-01 5.39e-01 1.09e+00 1.45e+00 ph/cm2/s
90%_error_low -8.22e-02 -6.82e-02 -5.75e-02 -1.89e-01 -1.78e-01 -2.46e-01 ph/cm2/s
90%_error_hi 9.24e-02 6.59e-02 5.61e-02 2.47e-01 1.79e-01 2.58e-01 ph/cm2/s
Fluence CPL 6.84e-09 1.65e-08 3.17e-08 1.52e-07 8.57e-08 2.03e-07 erg/cm2
90%_error_low -1.85e-09 -2.71e-09 -5.07e-09 -8.05e-08 -1.29e-08 -6.94e-08 erg/cm2
90%_error_hi 1.98e-09 2.59e-09 4.98e-09 6.82e-08 1.31e-08 5.39e-08 erg/cm2
Peak flux CPL 2.65e-01 3.37e-01 3.18e-01 5.83e-01 1.10e+00 1.45e+00 ph/cm2/s
90%_error_low N/A -6.90e-02 -5.62e-02 N/A N/A -3.71e-01 ph/cm2/s
90%_error_hi N/A 6.57e-02 6.46e-02 N/A N/A 2.32e-01 ph/cm2/s
======================================================================
Image
Note1: The mosaic image is made with timebin = 0.05 s; energybin = 15-350 keV
Note2: The mosaic image uses Galactic coordinate.
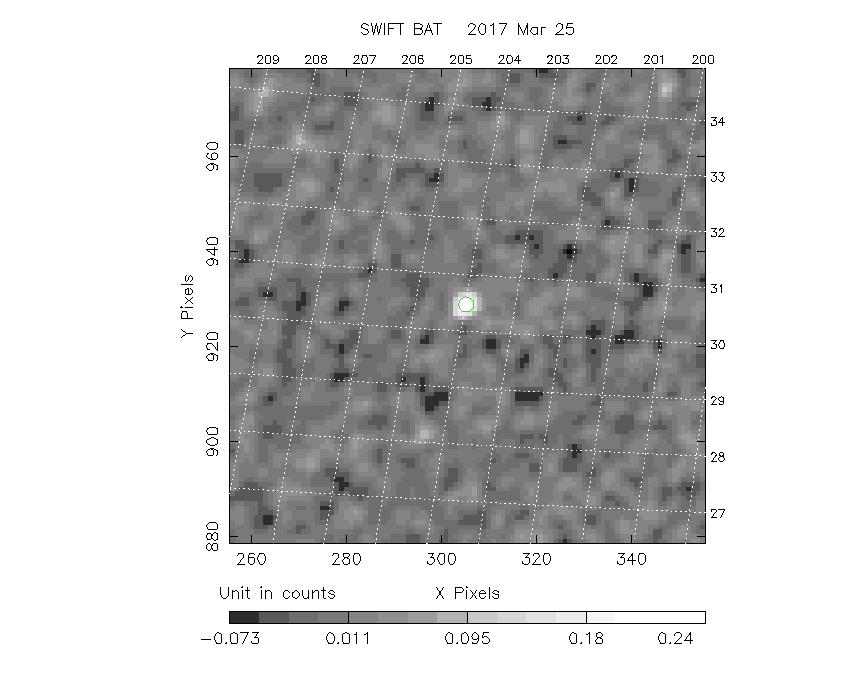
#RAcent DECcent POSerr Theta  Phi  Peak_Cts  SNR Name
127.483 20.526 0.006 33.103 -55.370 0.270 11.357 UNKNOWN

Image time interval: 0.000 to 0.392 [sec]
Light Curves
Note: The mask-weighted lightcurves have units of either count/det or counts/sec/det, where a det is 0.4 x 0.4 = 0.16 sq cm.
Best duration plot
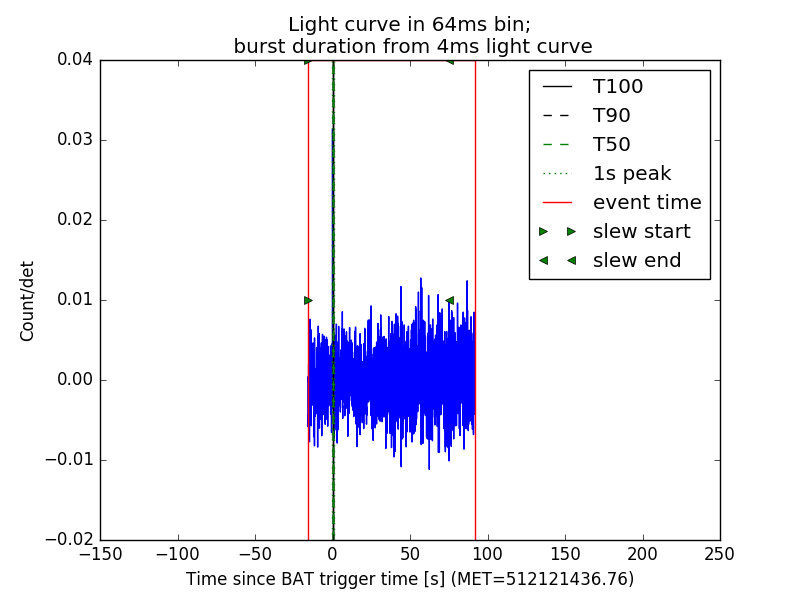
Full-time range; 1 s binning
Other quick-look light curves:
- 64 ms binning (zoomed)
- 16 ms binning (zoomed)
- 8 ms binning (zoomed)
- 2 ms binning (zoomed)
- SN=5 or 10 s binning (full-time range)
- Raw light curve
Spectra
- 64 ms binning (zoomed)
- 16 ms binning (zoomed)
- 8 ms binning (zoomed)
- 2 ms binning (zoomed)
- SN=5 or 10 s binning (full-time range)
- Raw light curve
Spectra
Notes:
- 1) The fitting includes the systematic errors.
- 2) When the burst includes telescope slew time periods, the fitting uses an average response file made from multiple 5-s response files through out the slew time plus single time preiod for the non-slew times, and weighted by the total counts in the corresponding time period using addrmf. An average response file is needed becuase a spectral fit using the pre-slew DRM will introduce some errors in both a spectral shape and a normalization if the PHA file contains a lot of the slew/post-slew time interval.
- 3) For fits to more complicated models (e.g. a power-law over a cutoff power-law), the BAT team has decided to require a chi-square improvement of more than 6 for each extra dof.
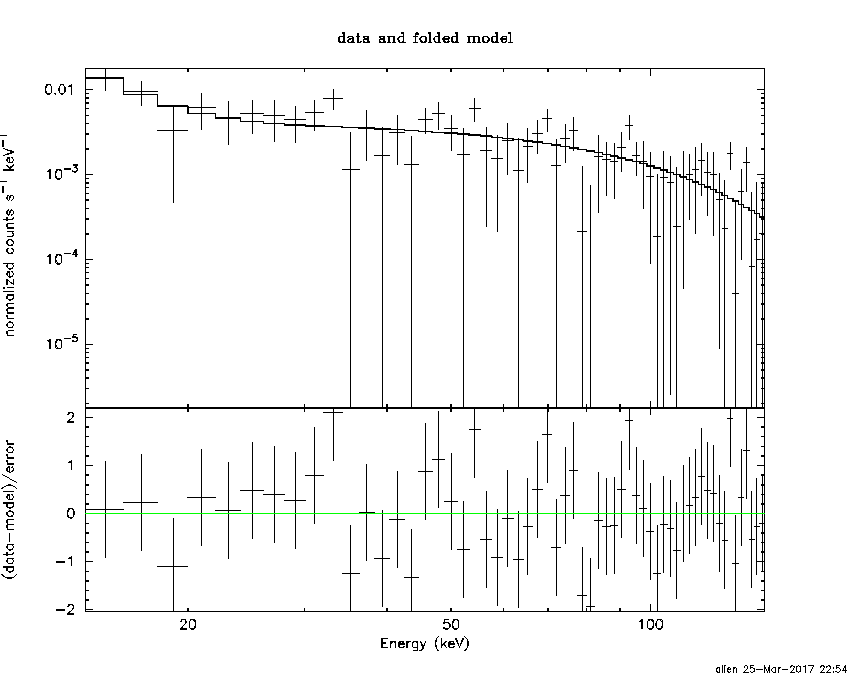
Time averaged spectrum fit using the average DRM
Power-law model
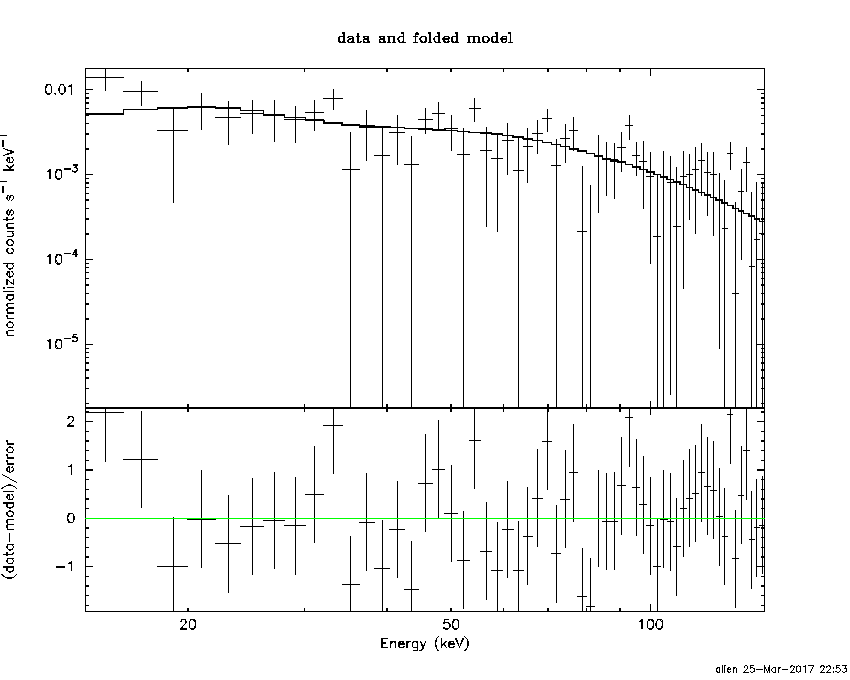
Time interval is from    0.000 sec. to    0.392 sec.

Spectral model in power-law:
------------------------------------------------------------
Parameters  : value       lower 90%   higher 90%
Photon index: -1.05624     ( -0.254038   0.259188 )
Norm@50keV  : 2.06376E-02    ( -0.00275449   0.0027498 )
------------------------------------------------------------
#Fit statistic : Chi-Squared =          51.59 using 59 PHA bins.
# Reduced chi-squared =         0.9051 for     57 degrees of freedom
# Null hypothesis probability =   6.775072e-01

Photon flux (15-150 keV)    in 0.392 sec: 2.38469 ( -0.32504  0.32586 ) ph/cm2/s
Energy fluence (15-150 keV)             : 8.58115e-08 ( -1.29521e-08  1.30292e-08 ) ergs/cm2
Cutoff power-law model
Time interval is from    0.000 sec. to    0.392 sec.
Spectral model in the cutoff power-law:
------------------------------------------------------------
Parameters  : value       lower 90%   higher 90%
Photon index: -7.70167     ( -0.241913   0.291533 )
Epeak [keV] : 746.400      ( -9999.36 -9999.36 )
Norm@50keV  : 1.13831E-05    ( -1.13406e-05   0.00281638 )
------------------------------------------------------------
#Fit statistic : Chi-Squared =          45.56 using 59 PHA bins.
# Reduced chi-squared =         0.8135 for     56 degrees of freedom
# Null hypothesis probability =   8.393565e-01

Photon flux (15-150 keV)    in 0.392 sec: 2.38445 ( -0.32564  0.32533 ) ph/cm2/s
Energy fluence (15-150 keV)             : 8.57288e-08 ( -1.29062e-08  1.30664e-08 ) ergs/cm2
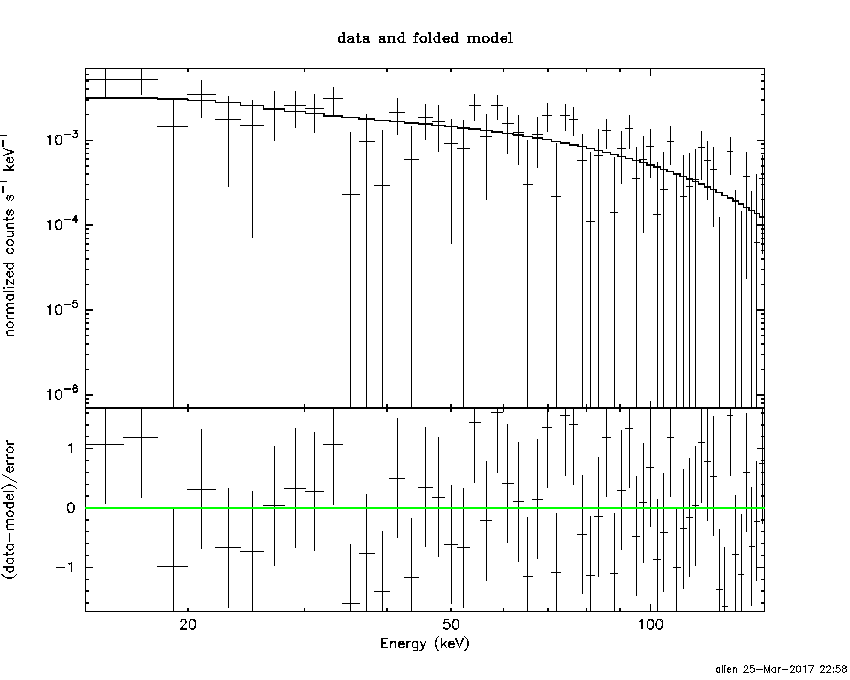
1-s peak spectrum fit
Power-law model

Time interval is from   -0.302 sec. to    0.698 sec.

Spectral model in power-law:
------------------------------------------------------------
Parameters  : value       lower 90%   higher 90%
Photon index: -1.07226     ( -0.295264   0.304024 )
Norm@50keV  : 9.46158E-03    ( -0.00150086   0.00149579 )
------------------------------------------------------------
#Fit statistic : Chi-Squared =          50.54 using 59 PHA bins.
# Reduced chi-squared =         0.8866 for     57 degrees of freedom
# Null hypothesis probability =   7.145537e-01

Photon flux (15-150 keV)    in 1 sec: 1.09472 ( -0.178377  0.1789 ) ph/cm2/s
Energy fluence (15-150 keV)             : 9.98275e-08 ( -1.74251e-08  1.75514e-08 ) ergs/cm2
Cutoff power-law model
Time interval is from   -0.302 sec. to    0.698 sec.
Spectral model in the cutoff power-law:
------------------------------------------------------------
Parameters  : value       lower 90%   higher 90%
Photon index: -2.06315     ( -0.00110296   0.0917686 )
Epeak [keV] : 22.8673      (   )
Norm@50keV  : 2.13105E-03    (     )
------------------------------------------------------------
#Fit statistic : Chi-Squared =          49.96 using 59 PHA bins.
# Reduced chi-squared =         0.8921 for     56 degrees of freedom
# Null hypothesis probability =   7.016243e-01

Photon flux (15-150 keV)    in 1 sec: 1.09645 (    ) ph/cm2/s
Energy fluence (15-150 keV)             : 9.97953e-08 ( 0  0 ) ergs/cm2
Time-resolved spectra
Distribution
T90 vs. Hardness ratio plot
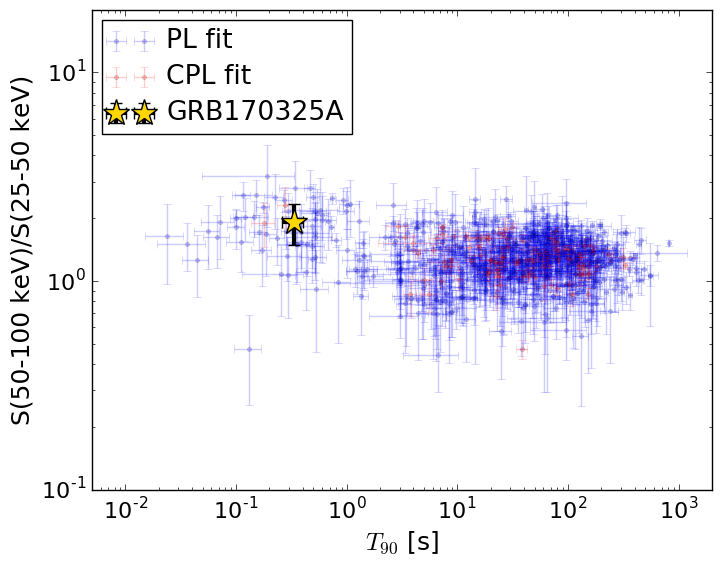
T90                                   = 0.3319999 sec.
Hardness ratio (energy fluence ratio) = 1.92362345014
S(15-50 keV) vs. S(50-150 keV) plot
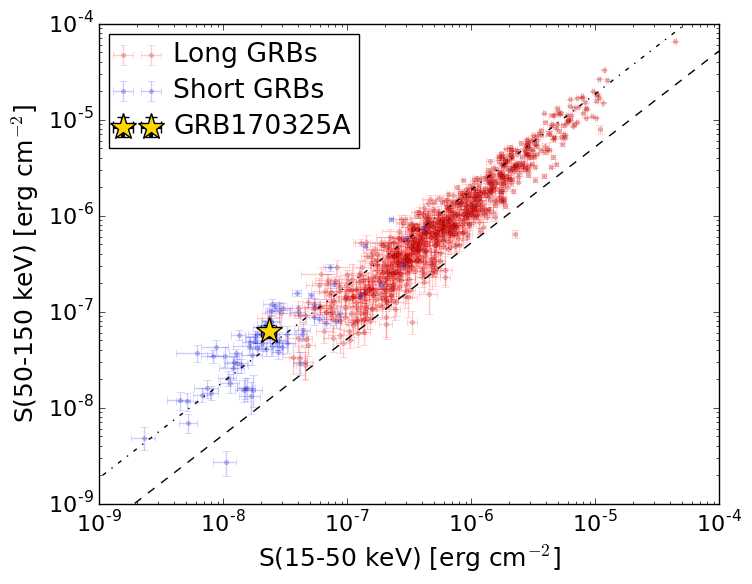
S(15-50 keV)  = 2.3312393e-08
S(50-150 keV) = 6.249832e-08
The dash-dotted line and the dashed line traces the fluences calculated from the Band function with Epeak = 15 and 150 keV, respectively. Both lines assume a canonical values of alpha = -1 and beta = -2.5.
Mask shadow pattern
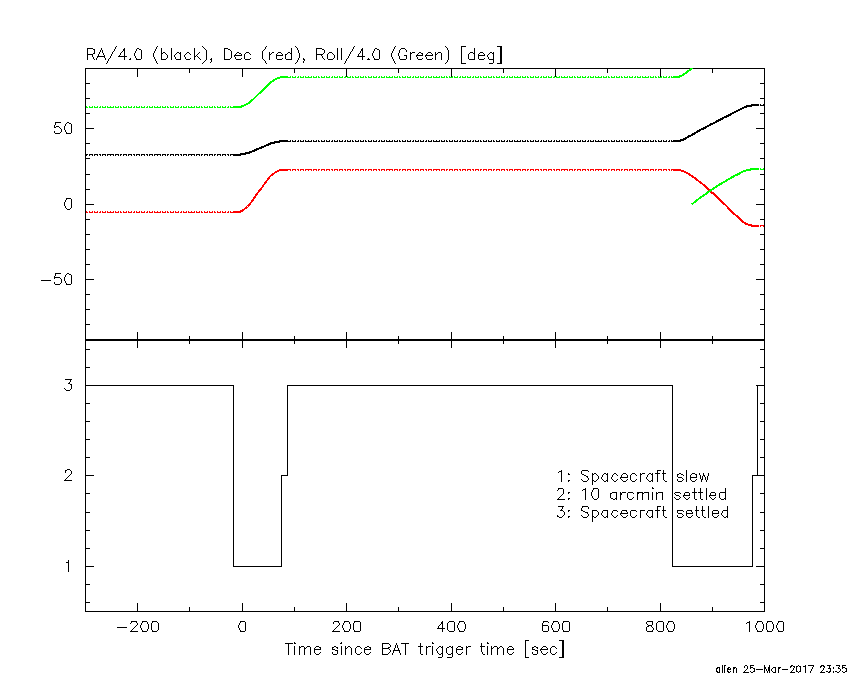
Mask shadow pattern unavailable because this burst occurs during telescope slews.Spacecraft aspect plot