Analysis Summary
Notes:
- 1) No attempt has been made to eliminate the non-significant decimal places.
- 2) This batgrbproduct analysis is done using the HEASARC data.
- 3) This batgrbproduct analysis is using the flight position for the mask-weighting calculation.
======================================================================
BAT GRB EVENT DATA PROCESSING REPORT
Process Script Ver: batgrbproduct v2.46
Process Start Time: Tue Apr 25 16:32:50 EDT 2017
Host Name: bat1
Current Working Dir: /local/data/bat1/alien/Swift_3rdBATcatalog/event/batevent_reproc/trigger744773
======================================================================
Trigger: 00744773 Segment: 000
BAT Trigger Time: 512605810.176 [s; MET]
Trigger Stop: 512605814.272 [s; MET]
UTC: 2017-03-30T22:29:51.341320 [includes UTCF correction]
Where From?: TDRSS position message
BAT
RA: 283.326251844694 Dec: -13.4370573410381 [deg; J2000]
Catalogged Source?: NO
Point Source?: YES
GRB Indicated?: YES [ by BAT flight software ]
Image S/N Ratio: 9.35
Image Trigger?: NO
Rate S/N Ratio: 18.6547581061776 [ if not an image trigger ]
Image S/N Ratio: 9.35
Analysis Position: [ source = BAT ]
RA: 283.326251844694 Dec: -13.4370573410381 [deg; J2000]
Refined Position: [ source = BAT pre-slew burst ]
RA: 283.323263473062 Dec: -13.4483178419652 [deg; J2000]
{ 18h 53m 17.6s , -13d 26' 53.9" }
+/- 1.45034862873674 [arcmin] (estimated 90% radius based on SNR)
+/- 0.622082567720576 [arcmin] (formal 1-sigma fit error)
SNR: 17.8831290455553
Angular difference between the analysis and refined position is 0.697773 arcmin
Partial Coding Fraction: 0.4648438 [ including projection effects ]
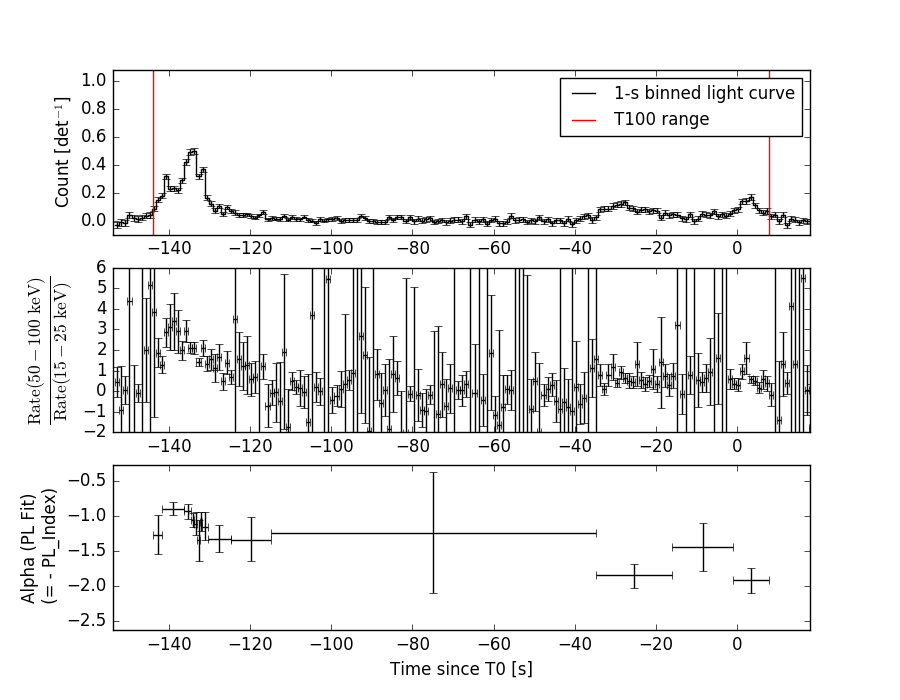
Duration
T90: 144.46799993515 +/- 2.18785005650547
Measured from: -141.167999982834
to: 3.29999995231628 [s; relative to TRIGTIME]
T50: 109.767999947071 +/- 2.90593321125023
Measured from: -135.315999984741
to: -25.5480000376701 [s; relative to TRIGTIME]
Fluence
Peak Flux (peak 1 second)
Measured from: -134.708000004292
to: -133.708000004292 [s; relative to TRIGTIME]
Total Fluence
Measured from: -143.864000022411
to: 7.97200000286102 [s; relative to TRIGTIME]
Band 1 Band 2 Band 3 Band 4
15-25 25-50 50-100 100-350 keV
Total 2.000650 2.867526 2.591856 0.852053
0.112916 0.114838 0.098997 0.083849 [error]
Peak 0.104025 0.183294 0.224516 0.073554
0.010609 0.011464 0.011670 0.008684 [error]
[ fluence units of on-axis counts / fully illuminated detector ]
======================================================================
====== Table of the duration information =============================
Value tstart tstop
T100 151.836 -143.864 7.972
T90 144.468 -141.168 3.300
T50 109.768 -135.316 -25.548
Peak 1.000 -134.708 -133.708
====== Spectral Analysis Summary =====================================
Model : spectral model: simple power-law (PL) and cutoff power-law (CPL)
Ph_index : photon index: E^{Ph_index}
Ph_90err : 90% error of the photon index
Epeak : Epeak in keV
Epeak_90err: 90% error of Epeak
Norm : normalization at 50 keV in both the PL model and CPL model
Nomr_90err : 90% error of the normalization
chi2 : Chi-Squared
dof : degree of freedo
=== Time-averaged spectral analysis ===
(Best model with acceptable fit: PL)
Model Ph_index Ph_90err_low Ph_90err_hi Epeak Epeak_90err_low Epeak_90err_hi Norm Nomr_90err_low Norm_90err_hi chi2 dof
PL -1.333 -0.077 0.078 - - - 3.70e-03 -1.53e-04 1.53e-04 37.360 57
CPL -1.291 -0.114 0.237 925.309 -925.309 -925.309 3.87e-03 -3.10e-04 -2.59e-06 37.510 56
=== 1-s peak spectral analysis ===
(Best model with acceptable fit: N/A)
Model Ph_index Ph_90err_low Ph_90err_hi Epeak Epeak_90err_low Epeak_90err_hi Norm Nomr_90err_low Norm_90err_hi chi2 dof
PL -1.027 -0.103 0.104 - - - 3.96e-02 -2.41e-03 2.41e-03 58.200 57
CPL -0.559 -0.408 0.454 183.251 -61.812 683.907 6.30e-02 -2.06e-02 3.38e-02 54.330 56
=== Fluence/Peak Flux Summary ===
Model Band1 Band2 Band3 Band4 Band5 Total
15-25 25-50 50-100 100-350 15-150 15-350 keV
Fluence PL 6.13e-07 1.25e-06 1.98e-06 6.99e-06 5.51e-06 1.08e-05 erg/cm2
90%_error_low -5.16e-08 -6.20e-08 -9.76e-08 -7.67e-07 -2.43e-07 -8.21e-07 erg/cm2
90%_error_hi 5.32e-08 6.16e-08 9.73e-08 8.33e-07 2.44e-07 8.74e-07 erg/cm2
Peak flux PL 1.04e+00 1.39e+00 1.36e+00 2.40e+00 4.57e+00 6.18e+00 ph/cm2/s
90%_error_low -1.26e-01 -1.06e-01 -8.83e-02 -3.18e-01 -2.85e-01 -3.98e-01 ph/cm2/s
90%_error_hi 1.32e-01 1.05e-01 8.78e-02 3.47e-01 2.85e-01 4.04e-01 ph/cm2/s
Fluence CPL 6.16e-07 1.25e-06 1.98e-06 7.16e-06 5.51e-06 1.09e-05 erg/cm2
90%_error_low N/A -6.21e-08 -1.01e-07 -2.33e-06 -2.73e-07 -2.46e-06 erg/cm2
90%_error_hi N/A 6.57e-08 1.21e-07 2.64e-07 2.55e-07 4.08e-07 erg/cm2
Peak flux CPL 9.09e-01 1.41e+00 1.44e+00 1.58e+00 4.48e+00 5.35e+00 ph/cm2/s
90%_error_low -1.62e-01 -1.13e-01 -1.13e-01 -4.61e-01 -2.94e-01 -5.60e-01 ph/cm2/s
90%_error_hi 1.69e-01 1.14e-01 1.15e-01 7.05e-01 2.94e-01 7.51e-01 ph/cm2/s
======================================================================
Image
Pre-slew 15.0-350.0 keV image (Event data)
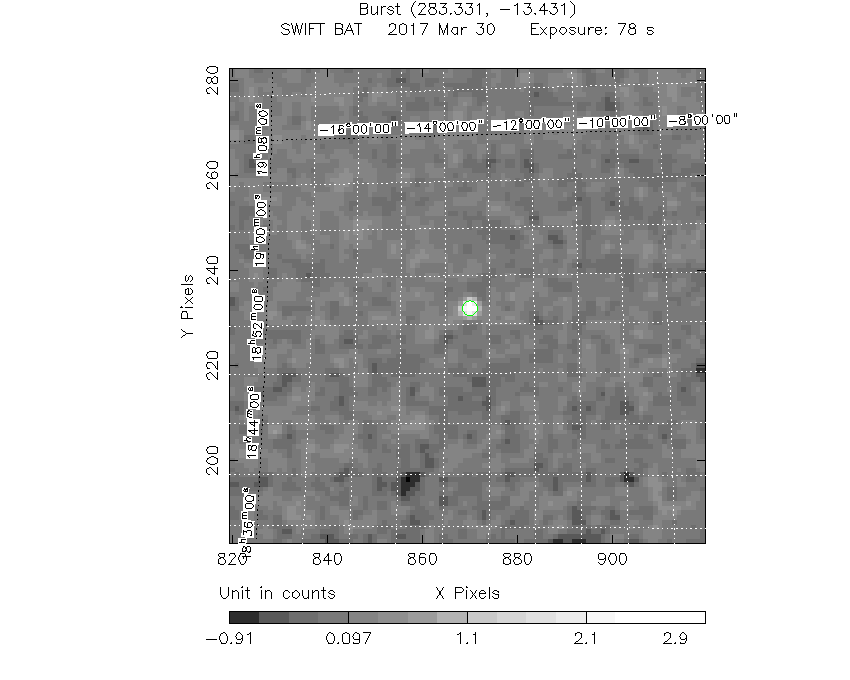
#   RAcent    DECcent   POSerr    Theta     Phi              Peak Cts       SNR   Name
  283.3233   -13.4483   0.0108    27.2186    87.7392         3.2332168     17.883 TRIG_00744773

Foreground time interval of the image:
-69.675   7.972 (delta_t =  77.647 [sec])
Background time interval of the image:
Light Curves
Note: The mask-weighted lightcurves have units of either count/det or counts/sec/det, where a det is 0.4 x 0.4 = 0.16 sq cm.
Full-time range; 1 s binning
Other quick-look light curves:
- 64 ms binning (zoomed)
- 16 ms binning (zoomed)
- 8 ms binning (zoomed)
- 2 ms binning (zoomed)
- SN=5 or 10 s binning (full-time range)
- Raw light curve
Spectra
- 64 ms binning (zoomed)
- 16 ms binning (zoomed)
- 8 ms binning (zoomed)
- 2 ms binning (zoomed)
- SN=5 or 10 s binning (full-time range)
- Raw light curve
Spectra
Notes:
- 1) The fitting includes the systematic errors.
- 2) When the burst includes telescope slew time periods, the fitting uses an average response file made from multiple 5-s response files through out the slew time plus single time preiod for the non-slew times, and weighted by the total counts in the corresponding time period using addrmf. An average response file is needed becuase a spectral fit using the pre-slew DRM will introduce some errors in both a spectral shape and a normalization if the PHA file contains a lot of the slew/post-slew time interval.
- 3) For fits to more complicated models (e.g. a power-law over a cutoff power-law), the BAT team has decided to require a chi-square improvement of more than 6 for each extra dof.
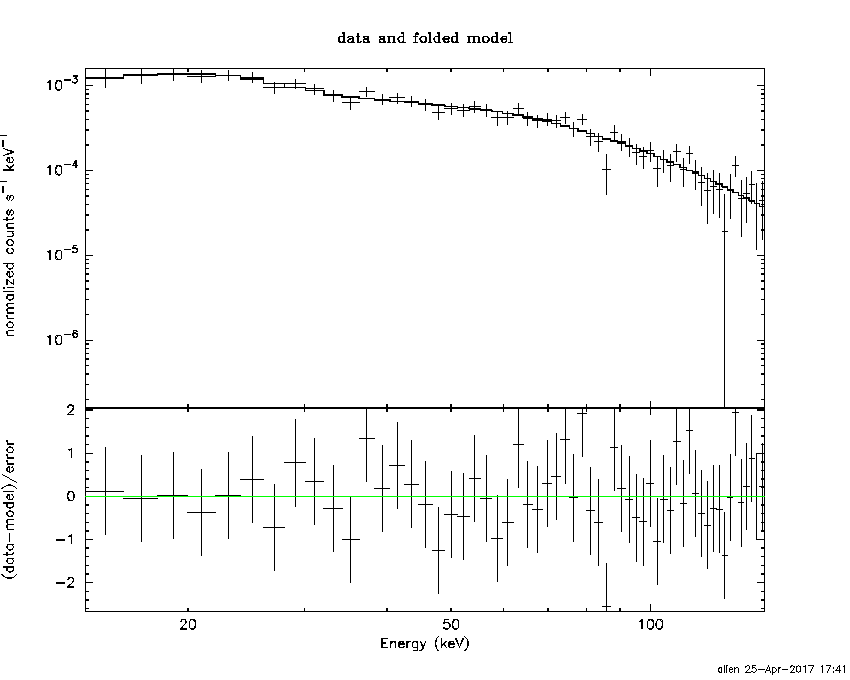
Time averaged spectrum fit using the average DRM
Power-law model

Time interval is from -143.864 sec. to    7.972 sec.

Spectral model in power-law:
------------------------------------------------------------
Parameters  : value       lower 90%   higher 90%
Photon index: -1.3333     ( -0.0773998   0.0778339 )
Norm@50keV  : 3.69883E-03    ( -0.000153455   0.000153414 )
------------------------------------------------------------
#Fit statistic : Chi-Squared =          37.36 using 59 PHA bins.
# Reduced chi-squared =         0.6555 for     57 degrees of freedom
# Null hypothesis probability =   9.794295e-01

Photon flux (15-150 keV)    in 151.8 sec: 0.444107 ( -0.019985  0.020072 ) ph/cm2/s
Energy fluence (15-150 keV)             : 5.50544e-06 ( -2.43062e-07  2.43689e-07 ) ergs/cm2
Cutoff power-law model
Time interval is from -143.864 sec. to    7.972 sec.
Spectral model in the cutoff power-law:
------------------------------------------------------------
Parameters  : value       lower 90%   higher 90%
Photon index: -1.32957     ( -0.0833196   0.26826 )
Epeak [keV] : 1.00000E+04      ( -10000 -10000 )
Norm@50keV  : 3.71356E-03    ( -0.000153792   0.000153782 )
------------------------------------------------------------
#Fit statistic : Chi-Squared =          37.37 using 59 PHA bins.
# Reduced chi-squared =         0.6673 for     56 degrees of freedom
# Null hypothesis probability =   9.738186e-01

Photon flux (15-150 keV)    in 151.8 sec: 0.444792 ( -0.022792  0.020778 ) ph/cm2/s
Energy fluence (15-150 keV)             : 5.51356e-06 ( -2.72829e-07  2.54795e-07 ) ergs/cm2
1-s peak spectrum fit
Power-law model
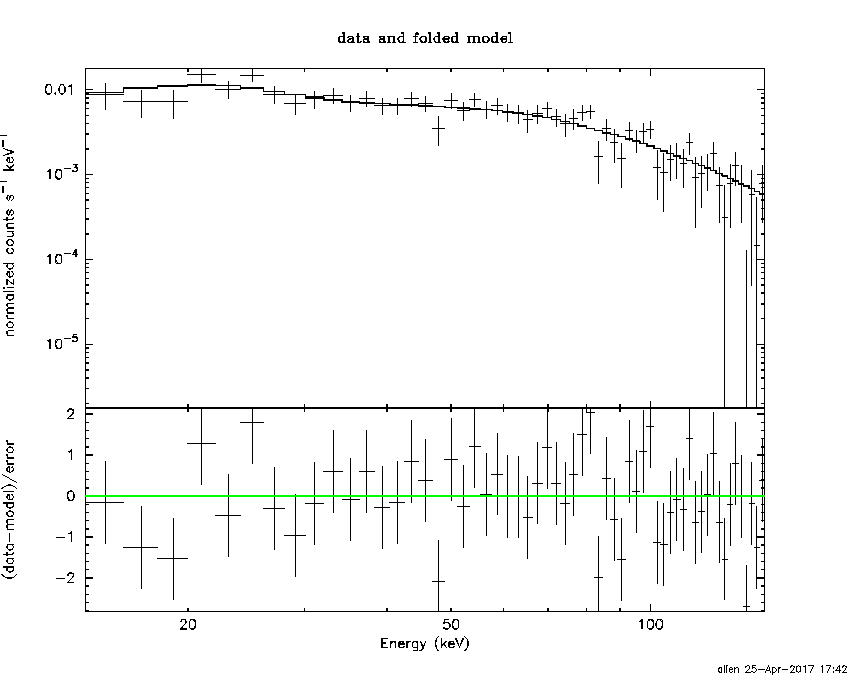
Time interval is from -134.708 sec. to -133.708 sec.

Spectral model in power-law:
------------------------------------------------------------
Parameters  : value       lower 90%   higher 90%
Photon index: -1.02661     ( -0.103061   0.104324 )
Norm@50keV  : 3.96144E-02    ( -0.00241224   0.00240747 )
------------------------------------------------------------
#Fit statistic : Chi-Squared =          58.20 using 59 PHA bins.
# Reduced chi-squared =          1.021 for     57 degrees of freedom
# Null hypothesis probability =   4.309675e-01

Photon flux (15-150 keV)    in 1 sec: 4.56788 ( -0.28473  0.28519 ) ph/cm2/s
Energy fluence (15-150 keV)             : 4.24444e-07 ( -2.73988e-08  2.74952e-08 ) ergs/cm2
Cutoff power-law model
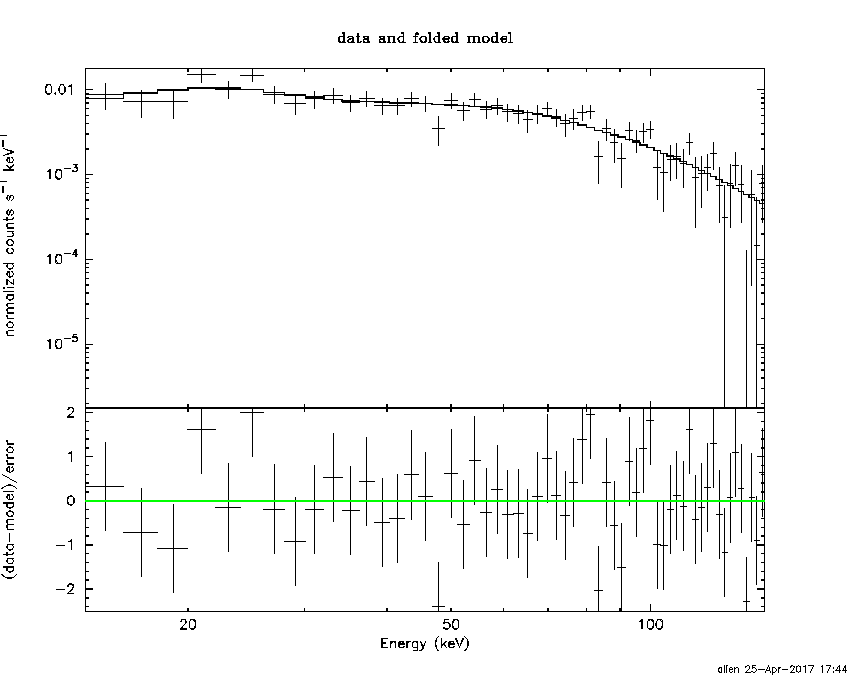
Time interval is from -134.708 sec. to -133.708 sec.
Spectral model in the cutoff power-law:
------------------------------------------------------------
Parameters  : value       lower 90%   higher 90%
Photon index: -0.559419     ( -0.408432   0.453776 )
Epeak [keV] : 183.251      ( -61.8113 683.907 )
Norm@50keV  : 6.30008E-02    ( -0.0205832   0.0338109 )
------------------------------------------------------------
#Fit statistic : Chi-Squared =          54.33 using 59 PHA bins.
# Reduced chi-squared =         0.9702 for     56 degrees of freedom
# Null hypothesis probability =   5.382716e-01

Photon flux (15-150 keV)    in 1 sec: 4.48472 ( -0.29358  0.29389 ) ph/cm2/s
Energy fluence (15-150 keV)             : 4.18042e-07 ( -2.85308e-08  2.84257e-08 ) ergs/cm2
Time-resolved spectra
Distribution
T90 vs. Hardness ratio plot
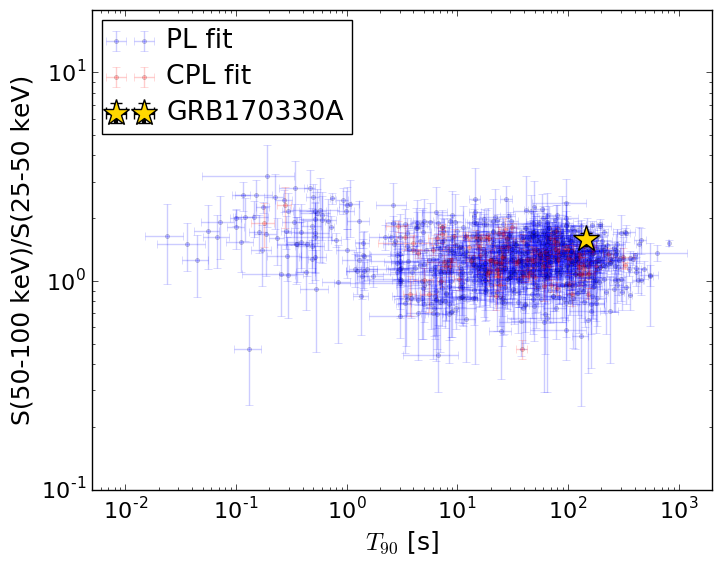
T90                                   = 144.468 sec.
Hardness ratio (energy fluence ratio) = 1.58744957174
S(15-50 keV) vs. S(50-150 keV) plot
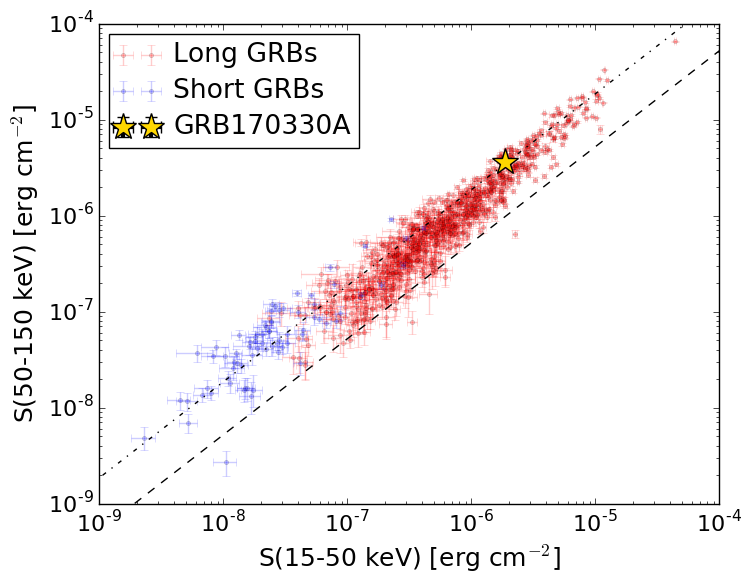
S(15-50 keV)  = 1.8616911e-06
S(50-150 keV) = 3.643705e-06
The dash-dotted line and the dashed line traces the fluences calculated from the Band function with Epeak = 15 and 150 keV, respectively. Both lines assume a canonical values of alpha = -1 and beta = -2.5.
Mask shadow pattern
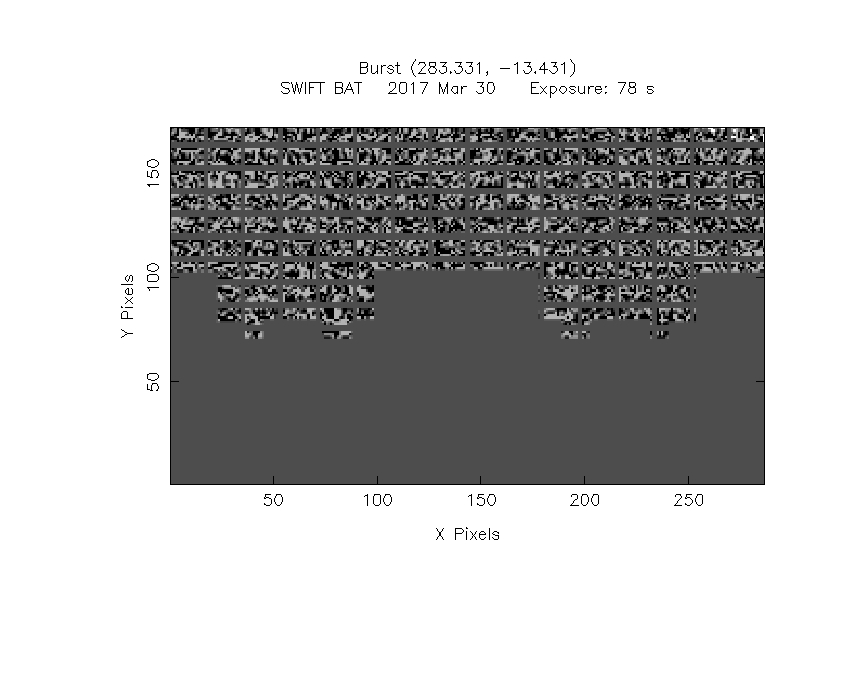
IMX = 2.028951154618287E-02, IMY = -5.139404562040610E-01
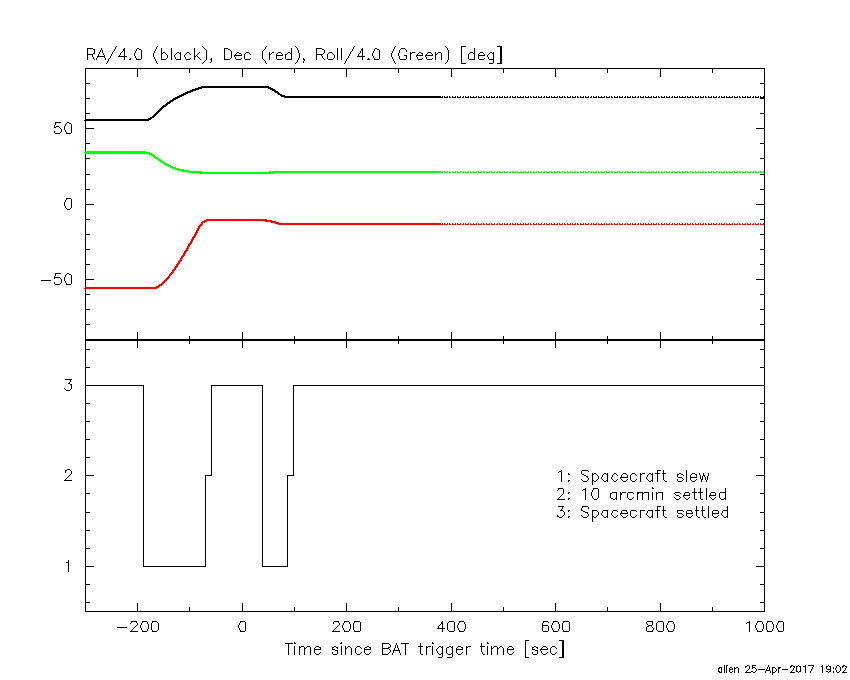
Spacecraft aspect plot
Bright source in the pre-burst/pre-slew/post-slew images
Pre-burst image of 15-350 keV band
Time interval of the image:
Pre-slew background subtracted image of 15-350 keV band
Time interval of the image:
-69.675400 7.972000

# RAcent  DECcent POSerr Theta    Phi  PeakCts   SNR AngSep     Name
#  [deg]    [deg]    ['] [deg]  [deg]                   [']
270.1403 -25.0756   83.0  41.3   70.3  -0.0659  -0.1    7.8	GX 5-1
270.3229 -25.6262   11.7  41.2   69.4  -0.4928  -1.0    7.1	GRS 1758-258
273.9973 -14.0396   99.0  36.3   87.1   0.0381   0.1    0.5	GX 17+2
276.0219 -30.3883    5.1  38.0   59.9   0.6571   2.3    5.2	H1820-303
284.9799 -24.7798    5.9  28.4   63.2   0.3500   1.9    9.0	HT1900.1-2455
288.7708  10.9204    2.5  31.0  140.0   0.8324   4.7    2.2	GRS 1915+105
299.6083  35.2095    1.1  47.2  173.5   3.1489  10.1    1.0	Cyg X-1
308.2200  40.9409    5.0  51.8 -176.4   0.8906   2.3    5.0	Cyg X-3
326.0744  38.4732   93.0  51.2 -158.6   0.0438   0.1   10.2	Cyg X-2
283.3233 -13.4483    0.6  27.2   87.7   3.2325  17.9 ------	UNKNOWN
339.2962 -62.5173    2.2  55.6   -9.1   2.2992   5.1 ------	UNKNOWN
332.2487  40.7934    3.4  55.1 -154.2   2.3839   3.4 ------	UNKNOWN
356.0803 -24.1431    2.9  44.8  -60.2   2.3391   4.0 ------	UNKNOWN
Post-slew image of 15-350 keV band
Time interval of the image:
87.724610 962.978300

# RAcent  DECcent POSerr Theta    Phi  PeakCts   SNR AngSep     Name
#  [deg]    [deg]    ['] [deg]  [deg]                   [']
244.9623 -15.6254    1.1  37.2   86.9  26.3455  10.3    1.3	Sco X-1
255.9985 -37.8232    0.9  34.4   45.0  18.1812  12.6    1.4	4U 1700-377
256.5070 -36.5168    3.9  33.3   46.5   4.0443   3.0    6.6	GX 349+2
262.9985 -24.7277    1.8  22.3   61.6   5.6212   6.3    1.2	GX 1+4
264.7965 -44.6020    6.3  34.9   28.4   2.1768   1.8    9.4	4U 1735-44
268.2182  -1.3190    0.0  19.3  132.8  -1.3014  -1.5   12.0	SW J1753.5-0127
270.4476 -25.0981   16.7  16.8   49.4   0.5717   0.7    9.0	GX 5-1
270.1382 -25.7156    6.6  17.5   48.5   1.4576   1.8    9.0	GRS 1758-258
274.1173 -13.8826    4.7   9.0   91.2   1.7521   2.4   11.3	GX 17+2
275.8526 -30.2742   11.4  18.2   26.3   0.7270   1.0    6.7	H1820-303
285.1810 -24.7566    0.0  11.4   -3.3   0.2940   0.3   12.6	HT1900.1-2455
288.7539  10.9091    1.5  24.9 -162.3   6.1063   7.6    3.4	GRS 1915+105
299.6008  35.1906    1.0  51.0 -157.8  27.1484  11.3    0.8	Cyg X-1
262.8719 -33.9662   10.6  27.7   43.8   1.0557   1.1    9.8	GX 354-0
259.8938 -25.0180    0.7  24.9   64.0  16.4395  16.7 ------	UNKNOWN
268.4515  36.3519    2.6  51.7  169.8  11.2337   4.4 ------	UNKNOWN
285.5894 -65.3992    3.3  52.0    3.9   6.6416   3.5 ------	UNKNOWN
309.2001 -65.7325    3.7  55.1   -7.5   8.2662   3.1 ------	UNKNOWN
323.8371 -54.8663    4.9  52.0  -23.2   5.0189   2.4 ------	UNKNOWN
329.3638 -38.6414    5.3  47.7  -44.3   8.7157   2.2 ------	UNKNOWN
319.6049  10.3433    3.8  43.1 -116.6  12.3461   3.1 ------	UNKNOWN