Analysis Summary
Notes:
- 1) No attempt has been made to eliminate the non-significant decimal places.
- 2) This batgrbproduct analysis is done using the HEASARC data.
- 3) This batgrbproduct analysis is using the flight position for the mask-weighting calculation.
Special note:
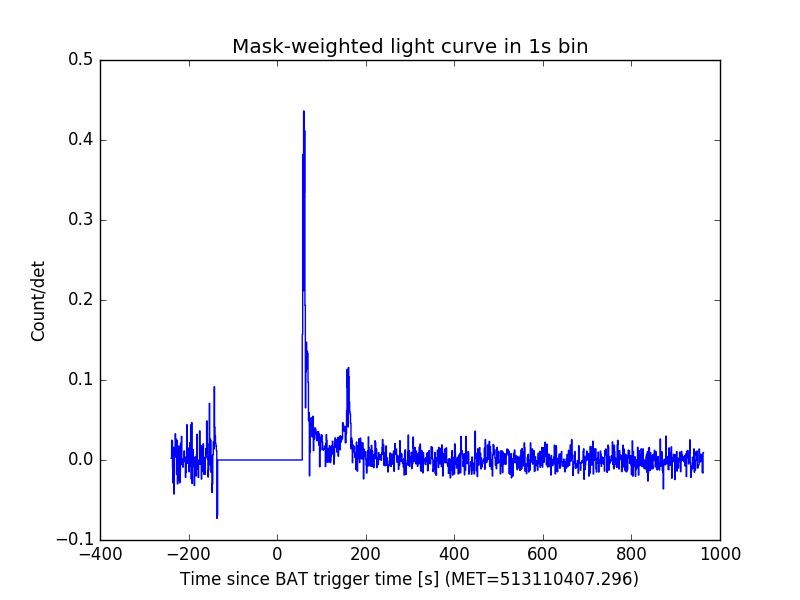
Due to the low partial coding fraction of this burst, the light curves and burst durations are created using the special DETECTION mask aperture. However, the spectral analysis is done using the default FLUX aperture for more accurate results, and thus the spectral analysis is only available after T+56.7 s (see figure below), when the burst came into the BAT calibrated field of view.FLUX-mask-weighted light curve (pcodethresh=0.05; aperture=CALDB:FLUX)
======================================================================
                  BAT GRB EVENT DATA PROCESSING REPORT
    Process Script Ver: batgrbproduct v2.46
    Process Start Time: Wed Apr 26 14:19:58 EDT 2017
             Host Name: bat1
   Current Working Dir: /local/data/bat1/alien/Swift_3rdBATcatalog/event/batevent_reproc/trigger745797
======================================================================

  Trigger: 00745797      Segment: 000

  BAT Trigger Time: 513110407.296   [s; MET]
      Trigger Stop: 513110415.488   [s; MET]
               UTC: 2017-04-05T18:39:48.432100    [includes UTCF correction]
       Where From?: TDRSS position message

  BAT
    RA: 219.810293944594   Dec: -25.24359290963  [deg; J2000]

     Catalogged Source?: NO
     Point Source?:      YES
     GRB Indicated?:     YES    [ by BAT flight software ]
     Image S/N Ratio:    9.82
     Image Trigger?:     NO
     Rate S/N Ratio:     57.5325994545701  [ if not an image trigger ]
     Image S/N Ratio:    9.82

  Analysis Position:   [ source = BAT ]
    RA: 219.810293944594   Dec: -25.24359290963  [deg; J2000]

  Refined Position:   [ source = BAT pre-slew burst ]
    RA: 219.82396483382   Dec: -25.2364074660541  [deg; J2000]
        { 14h 39m 17.8s , -25d 14' 11.1" }
         +/- 1.31214961623829 [arcmin] (estimated 90% radius based on SNR)
         +/- 0.471966533934874 [arcmin] (formal 1-sigma fit error)
    SNR: 20.633396604929

  Angular difference between the analysis and refined position is 0.858108 arcmin

  Partial Coding Fraction: 0.06933594    [ including projection effects ]

  Duration
     T90: 165.31200003624 +/- 32.8929220435928
        Measured from: -16.8159999847412
                   to: 148.496000051498     [s; relative to TRIGTIME]
     T50: 47.5200000405312 +/- 2.54092891581977
        Measured from: 0.751999974250793
                   to: 48.272000014782     [s; relative to TRIGTIME]


  Fluence
     Peak Flux  (peak 1 second)
        Measured from: 4.30799996852875
                   to: 5.30799996852875     [s; relative to TRIGTIME]
     Total Fluence
        Measured from: -27.1040000319481
                   to: 242.495999991894     [s; relative to TRIGTIME]

             Band 1     Band 2     Band 3     Band 4
              15-25      25-50     50-100    100-350     keV
 Total     6.726083  11.928841  12.148617   3.838516
           0.312249   0.314560   0.289388   0.228585 [error]
 Peak      0.214446   0.306150   0.378312   0.076191
           0.036772   0.041449   0.043702   0.031248 [error]

     [ fluence units of on-axis counts / fully illuminated detector ]

======================================================================


====== Table of the duration information =============================

        Value   tstart    tstop
T100  269.600  -27.104  242.496
T90   165.312  -16.816  148.496
T50    47.520    0.752   48.272
Peak    1.000    4.308    5.308


====== Spectral Analysis Summary =====================================

Model      : spectral model: simple power-law (PL) and cutoff power-law (CPL)
Ph_index   : photon index: E^{Ph_index}
Ph_90err   : 90% error of the photon index
Epeak      : Epeak in keV
Epeak_90err: 90% error of Epeak
Norm       : normalization at 50 keV in both the PL model and CPL model
Nomr_90err : 90% error of the normalization
chi2       : Chi-Squared
dof        : degree of freedo

=== Time-averaged spectral analysis ===
(Best model with acceptable fit: PL)

Model Ph_index Ph_90err_low Ph_90err_hi  Epeak  Epeak_90err_low  Epeak_90err_hi  Norm       Nomr_90err_low    Norm_90err_hi    chi2    dof
PL      -1.515    -0.119      0.118       -           -               -         2.20e-03     -1.43e-04          1.43e-04      63.350   57
CPL     -1.516    -0.116      0.158     9999.360    -9999.360      -9999.360      2.21e-03     -5.04e-04          7.78e-04      63.370   56


=== 1-s peak spectral analysis ===
(Best model with acceptable fit: N/A)

Model Ph_index Ph_90err_low Ph_90err_hi  Epeak  Epeak_90err_low  Epeak_90err_hi  Norm       Nomr_90err_low    Norm_90err_hi    chi2    dof
PL      N/A         N/A       N/A          -           -               -           N/A           N/A               N/A         N/A        N/A
CPL     N/A         N/A       N/A          N/A         N/A           N/A           N/A           N/A               N/A         N/A        N/A


=== Fluence/Peak Flux Summary ===

              Model    Band1     Band2     Band3     Band4     Band5     Total
                       15-25     25-50    50-100    100-350    15-150    15-350    keV
Fluence         PL   5.30e-07  9.66e-07  1.35e-06  3.96e-06  3.88e-06  6.81e-06   erg/cm2
      90%_error_low -6.13e-08 -6.70e-08 -1.14e-07 -6.93e-07 -2.73e-07 -7.80e-07   erg/cm2
      90%_error_hi   6.36e-08  6.66e-08  1.14e-07  7.89e-07  2.75e-07  8.56e-07   erg/cm2
Peak flux       PL     N/A      N/A      N/A      N/A      N/A      N/A     ph/cm2/s
Image
Light Curves
Note: The mask-weighted lightcurves have units of either count/det or counts/sec/det, where a det is 0.4 x 0.4 = 0.16 sq cm.
Full-time range; 1 s binning
Other quick-look light curves:
- 64 ms binning (zoomed)
- 16 ms binning (zoomed)
- 8 ms binning (zoomed)
- 2 ms binning (zoomed)
- SN=5 or 10 s binning (full-time range)
- Raw light curve
Spectra
- 64 ms binning (zoomed)
- 16 ms binning (zoomed)
- 8 ms binning (zoomed)
- 2 ms binning (zoomed)
- SN=5 or 10 s binning (full-time range)
- Raw light curve
Spectra
Notes:
- 1) The fitting includes the systematic errors.
- 2) When the burst includes telescope slew time periods, the fitting uses an average response file made from multiple 5-s response files through out the slew time plus single time preiod for the non-slew times, and weighted by the total counts in the corresponding time period using addrmf. An average response file is needed becuase a spectral fit using the pre-slew DRM will introduce some errors in both a spectral shape and a normalization if the PHA file contains a lot of the slew/post-slew time interval.
- 3) For fits to more complicated models (e.g. a power-law over a cutoff power-law), the BAT team has decided to require a chi-square improvement of more than 6 for each extra dof.
Time averaged spectrum fit using the average DRM
Power-law model
Time interval is from   56.700 sec. to  242.496 sec.

Spectral model in power-law:
------------------------------------------------------------
Parameters  : value       lower 90%   higher 90%
Photon index: -1.5148     ( -0.118727   0.118421 )
Norm@50keV  : 2.20437E-03    ( -0.000143329   0.000142976 )
------------------------------------------------------------
#Fit statistic : Chi-Squared =          63.35 using 59 PHA bins.
# Reduced chi-squared =          1.111 for     57 degrees of freedom
# Null hypothesis probability =   2.624303e-01

Photon flux (15-150 keV)    in 185.8 sec: 0.276308 ( -0.018512  0.018569 ) ph/cm2/s
Energy fluence (15-150 keV)             : 3.87664e-06 ( -2.73299e-07  2.7496e-07 ) ergs/cm2
Cutoff power-law model

Time interval is from   56.700 sec. to  242.496 sec.
Spectral model in the cutoff power-law:
------------------------------------------------------------
Parameters  : value       lower 90%   higher 90%
Photon index: -1.51618     ( -0.116146   0.157876 )
Epeak [keV] : 9999.36      ( -9999.36 -9999.36 )
Norm@50keV  : 2.20664E-03    ( -0.000507137   0.000774694 )
------------------------------------------------------------
#Fit statistic : Chi-Squared =          63.37 using 59 PHA bins.
# Reduced chi-squared =          1.132 for     56 degrees of freedom
# Null hypothesis probability =   2.325820e-01

Photon flux (15-150 keV)    in 185.8 sec: 0.277438 ( -0.023788  0.021511 ) ph/cm2/s
Energy fluence (15-150 keV)             : 3.9136e-06 ( -3.11581e-07  2.37047e-07 ) ergs/cm2
1-s peak spectrum fit
1-s peak spectrum unavailable, likely because there are no event data in the 1-s peak range.
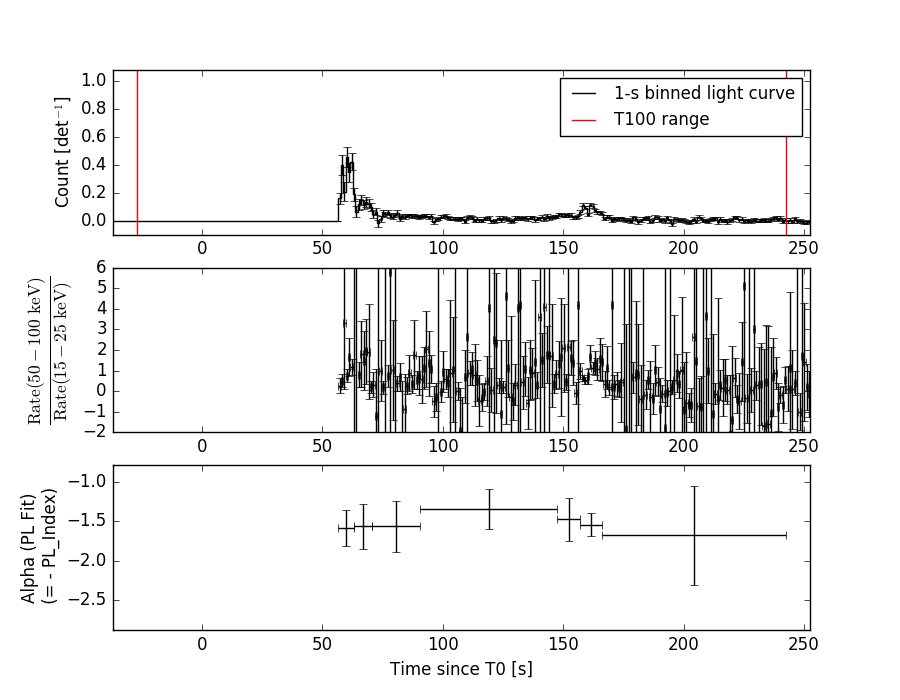
Time-resolved spectra
Distribution
T90 vs. Hardness ratio plot
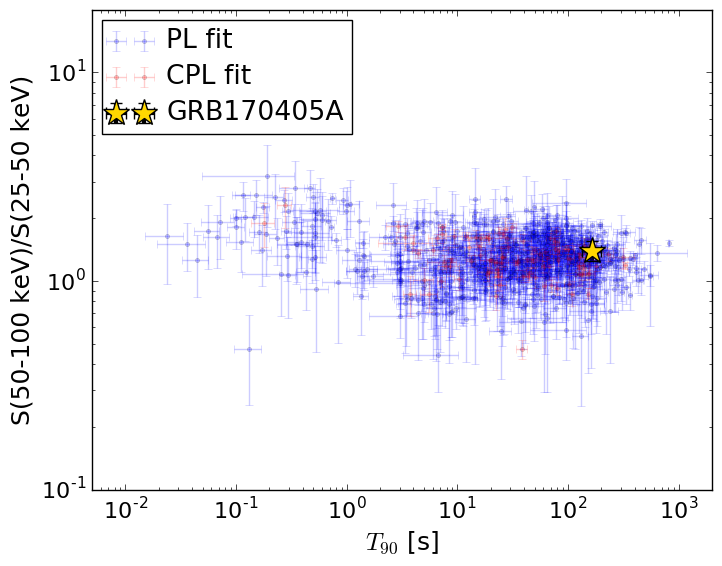
T90                                   = 165.312 sec.
Hardness ratio (energy fluence ratio) = 1.39981310254
S(15-50 keV) vs. S(50-150 keV) plot
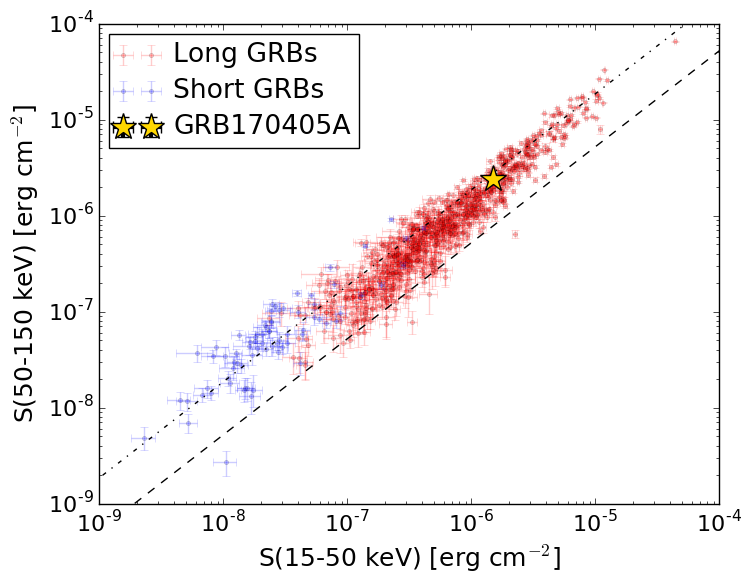
S(15-50 keV)  = 1.4959559e-06
S(50-150 keV) = 2.380749e-06
The dash-dotted line and the dashed line traces the fluences calculated from the Band function with Epeak = 15 and 150 keV, respectively. Both lines assume a canonical values of alpha = -1 and beta = -2.5.
Spacecraft aspect plot
Bright source in the event data image
Event data image of 15-350 keV band
Time interval of the image:
-27.104000 50.604600

# RAcent  DECcent POSerr Theta    Phi  PeakCts   SNR AngSep     Name
#  [deg]    [deg]    ['] [deg]  [deg]                   [']
245.0193 -15.5905    4.4  23.8  113.6  -0.6572  -2.6    3.8	Sco X-1
256.1332 -38.0218    0.0  12.4   34.8  -0.1799  -1.1   12.7	4U 1700-377
256.2902 -36.2461    0.0  11.2   41.0   0.1280   0.7   12.7	GX 349+2
262.8677 -24.5779    0.0   5.4  137.5  -0.4946  -2.8   12.7	GX 1+4
264.5410 -44.4380    7.3  15.5   -1.0  -0.2661  -1.6    8.7	4U 1735-44
268.2219  -1.5752   23.6  27.5  177.9  -0.1003  -0.5   11.4	SW J1753.5-0127
270.1271 -25.0954    4.4   5.1 -144.8  -0.4512  -2.6    8.6	GX 5-1
270.2859 -25.7696    7.7   4.7 -138.2   0.2708   1.5    1.8	GRS 1758-258
274.0533 -14.0183    6.8  16.6 -159.1  -0.3009  -1.7    3.0	GX 17+2
275.8760 -30.2177    9.6   8.3  -85.2  -0.2052  -1.2    9.3	H1820-303
285.1141 -24.7743    3.2  17.2 -105.8  -0.5875  -3.6    9.7	HT1900.1-2455
288.8859  11.0761    8.4  45.6 -154.3  -0.3515  -1.4    9.4	GRS 1915+105
263.0403 -33.8545   81.6   5.7   23.8  -0.0239  -0.1    2.8	GX 354-0
224.0955 -16.1367    3.4  40.9   92.9   4.1724   3.4 ------	UNKNOWN
219.8240 -25.2364    0.6  41.4   77.8  28.5590  20.6 ------	UNKNOWN
283.2185 -26.1987    2.5  15.1 -102.6   0.7911   4.7 ------	UNKNOWN
Webpage updated on:
Wed Apr 26 16:41:20 EDT 2017