Analysis Summary
Notes:
- 1) No attempt has been made to eliminate the non-significant decimal places.
- 2) This batgrbproduct analysis is done using the HEASARC data.
- 3) This batgrbproduct analysis is using the flight position for the mask-weighting calculation.
======================================================================
BAT GRB EVENT DATA PROCESSING REPORT
Process Script Ver: batgrbproduct v2.46
Process Start Time: Wed May 3 17:07:05 EDT 2017
Host Name: bat1
Current Working Dir: /local/data/bat1/alien/Swift_3rdBATcatalog/event/batevent_reproc/trigger748898
======================================================================
Trigger: 00748898 Segment: 000
BAT Trigger Time: 514301219.136 [s; MET]
Trigger Stop: 514301220.16 [s; MET]
UTC: 2017-04-19T13:26:40.202980 [includes UTCF correction]
Where From?: TDRSS position message
BAT
RA: 79.8660177495021 Dec: -21.4203767383782 [deg; J2000]
Catalogged Source?: NO
Point Source?: YES
GRB Indicated?: YES [ by BAT flight software ]
Image S/N Ratio: 7.66
Image Trigger?: NO
Rate S/N Ratio: 11.5325625946708 [ if not an image trigger ]
Image S/N Ratio: 7.66
Analysis Position: [ source = BAT ]
RA: 79.8660177495021 Dec: -21.4203767383782 [deg; J2000]
Refined Position: [ source = BAT pre-slew burst ]
RA: 79.8540155717891 Dec: -21.4339573708003 [deg; J2000]
{ 05h 19m 25.0s , -21d 26' 02.2" }
+/- 1.71630048690819 [arcmin] (estimated 90% radius based on SNR)
+/- 0.608855590440741 [arcmin] (formal 1-sigma fit error)
SNR: 14.0599914817981
Angular difference between the analysis and refined position is 1.055149 arcmin
Partial Coding Fraction: 0.53125 [ including projection effects ]
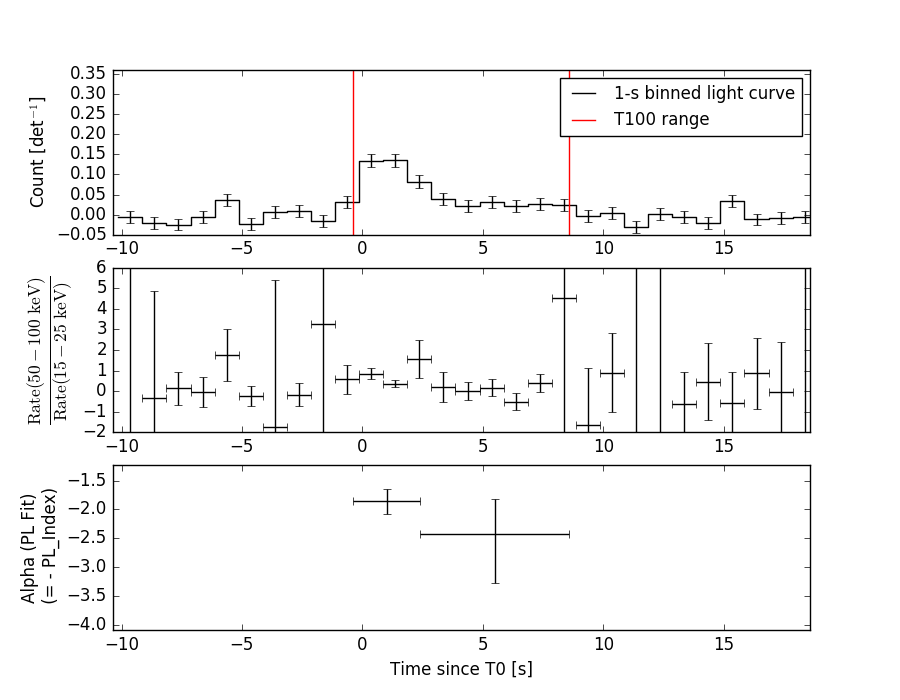
Duration
T90: 7.77600002288818 +/- 1.75110480013101
Measured from: -0.0719999670982361
to: 7.70400005578995 [s; relative to TRIGTIME]
T50: 2.97600001096725 +/- 1.9597224220684
Measured from: 0.760000050067902
to: 3.73600006103516 [s; relative to TRIGTIME]
Fluence
Peak Flux (peak 1 second)
Measured from: 0.460000038146973
to: 1.46000003814697 [s; relative to TRIGTIME]
Total Fluence
Measured from: -0.375999987125397
to: 8.58400005102158 [s; relative to TRIGTIME]
Band 1 Band 2 Band 3 Band 4
15-25 25-50 50-100 100-350 keV
Total 0.198783 0.211268 0.104903 0.027769
0.024177 0.025470 0.022347 0.019252 [error]
Peak 0.057119 0.062026 0.035233 0.009921
0.008633 0.009203 0.008042 0.006499 [error]
[ fluence units of on-axis counts / fully illuminated detector ]
======================================================================
====== Table of the duration information =============================
Value tstart tstop
T100 8.960 -0.376 8.584
T90 7.776 -0.072 7.704
T50 2.976 0.760 3.736
Peak 1.000 0.460 1.460
====== Spectral Analysis Summary =====================================
Model : spectral model: simple power-law (PL) and cutoff power-law (CPL)
Ph_index : photon index: E^{Ph_index}
Ph_90err : 90% error of the photon index
Epeak : Epeak in keV
Epeak_90err: 90% error of Epeak
Norm : normalization at 50 keV in both the PL model and CPL model
Nomr_90err : 90% error of the normalization
chi2 : Chi-Squared
dof : degree of freedo
=== Time-averaged spectral analysis ===
(Best model with acceptable fit: PL)
Model Ph_index Ph_90err_low Ph_90err_hi Epeak Epeak_90err_low Epeak_90err_hi Norm Nomr_90err_low Norm_90err_hi chi2 dof
PL -2.039 -0.272 0.249 - - - 3.61e-03 -6.40e-04 6.17e-04 53.200 57
CPL -1.701 -0.431 1.188 37.979 -35.487 -37.979 5.62e-03 N/A N/A 52.860 56
=== 1-s peak spectral analysis ===
(Best model with acceptable fit: PL)
Model Ph_index Ph_90err_low Ph_90err_hi Epeak Epeak_90err_low Epeak_90err_hi Norm Nomr_90err_low Norm_90err_hi chi2 dof
PL -1.915 -0.305 0.280 - - - 1.01e-02 -1.99e-03 1.92e-03 50.260 57
CPL -1.396 -0.782 1.597 50.555 N/A N/A 1.98e-02 N/A N/A 49.790 56
=== Fluence/Peak Flux Summary ===
Model Band1 Band2 Band3 Band4 Band5 Total
15-25 25-50 50-100 100-350 15-150 15-350 keV
Fluence PL 6.87e-08 9.10e-08 8.86e-08 1.54e-07 2.99e-07 4.03e-07 erg/cm2
90%_error_low -1.28e-08 -1.24e-08 -2.10e-08 -6.20e-08 -4.81e-08 -8.85e-08 erg/cm2
90%_error_hi 1.32e-08 1.23e-08 2.14e-08 8.39e-08 4.92e-08 1.05e-07 erg/cm2
Peak flux PL 6.19e-01 4.88e-01 2.59e-01 1.99e-01 1.46e+00 1.56e+00 ph/cm2/s
90%_error_low -1.41e-01 -7.77e-02 -6.54e-02 -8.29e-02 -2.33e-01 -2.51e-01 ph/cm2/s
90%_error_hi 1.47e-01 7.77e-02 6.58e-02 1.11e-01 2.33e-01 2.52e-01 ph/cm2/s
Fluence CPL N/A N/A N/A N/A N/A N/A erg/cm2
90%_error_low -1.28e-08 -1.24e-08 -2.10e-08 -6.20e-08 -4.81e-08 -8.85e-08 erg/cm2
90%_error_hi 1.32e-08 1.23e-08 2.14e-08 8.39e-08 4.92e-08 1.05e-07 erg/cm2
Peak flux CPL 5.86e-01 5.19e-01 2.61e-01 1.02e-01 1.43e+00 1.47e+00 ph/cm2/s
90%_error_low -1.67e-01 -1.01e-01 N/A -1.02e-01 -2.41e-01 -2.67e-01 ph/cm2/s
90%_error_hi 1.65e-01 1.13e-01 N/A 1.24e-01 2.40e-01 3.21e-01 ph/cm2/s
======================================================================
Image
Pre-slew 15.0-350.0 keV image (Event data)
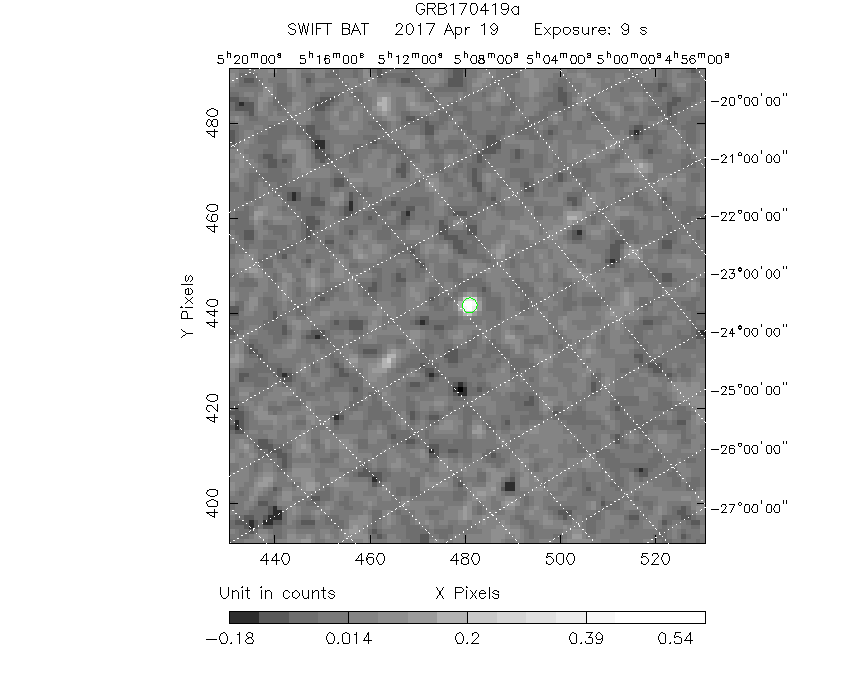
#   RAcent    DECcent   POSerr    Theta     Phi              Peak Cts       SNR   Name
   79.8540   -21.4340   0.0138    40.0591     5.0169         0.6543633     14.060 TRIG_00748898

Foreground time interval of the image:
 -0.376   8.584 (delta_t =   8.960 [sec])
Background time interval of the image:
-769.835 -715.357 (delta_t =  54.479 [sec])
-239.136  -0.376 (delta_t = 238.760 [sec])
Light Curves
Note: The mask-weighted lightcurves have units of either count/det or counts/sec/det, where a det is 0.4 x 0.4 = 0.16 sq cm.
Full-time range; 1 s binning
Other quick-look light curves:
- 64 ms binning (zoomed)
- 16 ms binning (zoomed)
- 8 ms binning (zoomed)
- 2 ms binning (zoomed)
- SN=5 or 10 s binning (full-time range)
- Raw light curve
Spectra
- 64 ms binning (zoomed)
- 16 ms binning (zoomed)
- 8 ms binning (zoomed)
- 2 ms binning (zoomed)
- SN=5 or 10 s binning (full-time range)
- Raw light curve
Spectra
Notes:
- 1) The fitting includes the systematic errors.
- 2) When the burst includes telescope slew time periods, the fitting uses an average response file made from multiple 5-s response files through out the slew time plus single time preiod for the non-slew times, and weighted by the total counts in the corresponding time period using addrmf. An average response file is needed becuase a spectral fit using the pre-slew DRM will introduce some errors in both a spectral shape and a normalization if the PHA file contains a lot of the slew/post-slew time interval.
- 3) For fits to more complicated models (e.g. a power-law over a cutoff power-law), the BAT team has decided to require a chi-square improvement of more than 6 for each extra dof.
Time averaged spectrum fit using the average DRM
Power-law model

Time interval is from   -0.376 sec. to    8.584 sec.

Spectral model in power-law:
------------------------------------------------------------
Parameters  : value       lower 90%   higher 90%
Photon index: -2.03879     ( -0.271912   0.249121 )
Norm@50keV  : 3.61102E-03    ( -0.000639877   0.000617274 )
------------------------------------------------------------
#Fit statistic : Chi-Squared =          53.20 using 59 PHA bins.
# Reduced chi-squared =         0.9334 for     57 degrees of freedom
# Null hypothesis probability =   6.183075e-01

Photon flux (15-150 keV)    in 8.96 sec: 0.551587 ( -0.074119  0.074138 ) ph/cm2/s
Energy fluence (15-150 keV)             : 2.99136e-07 ( -4.81103e-08  4.92158e-08 ) ergs/cm2
Cutoff power-law model
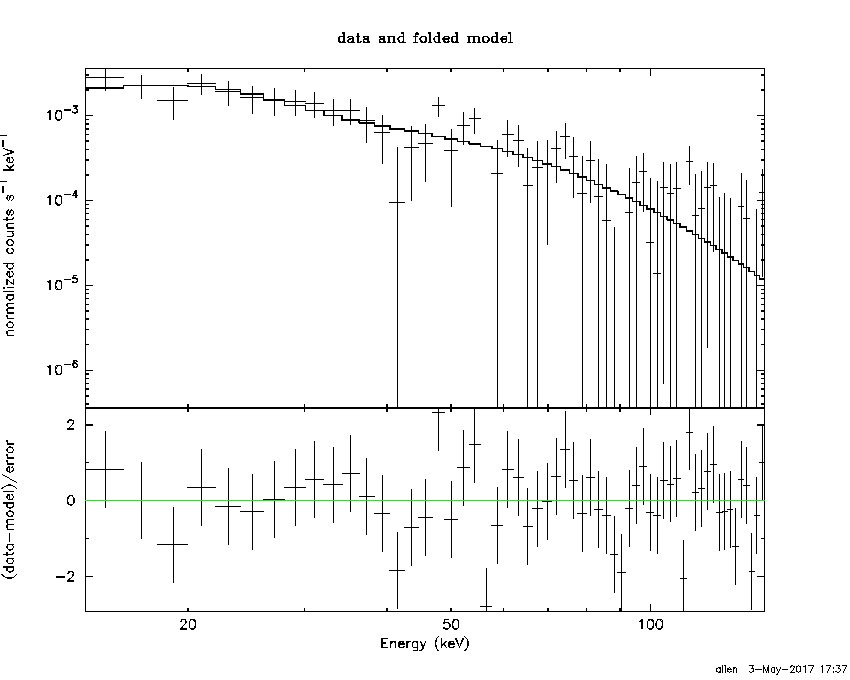
Time interval is from   -0.376 sec. to    8.584 sec.
Spectral model in the cutoff power-law:
------------------------------------------------------------
Parameters  : value       lower 90%   higher 90%
Photon index: -1.70143     ( -0.431479   1.18845 )
Epeak [keV] : 37.9792      ( -35.4881 -37.9799 )
Norm@50keV  : 5.62370E-03    (     )
------------------------------------------------------------
#Fit statistic : Chi-Squared =          52.86 using 59 PHA bins.
# Reduced chi-squared =         0.9439 for     56 degrees of freedom
# Null hypothesis probability =   5.945111e-01

Photon flux (15-150 keV)    in 8.96 sec: 0.545214 ( -0.076473  0.076294 ) ph/cm2/s
Energy fluence (15-150 keV)             : 0 ( 0  0 ) ergs/cm2
1-s peak spectrum fit
Power-law model
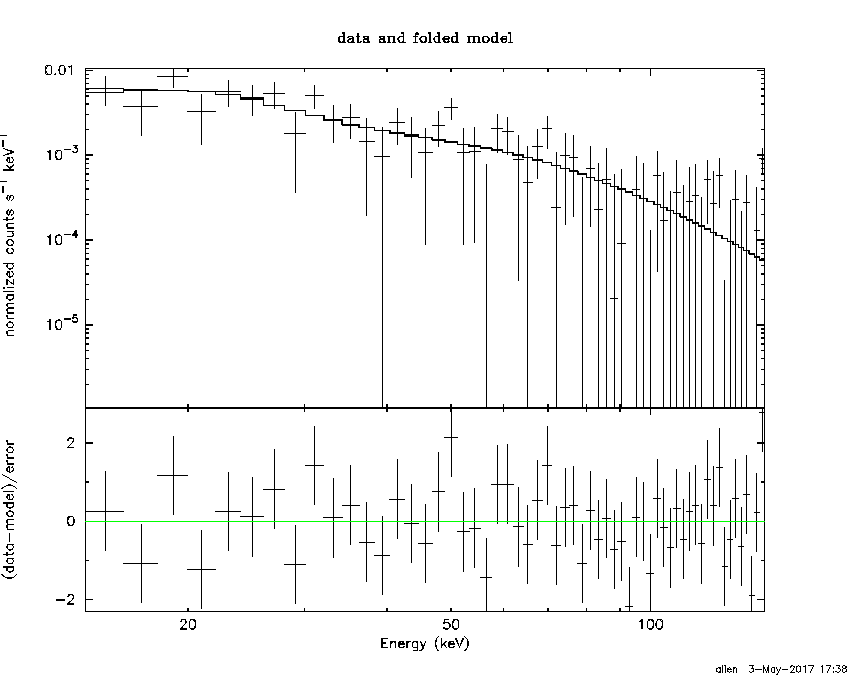
Time interval is from    0.460 sec. to    1.460 sec.

Spectral model in power-law:
------------------------------------------------------------
Parameters  : value       lower 90%   higher 90%
Photon index: -1.91506     ( -0.304743   0.280225 )
Norm@50keV  : 1.00803E-02    ( -0.00198561   0.00191511 )
------------------------------------------------------------
#Fit statistic : Chi-Squared =          50.26 using 59 PHA bins.
# Reduced chi-squared =         0.8817 for     57 degrees of freedom
# Null hypothesis probability =   7.240580e-01

Photon flux (15-150 keV)    in 1 sec: 1.45607 ( -0.23283  0.2329 ) ph/cm2/s
Energy fluence (15-150 keV)             : 9.27065e-08 ( -1.74403e-08  1.78285e-08 ) ergs/cm2
Cutoff power-law model

Time interval is from    0.460 sec. to    1.460 sec.
Spectral model in the cutoff power-law:
------------------------------------------------------------
Parameters  : value       lower 90%   higher 90%
Photon index: -1.39564     ( -0.782181   1.59647 )
Epeak [keV] : 50.5547      (   )
Norm@50keV  : 1.98453E-02    (     )
------------------------------------------------------------
#Fit statistic : Chi-Squared =          49.79 using 59 PHA bins.
# Reduced chi-squared =         0.8890 for     56 degrees of freedom
# Null hypothesis probability =   7.077547e-01

Photon flux (15-150 keV)    in 1 sec: 1.43300 ( -0.24111  0.23984 ) ph/cm2/s
Energy fluence (15-150 keV)             : 0 ( 0  0 ) ergs/cm2
Time-resolved spectra
Distribution
T90 vs. Hardness ratio plot
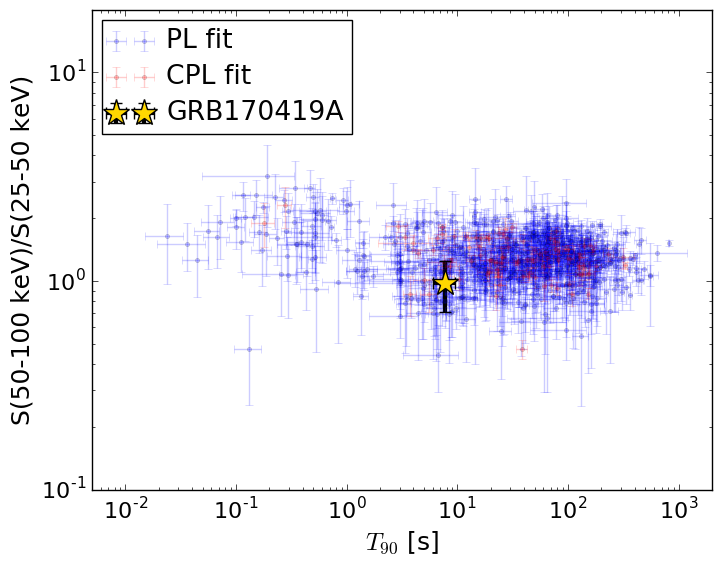
T90                                   = 7.776 sec.
Hardness ratio (energy fluence ratio) = 0.973531994392
S(15-50 keV) vs. S(50-150 keV) plot
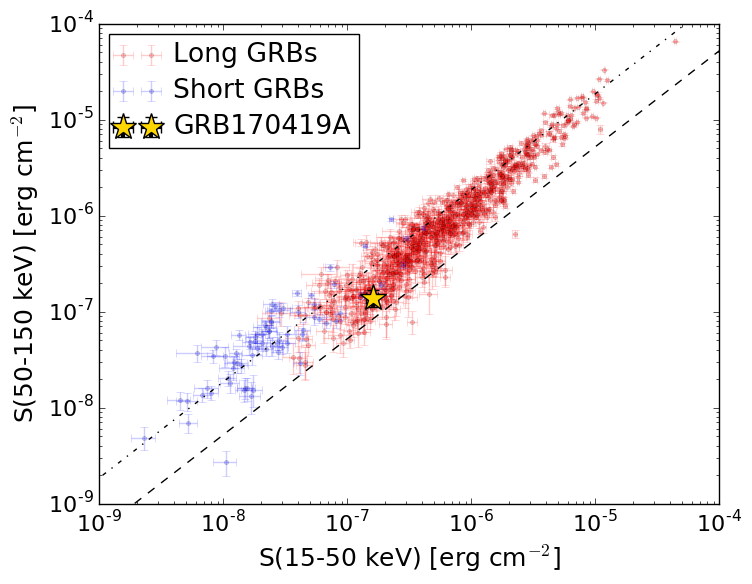
S(15-50 keV)  = 1.5974184e-07
S(50-150 keV) = 1.3939456e-07
The dash-dotted line and the dashed line traces the fluences calculated from the Band function with Epeak = 15 and 150 keV, respectively. Both lines assume a canonical values of alpha = -1 and beta = -2.5.
Mask shadow pattern
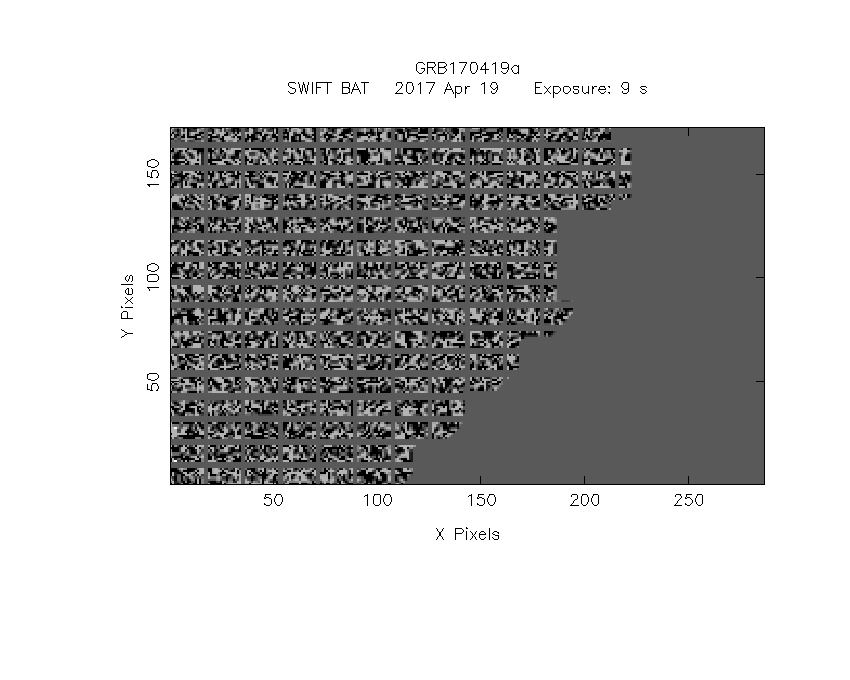
IMX = 8.376373229670094E-01, IMY = -7.353312053587659E-02
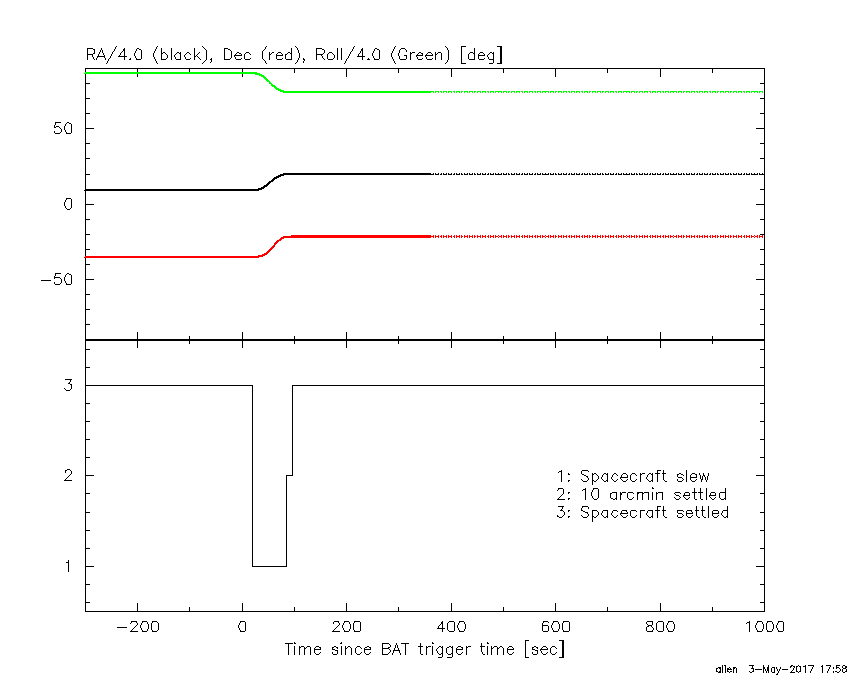
Spacecraft aspect plot
Bright source in the pre-burst/pre-slew/post-slew images
Pre-burst image of 15-350 keV band
Time interval of the image:
-769.835400 -715.356900
-239.136000 -0.376000

# RAcent  DECcent POSerr Theta    Phi  PeakCts   SNR AngSep     Name
#  [deg]    [deg]    ['] [deg]  [deg]                   [']
 69.6355 -61.8594    3.2  33.9   75.6   1.4973   3.6 ------	UNKNOWN
 81.3259  -1.9153    3.0  53.0  -15.4   2.0399   3.9 ------	UNKNOWN
 67.2309  -0.4078    3.6  44.8  -30.8   1.2484   3.2 ------	UNKNOWN
  0.7514  -0.5465    3.5  48.0 -129.1   3.3561   3.3   55.7	UNKNOWN
Pre-slew background subtracted image of 15-350 keV band
Time interval of the image:
-0.376000 8.584000

# RAcent  DECcent POSerr Theta    Phi  PeakCts   SNR AngSep     Name
#  [deg]    [deg]    ['] [deg]  [deg]                   [']
 79.8534 -21.4346    0.8  40.1    5.0   0.6479  14.0 ------	UNKNOWN
 71.4886  -1.3798    2.3  46.7  -25.3   0.2944   5.1 ------	UNKNOWN
339.5288 -14.3546    2.3  55.0 -160.1   0.6980   5.1 ------	UNKNOWN
341.8434  -9.2211    2.0  56.1 -153.4   1.0652   5.7 ------	UNKNOWN
Post-slew image of 15-350 keV band
Time interval of the image:
84.764600 962.894000

# RAcent  DECcent POSerr Theta    Phi  PeakCts   SNR AngSep     Name
#  [deg]    [deg]    ['] [deg]  [deg]                   [']
 83.6310  22.0196    0.4  43.6  -22.2  35.7643  31.0    0.3	Crab
109.2153  25.9792    3.0  55.3    5.2   9.7864   3.9 ------	UNKNOWN
 22.0750 -63.9782    3.8  56.9  179.0  13.9550   3.0 ------	UNKNOWN
 92.8647  11.2536    2.9  35.1   -4.7   3.3898   3.9 ------	UNKNOWN
 37.9362 -32.8217    3.1  38.7 -143.5   4.2829   3.7 ------	UNKNOWN
 29.0834 -34.5063    2.9  46.2 -145.1   6.3945   3.9 ------	UNKNOWN