Analysis Summary
Notes:
- 1) No attempt has been made to eliminate the non-significant decimal places.
- 2) This batgrbproduct analysis is done using the HEASARC data.
- 3) This batgrbproduct analysis is using the flight position for the mask-weighting calculation.
======================================================================
                  BAT GRB EVENT DATA PROCESSING REPORT
    Process Script Ver: batgrbproduct v2.46
    Process Start Time: Wed May  3 17:03:03 EDT 2017
             Host Name: bat1
   Current Working Dir: /local/data/bat1/alien/Swift_3rdBATcatalog/event/batevent_reproc/trigger748947
======================================================================

  Trigger: 00748947      Segment: 000

  BAT Trigger Time: 514330444.992   [s; MET]
      Trigger Stop: 514330446.016   [s; MET]
               UTC: 2017-04-19T21:33:46.057280    [includes UTCF correction]
       Where From?: TDRSS position message

  BAT
    RA: 60.4979072457145   Dec: -15.1426180694188  [deg; J2000]

     Catalogged Source?: NO
     Point Source?:      YES
     GRB Indicated?:     YES    [ by BAT flight software ]
     Image S/N Ratio:    9.51
     Image Trigger?:     NO
     Rate S/N Ratio:     15.6204993518133  [ if not an image trigger ]
     Image S/N Ratio:    9.51

  Analysis Position:   [ source = BAT ]
    RA: 60.4979072457145   Dec: -15.1426180694188  [deg; J2000]

  Refined Position:   [ source = BAT pre-slew burst ]
    RA: 60.4932431992966   Dec: -15.1199588089071  [deg; J2000]
        { 04h 01m 58.4s , -15d 07' 11.9" }
         +/- 1.36949527471954 [arcmin] (estimated 90% radius based on SNR)
         +/- 0.634765071747146 [arcmin] (formal 1-sigma fit error)
    SNR: 19.4102843214075

  Angular difference between the analysis and refined position is 1.386134 arcmin

  Partial Coding Fraction: 0.5234375    [ including projection effects ]

  Duration
     T90: 65.8559999465942 +/- 11.260154565347
        Measured from: 1
                   to: 66.8559999465942     [s; relative to TRIGTIME]
     T50: 29.2199999690056 +/- 7.63655344187067
        Measured from: 3.14399999380112
                   to: 32.3639999628067     [s; relative to TRIGTIME]


  Fluence
     Peak Flux  (peak 1 second)
        Measured from: 1.98400002717972
                   to: 2.98400002717972     [s; relative to TRIGTIME]
     Total Fluence
        Measured from: 0.276000022888184
                   to: 87.2280000448227     [s; relative to TRIGTIME]

             Band 1     Band 2     Band 3     Band 4
              15-25      25-50     50-100    100-350     keV
 Total     0.664453   1.057691   0.917938   0.129125
           0.069700   0.074353   0.066476   0.062439 [error]
 Peak      0.039192   0.090210   0.114874   0.053908
           0.008685   0.009733   0.009796   0.007631 [error]

     [ fluence units of on-axis counts / fully illuminated detector ]

======================================================================


====== Table of the duration information =============================

        Value   tstart    tstop
T100   86.952    0.276   87.228
T90    65.856    1.000   66.856
T50    29.220    3.144   32.364
Peak    1.000    1.984    2.984


====== Spectral Analysis Summary =====================================

Model      : spectral model: simple power-law (PL) and cutoff power-law (CPL)
Ph_index   : photon index: E^{Ph_index}
Ph_90err   : 90% error of the photon index
Epeak      : Epeak in keV
Epeak_90err: 90% error of Epeak
Norm       : normalization at 50 keV in both the PL model and CPL model
Nomr_90err : 90% error of the normalization
chi2       : Chi-Squared
dof        : degree of freedo

=== Time-averaged spectral analysis ===
(Best model with acceptable fit: PL)

Model Ph_index Ph_90err_low Ph_90err_hi  Epeak  Epeak_90err_low  Epeak_90err_hi  Norm       Nomr_90err_low    Norm_90err_hi    chi2    dof
PL      -1.372    -0.130      0.131       -           -               -         2.29e-03     -1.75e-04          1.75e-04      56.330   57
CPL     -0.706    -0.553      0.638       99.333     -26.453       205.875      4.88e-03     -2.24e-03          5.00e-03      52.010   56


=== 1-s peak spectral analysis ===
(Best model with acceptable fit: PL)

Model Ph_index Ph_90err_low Ph_90err_hi  Epeak  Epeak_90err_low  Epeak_90err_hi  Norm       Nomr_90err_low    Norm_90err_hi    chi2    dof
PL      -0.809     -0.173     0.182       -           -               -         2.05e-02     -2.15e-03          2.11e-03      64.500   57
CPL     -0.801     -0.176     0.573     9997.640    -9997.640      -9997.640      2.06e-02     -2.00e-03          1.43e-02      64.510   56


=== Fluence/Peak Flux Summary ===

              Model    Band1     Band2     Band3     Band4     Band5     Total
                       15-25     25-50    50-100    100-350    15-150    15-350    keV
Fluence         PL   2.25e-07  4.47e-07  6.91e-07  2.34e-06  1.93e-06  3.71e-06   erg/cm2
      90%_error_low -3.01e-08 -3.72e-08 -6.57e-08 -4.48e-07 -1.62e-07 -5.00e-07   erg/cm2
      90%_error_hi   3.13e-08  3.70e-08  6.54e-08  5.17e-07  1.63e-07  5.56e-07   erg/cm2
Peak flux       PL   4.36e-01  6.64e-01  7.59e-01  1.65e+00  2.35e+00  3.51e+00   ph/cm2/s
      90%_error_low -9.56e-02 -9.32e-02 -7.43e-02 -3.35e-01 -2.39e-01 -3.74e-01   ph/cm2/s
      90%_error_hi   1.04e-01  9.18e-02  7.40e-02  3.91e-01  2.40e-01  3.90e-01   ph/cm2/s

Fluence        CPL   1.99e-07  4.76e-07  7.22e-07  9.60e-07  1.84e-06  2.36e-06   erg/cm2
      90%_error_low -3.66e-08 -4.50e-08 -7.32e-08 -4.59e-07 -1.81e-07 -4.87e-07   erg/cm2
      90%_error_hi   3.74e-08  4.63e-08  7.45e-08  1.01e-06  1.81e-07  1.01e-06   erg/cm2
Peak flux      CPL   4.35e-01  6.65e-01  7.59e-01  1.64e+00  2.35e+00  3.54e+00   ph/cm2/s
      90%_error_low     N/A       N/A       N/A       N/A       N/A   -7.70e-01   ph/cm2/s
      90%_error_hi      N/A       N/A       N/A       N/A       N/A    3.59e-01   ph/cm2/s

======================================================================
Image
Pre-slew 15.0-350.0 keV image (Event data)
#   RAcent    DECcent   POSerr    Theta     Phi              Peak Cts       SNR   Name
   60.4932   -15.1200   0.0099    35.1842   -38.5996         2.5939648     19.410 TRIG_00748947

Foreground time interval of the image:
  0.276  56.909 (delta_t =  56.633 [sec])
Background time interval of the image:
-239.992   0.276 (delta_t = 240.268 [sec])
Light Curves
Note: The mask-weighted lightcurves have units of either count/det or counts/sec/det, where a det is 0.4 x 0.4 = 0.16 sq cm.
Full-time range; 1 s binning
Other quick-look light curves:
- 64 ms binning (zoomed)
- 16 ms binning (zoomed)
- 8 ms binning (zoomed)
- 2 ms binning (zoomed)
- SN=5 or 10 s binning (full-time range)
- Raw light curve
Spectra
- 64 ms binning (zoomed)
- 16 ms binning (zoomed)
- 8 ms binning (zoomed)
- 2 ms binning (zoomed)
- SN=5 or 10 s binning (full-time range)
- Raw light curve
Spectra
Notes:
- 1) The fitting includes the systematic errors.
- 2) When the burst includes telescope slew time periods, the fitting uses an average response file made from multiple 5-s response files through out the slew time plus single time preiod for the non-slew times, and weighted by the total counts in the corresponding time period using addrmf. An average response file is needed becuase a spectral fit using the pre-slew DRM will introduce some errors in both a spectral shape and a normalization if the PHA file contains a lot of the slew/post-slew time interval.
- 3) For fits to more complicated models (e.g. a power-law over a cutoff power-law), the BAT team has decided to require a chi-square improvement of more than 6 for each extra dof.
Time averaged spectrum fit using the average DRM
Power-law model
Time interval is from    0.276 sec. to   87.228 sec.

Spectral model in power-law:
------------------------------------------------------------
Parameters  : value       lower 90%   higher 90%
Photon index: -1.37166     ( -0.130307   0.130805 )
Norm@50keV  : 2.28536E-03    ( -0.000174851   0.000174705 )
------------------------------------------------------------
#Fit statistic : Chi-Squared =          56.33 using 59 PHA bins.
# Reduced chi-squared =         0.9882 for     57 degrees of freedom
# Null hypothesis probability =   5.001910e-01

Photon flux (15-150 keV)    in 86.95 sec: 0.276581 ( -0.021701  0.021739 ) ph/cm2/s
Energy fluence (15-150 keV)             : 1.93179e-06 ( -1.62045e-07  1.63242e-07 ) ergs/cm2
Cutoff power-law model
Time interval is from    0.276 sec. to   87.228 sec.
Spectral model in the cutoff power-law:
------------------------------------------------------------
Parameters  : value       lower 90%   higher 90%
Photon index: -0.706223     ( -0.552629   0.637726 )
Epeak [keV] : 99.3333      ( -26.4529 205.875 )
Norm@50keV  : 4.87690E-03    ( -0.0022378   0.00500094 )
------------------------------------------------------------
#Fit statistic : Chi-Squared =          52.01 using 59 PHA bins.
# Reduced chi-squared =         0.9288 for     56 degrees of freedom
# Null hypothesis probability =   6.264913e-01

Photon flux (15-150 keV)    in 86.95 sec: 0.268384 ( -0.022855  0.022802 ) ph/cm2/s
Energy fluence (15-150 keV)             : 1.83886e-06 ( -1.80957e-07  1.81316e-07 ) ergs/cm2
1-s peak spectrum fit
Power-law model
Time interval is from    1.984 sec. to    2.984 sec.

Spectral model in power-law:
------------------------------------------------------------
Parameters  : value       lower 90%   higher 90%
Photon index: -0.808829     ( -0.173414   0.181911 )
Norm@50keV  : 2.04680E-02    ( -0.00214991   0.0021139 )
------------------------------------------------------------
#Fit statistic : Chi-Squared =          64.50 using 59 PHA bins.
# Reduced chi-squared =          1.132 for     57 degrees of freedom
# Null hypothesis probability =   2.310546e-01

Photon flux (15-150 keV)    in 1 sec: 2.35171 ( -0.23927  0.24036 ) ph/cm2/s
Energy fluence (15-150 keV)             : 2.38325e-07 ( -2.39718e-08  2.40183e-08 ) ergs/cm2
Cutoff power-law model
Time interval is from    1.984 sec. to    2.984 sec.
Spectral model in the cutoff power-law:
------------------------------------------------------------
Parameters  : value       lower 90%   higher 90%
Photon index: -0.800945     ( -0.175457   0.572752 )
Epeak [keV] : 9997.64      ( -9998.23 -9998.23 )
Norm@50keV  : 2.05945E-02    ( -0.00201415   0.0143313 )
------------------------------------------------------------
#Fit statistic : Chi-Squared =          64.51 using 59 PHA bins.
# Reduced chi-squared =          1.152 for     56 degrees of freedom
# Null hypothesis probability =   2.035585e-01

Photon flux (15-150 keV)    in 1 sec: 2.35490 (    ) ph/cm2/s
Energy fluence (15-150 keV)             : 2.3877e-07 ( -2.82953e-08  2.46144e-08 ) ergs/cm2
Time-resolved spectra
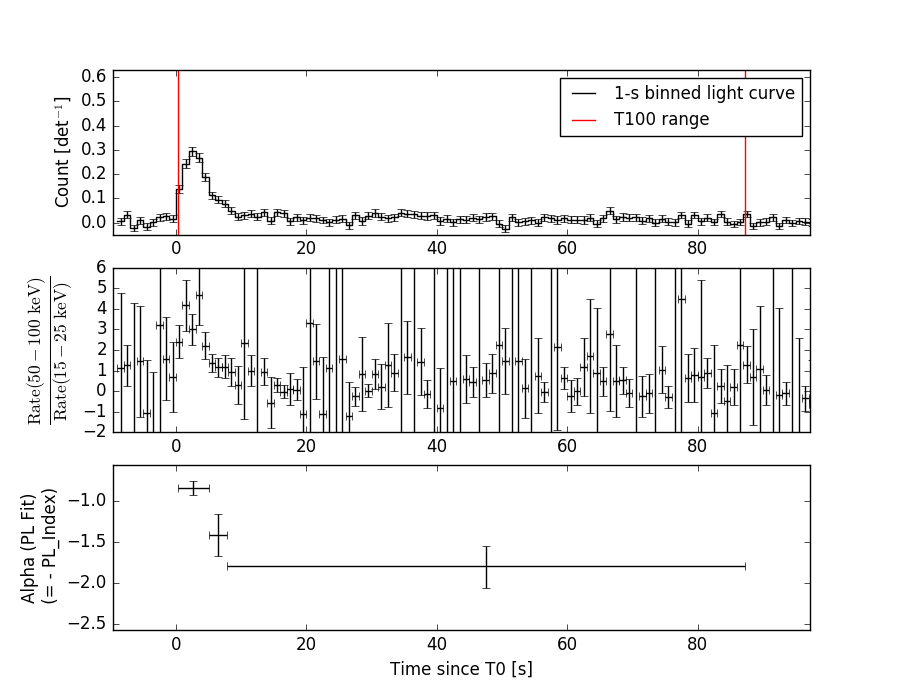
Distribution
T90 vs. Hardness ratio plot
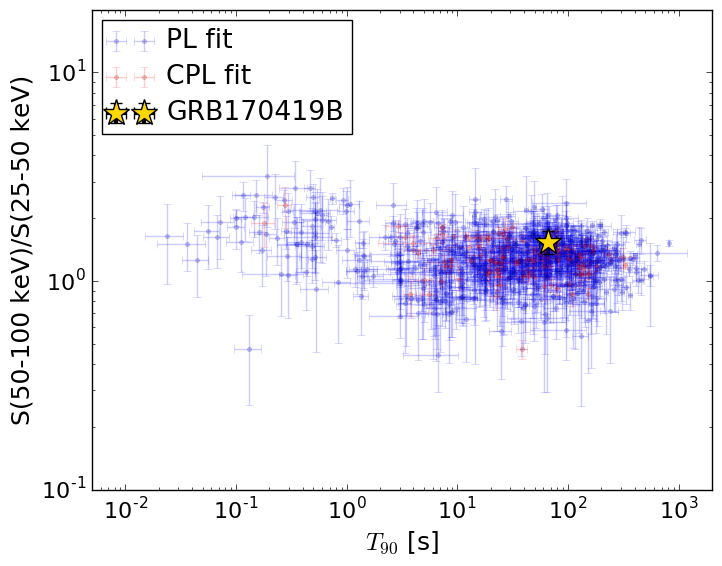
T90                                   = 65.856 sec.
Hardness ratio (energy fluence ratio) = 1.54582389415
S(15-50 keV) vs. S(50-150 keV) plot
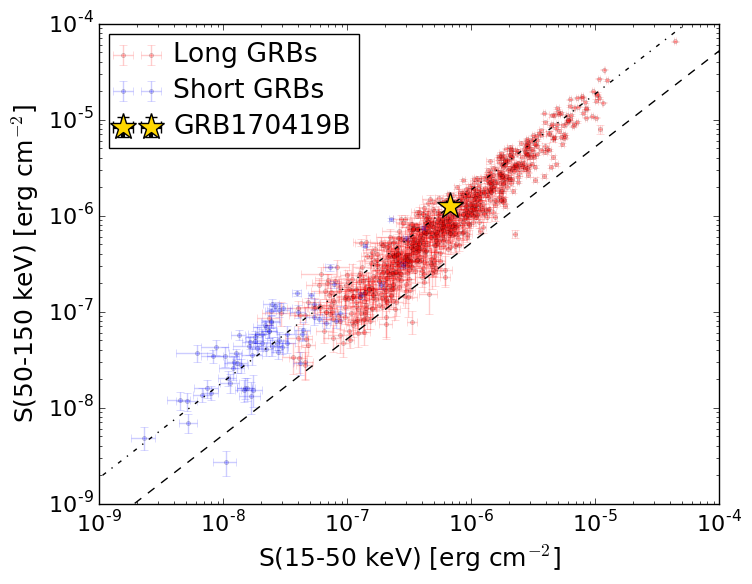
S(15-50 keV)  = 6.722528e-07
S(50-150 keV) = 1.2595271e-06
The dash-dotted line and the dashed line traces the fluences calculated from the Band function with Epeak = 15 and 150 keV, respectively. Both lines assume a canonical values of alpha = -1 and beta = -2.5.
Mask shadow pattern
IMX = 5.509820165708345E-01, IMY = 4.398373453890435E-01
Spacecraft aspect plot
Bright source in the pre-burst/pre-slew/post-slew images
Pre-burst image of 15-350 keV band
Time interval of the image:
-239.992000 0.276000

# RAcent  DECcent POSerr Theta    Phi  PeakCts   SNR AngSep     Name
#  [deg]    [deg]    ['] [deg]  [deg]                   [']
316.2088 -53.5929    3.0  52.5  161.8   3.4821   3.8 ------	UNKNOWN
 89.9250 -12.8635    2.8  51.4   -3.4   1.7095   4.1 ------	UNKNOWN
Pre-slew background subtracted image of 15-350 keV band
Time interval of the image:
0.276000 56.908590

# RAcent  DECcent POSerr Theta    Phi  PeakCts   SNR AngSep     Name
#  [deg]    [deg]    ['] [deg]  [deg]                   [']
333.3822 -74.2691    2.7  39.6  137.2   0.8500   4.3 ------	UNKNOWN
 89.4393 -21.0057    1.9  44.9    3.2   0.9032   6.0 ------	UNKNOWN
 60.4932 -15.1200    0.6  35.2  -38.6   2.5934  19.4 ------	UNKNOWN
Post-slew image of 15-350 keV band
Time interval of the image:
202.508600 302.138000

# RAcent  DECcent POSerr Theta    Phi  PeakCts   SNR AngSep     Name
#  [deg]    [deg]    ['] [deg]  [deg]                   [']
 83.6028  21.9275    9.8  29.6 -107.0   1.7651   1.2    5.5	Crab
172.2524  43.5636    2.2  46.5   47.9  18.0227   5.3 ------	UNKNOWN
127.4978  39.4218    3.5  13.6   34.4   2.9610   3.3 ------	UNKNOWN
116.2877   0.2826    2.9  29.8  169.5   4.1625   3.9 ------	UNKNOWN
104.9274 -10.0883    4.0  41.4 -173.0   4.2258   2.9 ------	UNKNOWN
 86.0805 -16.8578    3.3  54.8 -153.7  15.9539   3.5 ------	UNKNOWN
 75.0917  24.9717    3.6  36.0  -96.8   6.7542   3.2 ------	UNKNOWN
 75.5424   0.5438    2.7  48.0 -129.1  18.1140   4.3 ------	UNKNOWN