Analysis Summary
Notes:
- 1) No attempt has been made to eliminate the non-significant decimal places.
- 2) This batgrbproduct analysis is done using the HEASARC data.
- 3) This batgrbproduct analysis is using the flight position for the mask-weighting calculation.
======================================================================
                  BAT GRB EVENT DATA PROCESSING REPORT
    Process Script Ver: batgrbproduct v2.46
    Process Start Time: Wed Jun  7 13:22:45 EDT 2017
             Host Name: bat1
   Current Working Dir: /local/data/bat1/alien/Swift_3rdBATcatalog/event/batevent_reproc/trigger753110
======================================================================

  Trigger: 00753110      Segment: 000

  BAT Trigger Time: 516631779.648   [s; MET]
      Trigger Stop: 516631780.672   [s; MET]
               UTC: 2017-05-16T12:49:20.579320    [includes UTCF correction]
       Where From?: TDRSS position message

  BAT
    RA: 41.5980442407554   Dec: -55.8987916334193  [deg; J2000]

     Catalogged Source?: NO
     Point Source?:      YES
     GRB Indicated?:     YES    [ by BAT flight software ]
     Image S/N Ratio:    7.32
     Image Trigger?:     NO
     Rate S/N Ratio:     10.295630140987  [ if not an image trigger ]
     Image S/N Ratio:    7.32

  Analysis Position:   [ source = BAT ]
    RA: 41.5980442407554   Dec: -55.8987916334193  [deg; J2000]

  Refined Position:   [ source = BAT pre-slew burst ]
    RA: 41.5414668530012   Dec: -55.9318403631197  [deg; J2000]
        { 02h 46m 10.0s , -55d 55' 54.6" }
         +/- 1.54622779726313 [arcmin] (estimated 90% radius based on SNR)
         +/- 0.736851864498211 [arcmin] (formal 1-sigma fit error)
    SNR: 16.320283523327

  Angular difference between the analysis and refined position is 2.747941 arcmin

  Partial Coding Fraction: 0.6796875    [ including projection effects ]

  Duration
     T90: 36.7680000066757 +/- 11.6178620823879
        Measured from: -12.9120000004768
                   to: 23.8560000061989     [s; relative to TRIGTIME]
     T50: 15.5680000185966 +/- 1.63935601293961
        Measured from: 1.64800000190735
                   to: 17.216000020504     [s; relative to TRIGTIME]


  Fluence
     Peak Flux  (peak 1 second)
        Measured from: 1.26800000667572
                   to: 2.26800000667572     [s; relative to TRIGTIME]
     Total Fluence
        Measured from: -19.8560000061989
                   to: 31.216000020504     [s; relative to TRIGTIME]

             Band 1     Band 2     Band 3     Band 4
              15-25      25-50     50-100    100-350     keV
 Total     1.030791   0.797281   0.188236   0.017510
           0.049323   0.049744   0.042379   0.036652 [error]
 Peak      0.070997   0.057215   0.009499   0.005822
           0.007881   0.007658   0.006357   0.004969 [error]

     [ fluence units of on-axis counts / fully illuminated detector ]

======================================================================


====== Table of the duration information =============================

        Value   tstart    tstop
T100   51.072  -19.856   31.216
T90    36.768  -12.912   23.856
T50    15.568    1.648   17.216
Peak    1.000    1.268    2.268


====== Spectral Analysis Summary =====================================

Model      : spectral model: simple power-law (PL) and cutoff power-law (CPL)
Ph_index   : photon index: E^{Ph_index}
Ph_90err   : 90% error of the photon index
Epeak      : Epeak in keV
Epeak_90err: 90% error of Epeak
Norm       : normalization at 50 keV in both the PL model and CPL model
Nomr_90err : 90% error of the normalization
chi2       : Chi-Squared
dof        : degree of freedo

=== Time-averaged spectral analysis ===
(Best model with acceptable fit: PL)

Model Ph_index Ph_90err_low Ph_90err_hi  Epeak  Epeak_90err_low  Epeak_90err_hi  Norm       Nomr_90err_low    Norm_90err_hi    chi2    dof
PL      -2.671    -0.172      0.162       -           -               -         1.78e-03     -2.22e-04          2.22e-04      48.010   57
CPL     -1.146    -0.674      1.093       18.951     -18.250         6.535      1.72e-02     -1.72e-02          7.40e-02      37.930   56


=== 1-s peak spectral analysis ===
(Best model with acceptable fit: N/A)

Model Ph_index Ph_90err_low Ph_90err_hi  Epeak  Epeak_90err_low  Epeak_90err_hi  Norm       Nomr_90err_low    Norm_90err_hi    chi2    dof
PL      -2.695     -0.358     0.310       -           -               -         5.97e-03     -1.61e-03          1.64e-03      75.340   57
CPL     -0.666     -1.276     2.272       21.378      N/A           N/A         1.34e-01        N/A               N/A         71.270   56


=== Fluence/Peak Flux Summary ===

              Model    Band1     Band2     Band3     Band4     Band5     Total
                       15-25     25-50    50-100    100-350    15-150    15-350    keV
Fluence         PL   3.52e-07  3.21e-07  2.01e-07  1.93e-07  9.55e-07  1.07e-06   erg/cm2
      90%_error_low -3.28e-08 -2.67e-08 -3.34e-08 -5.44e-08 -8.11e-08 -1.09e-07   erg/cm2
      90%_error_hi   3.33e-08  2.65e-08  3.54e-08  6.83e-08  8.28e-08  1.18e-07   erg/cm2
Peak flux       PL   7.85e-01  3.94e-01  1.22e-01  4.79e-02  1.33e+00  1.35e+00   ph/cm2/s
      90%_error_low -1.36e-01 -7.01e-02 -4.05e-02 -2.38e-02 -1.96e-01 -2.01e-01   ph/cm2/s
      90%_error_hi   1.38e-01  6.81e-02  4.53e-02  3.59e-02  1.96e-01  2.01e-01   ph/cm2/s

Fluence        CPL   3.30e-07  3.60e-07  1.41e-07  1.51e-08  8.45e-07  8.47e-07   erg/cm2
      90%_error_low -3.66e-08 -3.47e-08 -4.77e-08    N/A    -8.16e-08 -8.29e-08   erg/cm2
      90%_error_hi   3.65e-08  3.53e-08  5.09e-08    N/A     9.06e-08  9.91e-08   erg/cm2
Peak flux      CPL     N/A      N/A      N/A      N/A      N/A      N/A     ph/cm2/s
      90%_error_low -1.36e-01 -7.01e-02 -4.05e-02 -2.38e-02 -1.96e-01 -2.01e-01   ph/cm2/s
      90%_error_hi   1.38e-01  6.81e-02  4.53e-02  3.59e-02  1.96e-01  2.01e-01   ph/cm2/s

======================================================================
Image
Pre-slew 15.0-350.0 keV image (Event data)
#   RAcent    DECcent   POSerr    Theta     Phi              Peak Cts       SNR   Name
   41.5415   -55.9318   0.0118    29.3730    26.1962         1.2339635     16.320 TRIG_00753110

Foreground time interval of the image:
-19.856  12.053 (delta_t =  31.909 [sec])
Background time interval of the image:
-239.648 -19.856 (delta_t = 219.792 [sec])
Light Curves
Note: The mask-weighted lightcurves have units of either count/det or counts/sec/det, where a det is 0.4 x 0.4 = 0.16 sq cm.
Full-time range; 1 s binning
Other quick-look light curves:
- 64 ms binning (zoomed)
- 16 ms binning (zoomed)
- 8 ms binning (zoomed)
- 2 ms binning (zoomed)
- SN=5 or 10 s binning (full-time range)
- Raw light curve
Spectra
- 64 ms binning (zoomed)
- 16 ms binning (zoomed)
- 8 ms binning (zoomed)
- 2 ms binning (zoomed)
- SN=5 or 10 s binning (full-time range)
- Raw light curve
Spectra
Notes:
- 1) The fitting includes the systematic errors.
- 2) When the burst includes telescope slew time periods, the fitting uses an average response file made from multiple 5-s response files through out the slew time plus single time preiod for the non-slew times, and weighted by the total counts in the corresponding time period using addrmf. An average response file is needed becuase a spectral fit using the pre-slew DRM will introduce some errors in both a spectral shape and a normalization if the PHA file contains a lot of the slew/post-slew time interval.
- 3) For fits to more complicated models (e.g. a power-law over a cutoff power-law), the BAT team has decided to require a chi-square improvement of more than 6 for each extra dof.
Time averaged spectrum fit using the average DRM
Power-law model
Time interval is from  -19.856 sec. to   31.216 sec.

Spectral model in power-law:
------------------------------------------------------------
Parameters  : value       lower 90%   higher 90%
Photon index: -2.67082     ( -0.171795   0.162302 )
Norm@50keV  : 1.77547E-03    ( -0.000221512   0.000221912 )
------------------------------------------------------------
#Fit statistic : Chi-Squared =          48.01 using 59 PHA bins.
# Reduced chi-squared =         0.8423 for     57 degrees of freedom
# Null hypothesis probability =   7.959120e-01

Photon flux (15-150 keV)    in 51.07 sec: 0.388775 ( -0.028559  0.028567 ) ph/cm2/s
Energy fluence (15-150 keV)             : 9.55223e-07 ( -8.1114e-08  8.28207e-08 ) ergs/cm2
Cutoff power-law model
Time interval is from  -19.856 sec. to   31.216 sec.
Spectral model in the cutoff power-law:
------------------------------------------------------------
Parameters  : value       lower 90%   higher 90%
Photon index: -1.14606     ( -0.673546   1.09289 )
Epeak [keV] : 18.9511      ( -18.2501 6.53538 )
Norm@50keV  : 1.71562E-02    ( -0.0171562   0.074001 )
------------------------------------------------------------
#Fit statistic : Chi-Squared =          37.93 using 59 PHA bins.
# Reduced chi-squared =         0.6772 for     56 degrees of freedom
# Null hypothesis probability =   9.693693e-01

Photon flux (15-150 keV)    in 51.07 sec: 0.369905 ( -0.029808  0.029953 ) ph/cm2/s
Energy fluence (15-150 keV)             : 8.45076e-07 ( -8.15991e-08  9.06441e-08 ) ergs/cm2
1-s peak spectrum fit
Power-law model
Time interval is from    1.268 sec. to    2.268 sec.

Spectral model in power-law:
------------------------------------------------------------
Parameters  : value       lower 90%   higher 90%
Photon index: -2.69494     ( -0.357563   0.310306 )
Norm@50keV  : 5.96856E-03    ( -0.0016134   0.00163597 )
------------------------------------------------------------
#Fit statistic : Chi-Squared =          75.34 using 59 PHA bins.
# Reduced chi-squared =          1.322 for     57 degrees of freedom
# Null hypothesis probability =   5.231707e-02

Photon flux (15-150 keV)    in 1 sec: 1.32786 ( -0.1962  0.19629 ) ph/cm2/s
Energy fluence (15-150 keV)             : 6.34001e-08 ( -1.15929e-08  1.21526e-08 ) ergs/cm2
Cutoff power-law model
Time interval is from    1.268 sec. to    2.268 sec.
Spectral model in the cutoff power-law:
------------------------------------------------------------
Parameters  : value       lower 90%   higher 90%
Photon index: -0.66636     ( -1.27614   2.2724 )
Epeak [keV] : 21.3783      (   )
Norm@50keV  : 0.134283    (     )
------------------------------------------------------------
#Fit statistic : Chi-Squared =          71.27 using 59 PHA bins.
# Reduced chi-squared =          1.273 for     56 degrees of freedom
# Null hypothesis probability =   8.215159e-02

Photon flux (15-150 keV)    in 1 sec:  (    ) ph/cm2/s
Energy fluence (15-150 keV)             : 0 ( 0  0 ) ergs/cm2
Time-resolved spectra
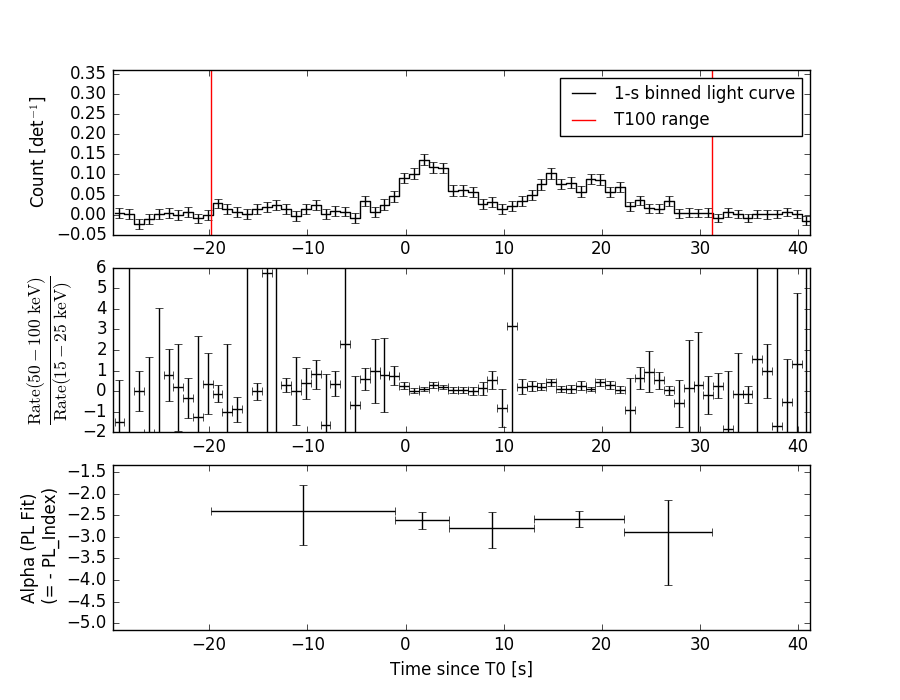
Distribution
T90 vs. Hardness ratio plot
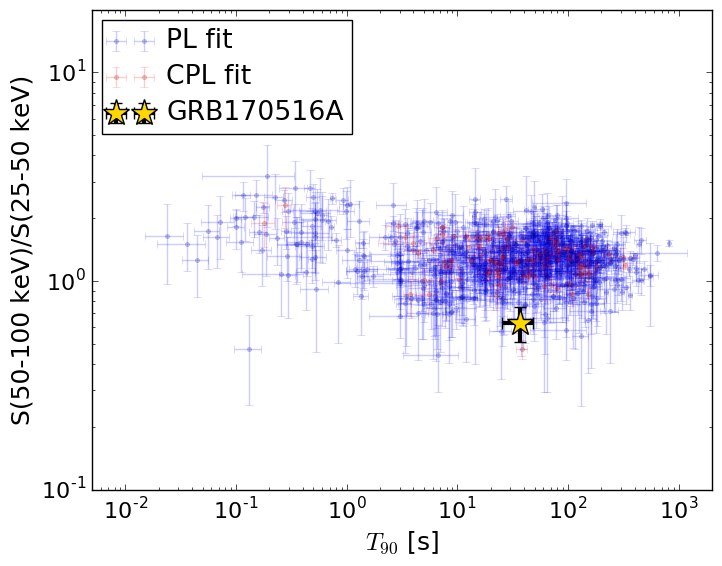
T90                                   = 36.768 sec.
Hardness ratio (energy fluence ratio) = 0.628217387628
S(15-50 keV) vs. S(50-150 keV) plot
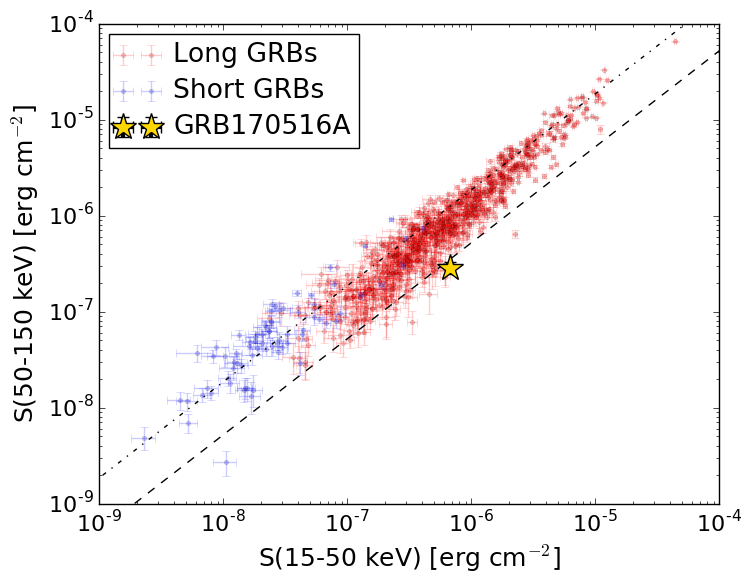
S(15-50 keV)  = 6.728792e-07
S(50-150 keV) = 2.8236506e-07
The dash-dotted line and the dashed line traces the fluences calculated from the Band function with Epeak = 15 and 150 keV, respectively. Both lines assume a canonical values of alpha = -1 and beta = -2.5.
Mask shadow pattern
IMX = 5.050395590385686E-01, IMY = -2.484686641430191E-01
Spacecraft aspect plot
Bright source in the pre-burst/pre-slew/post-slew images
Pre-burst image of 15-350 keV band
Time interval of the image:
-239.648000 -19.856000

# RAcent  DECcent POSerr Theta    Phi  PeakCts   SNR AngSep     Name
#  [deg]    [deg]    ['] [deg]  [deg]                   [']
333.4923  -8.6104    2.7  51.3  150.3   4.5202   4.3 ------	UNKNOWN
 91.7248 -57.0023    2.9  53.9    8.1   2.5104   4.0 ------	UNKNOWN
 71.4644 -13.1853    3.0  47.1  -52.8   3.6527   3.9 ------	UNKNOWN
Pre-slew background subtracted image of 15-350 keV band
Time interval of the image:
-19.856000 12.052600

# RAcent  DECcent POSerr Theta    Phi  PeakCts   SNR AngSep     Name
#  [deg]    [deg]    ['] [deg]  [deg]                   [']
342.6071  -4.3620    2.2  46.1  161.7   0.8329   5.2 ------	UNKNOWN
 41.5415 -55.9319    0.7  29.4   26.2   1.2340  16.3 ------	UNKNOWN
346.7848   6.7715    2.0  50.6  176.5   1.1083   5.7 ------	UNKNOWN
 40.2956 -33.0327    2.3  14.7  -24.9   0.3103   5.1 ------	UNKNOWN
  4.1510   9.6679    2.2  43.4 -161.7   0.5598   5.3 ------	UNKNOWN
 31.4250  15.3457    2.6  45.4 -122.6   1.1805   4.5 ------	UNKNOWN
Post-slew image of 15-350 keV band
Time interval of the image:
66.452620 484.052610

# RAcent  DECcent POSerr Theta    Phi  PeakCts   SNR AngSep     Name
#  [deg]    [deg]    ['] [deg]  [deg]                   [']
318.6687 -75.1718    3.4  35.1  104.8   2.3621   3.4 ------	UNKNOWN
339.6420 -73.5397    3.8  29.7  108.9   1.4059   3.0 ------	UNKNOWN
 26.9205 -39.5391    3.3  19.0 -138.4   0.9448   3.5 ------	UNKNOWN
106.8566 -23.7343    3.1  56.7  -17.7   4.6040   3.7 ------	UNKNOWN