Analysis Summary
Notes:
- 1) No attempt has been made to eliminate the non-significant decimal places.
- 2) This batgrbproduct analysis is done using the HEASARC data.
- 3) This batgrbproduct analysis is using the flight position for the mask-weighting calculation.
======================================================================
                  BAT GRB EVENT DATA PROCESSING REPORT
    Process Script Ver: batgrbproduct v2.46
    Process Start Time: Wed Jun 21 15:42:25 EDT 2017
             Host Name: bat1
   Current Working Dir: /local/data/bat1/alien/Swift_3rdBATcatalog/event/batevent_reproc/trigger755343
======================================================================

  Trigger: 00755343      Segment: 000

  BAT Trigger Time: 517954072   [s; MET]
      Trigger Stop: 517954136   [s; MET]
               UTC: 2017-05-31T20:07:32.854060    [includes UTCF correction]
       Where From?: TDRSS position message

  BAT
    RA: 121.26141607388   Dec: -14.0329183842728  [deg; J2000]

     Catalogged Source?: NO
     Point Source?:      YES
     GRB Indicated?:     YES    [ by BAT flight software ]
     Image S/N Ratio:    7.14
     Image Trigger?:     YES
     Rate S/N Ratio:     0  [ if not an image trigger ]
     Image S/N Ratio:    7.14

  Analysis Position:   [ source = BAT ]
    RA: 121.26141607388   Dec: -14.0329183842728  [deg; J2000]

  Refined Position:   [ source = BAT pre-slew burst ]
    RA: 121.217595678026   Dec: -14.0162260395099  [deg; J2000]
        { 08h 04m 52.2s , -14d 00' 58.4" }
         +/- 2.38920856447251 [arcmin] (estimated 90% radius based on SNR)
         +/- 1.13621791953754 [arcmin] (formal 1-sigma fit error)
    SNR: 8.76507089210646

  Angular difference between the analysis and refined position is 2.740425 arcmin

  Partial Coding Fraction: 0.9296875    [ including projection effects ]

  Duration
     T90: 32.3039999604225 +/- 7.92819475938395
        Measured from: -9.94800001382828
                   to: 22.3559999465942     [s; relative to TRIGTIME]
     T50: 16.555999994278 +/- 5.74570581899996
        Measured from: -2.68800002336502
                   to: 13.8679999709129     [s; relative to TRIGTIME]


  Fluence
     Peak Flux  (peak 1 second)
        Measured from: -4.31599998474121
                   to: -3.31599998474121     [s; relative to TRIGTIME]
     Total Fluence
        Measured from: -13.244000017643
                   to: 25.7960000038147     [s; relative to TRIGTIME]

             Band 1     Band 2     Band 3     Band 4
              15-25      25-50     50-100    100-350     keV
 Total     0.307406   0.345636   0.391131   0.145723
           0.052694   0.052675   0.047972   0.048472 [error]
 Peak      0.017965   0.015137   0.019821   0.030882
           0.008433   0.008589   0.007881   0.007950 [error]

     [ fluence units of on-axis counts / fully illuminated detector ]

======================================================================


====== Table of the duration information =============================

        Value   tstart    tstop
T100   39.040  -13.244   25.796
T90    32.304   -9.948   22.356
T50    16.556   -2.688   13.868
Peak    1.000   -4.316   -3.316


====== Spectral Analysis Summary =====================================

Model      : spectral model: simple power-law (PL) and cutoff power-law (CPL)
Ph_index   : photon index: E^{Ph_index}
Ph_90err   : 90% error of the photon index
Epeak      : Epeak in keV
Epeak_90err: 90% error of Epeak
Norm       : normalization at 50 keV in both the PL model and CPL model
Nomr_90err : 90% error of the normalization
chi2       : Chi-Squared
dof        : degree of freedo

=== Time-averaged spectral analysis ===
(Best model with acceptable fit: PL)

Model Ph_index Ph_90err_low Ph_90err_hi  Epeak  Epeak_90err_low  Epeak_90err_hi  Norm       Nomr_90err_low    Norm_90err_hi    chi2    dof
PL      -1.217    -0.276      0.280       -           -               -         1.91e-03     -2.59e-04          2.58e-04      57.890   57
CPL     -1.229    -1.611      0.329     9999.360      N/A           N/A         1.91e-03        N/A               N/A         57.920   56


=== 1-s peak spectral analysis ===
(Best model with acceptable fit: N/A)

Model Ph_index Ph_90err_low Ph_90err_hi  Epeak  Epeak_90err_low  Epeak_90err_hi  Norm       Nomr_90err_low    Norm_90err_hi    chi2    dof
PL       0.183     -0.423     2.636       -           -               -         2.84e-03     -2.84e-03          1.02e-03      67.740   57
CPL     -0.097      N/A       N/A        9999.360      N/A           N/A         3.39e-03        N/A               N/A         67.870   56


=== Fluence/Peak Flux Summary ===

              Model    Band1     Band2     Band3     Band4     Band5     Total
                       15-25     25-50    50-100    100-350    15-150    15-350    keV
Fluence         PL   7.29e-08  1.59e-07  2.74e-07  1.09e-06  7.51e-07  1.60e-06   erg/cm2
      90%_error_low -1.96e-08 -2.54e-08 -4.88e-08 -3.94e-07 -1.19e-07 -4.29e-07   erg/cm2
      90%_error_hi   2.14e-08  2.46e-08  4.77e-08  5.41e-07  1.21e-07  5.58e-07   erg/cm2
Peak flux       PL   2.29e-02  6.52e-02  1.52e-01  9.55e-01  4.09e-01  1.17e+00   ph/cm2/s
      90%_error_low -2.29e-02 -6.52e-02 -1.52e-01 -4.01e-01 -4.09e-01 -6.06e-01   ph/cm2/s
      90%_error_hi   1.08e-01  1.09e-01  2.62e-02  2.15e+00  7.42e-02  2.03e+00   ph/cm2/s

Fluence        CPL   7.29e-08  1.60e-07  2.74e-07  1.08e-06  7.50e-07  1.59e-06   erg/cm2
      90%_error_low -1.97e-08 -2.54e-08    N/A       N/A    -1.18e-07 -5.82e-07   erg/cm2
      90%_error_hi   2.14e-08  2.45e-08    N/A       N/A     1.21e-07  4.81e-07   erg/cm2
Peak flux      CPL     N/A      N/A      N/A      N/A      N/A      N/A     ph/cm2/s
      90%_error_low -2.29e-02 -6.52e-02 -1.52e-01 -4.01e-01 -4.09e-01 -6.06e-01   ph/cm2/s
      90%_error_hi   1.08e-01  1.09e-01  2.62e-02  2.15e+00  7.42e-02  2.03e+00   ph/cm2/s

======================================================================
Image
Pre-slew 15.0-350.0 keV image (Event data)
#   RAcent    DECcent   POSerr    Theta     Phi              Peak Cts       SNR   Name
  121.2176   -14.0162   0.0219    16.0180  -132.1513         0.9843636      8.765 TRIG_00755343

Foreground time interval of the image:
-13.244  25.796 (delta_t =  39.040 [sec])
Background time interval of the image:
-119.000 -13.244 (delta_t = 105.756 [sec])
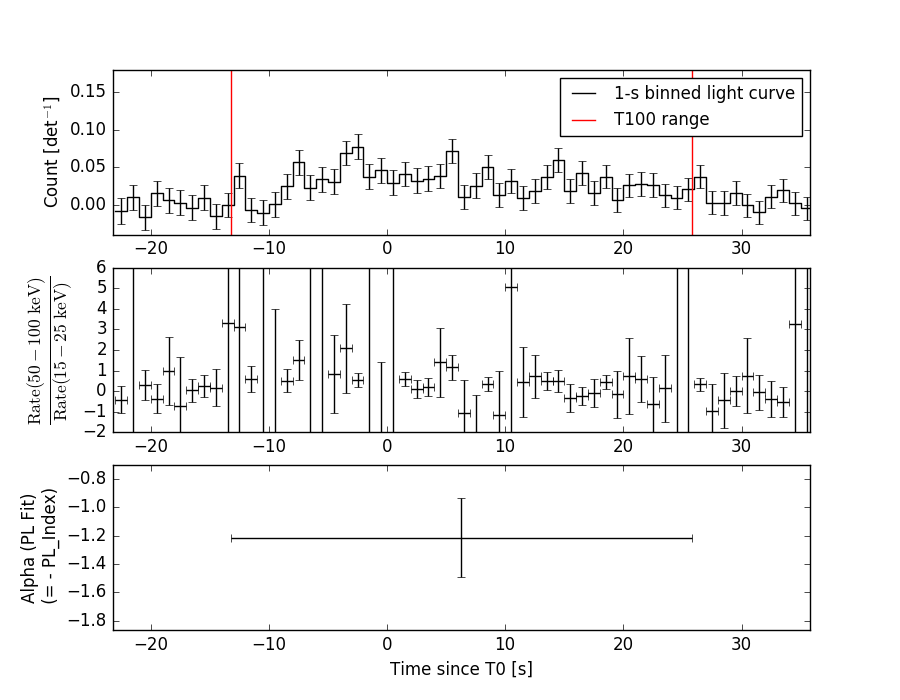
Light Curves
Note: The mask-weighted lightcurves have units of either count/det or counts/sec/det, where a det is 0.4 x 0.4 = 0.16 sq cm.
Full-time range; 1 s binning
Other quick-look light curves:
- 64 ms binning (zoomed)
- 16 ms binning (zoomed)
- 8 ms binning (zoomed)
- 2 ms binning (zoomed)
- SN=5 or 10 s binning (full-time range)
- Raw light curve
Spectra
- 64 ms binning (zoomed)
- 16 ms binning (zoomed)
- 8 ms binning (zoomed)
- 2 ms binning (zoomed)
- SN=5 or 10 s binning (full-time range)
- Raw light curve
Spectra
Notes:
- 1) The fitting includes the systematic errors.
- 2) When the burst includes telescope slew time periods, the fitting uses an average response file made from multiple 5-s response files through out the slew time plus single time preiod for the non-slew times, and weighted by the total counts in the corresponding time period using addrmf. An average response file is needed becuase a spectral fit using the pre-slew DRM will introduce some errors in both a spectral shape and a normalization if the PHA file contains a lot of the slew/post-slew time interval.
- 3) For fits to more complicated models (e.g. a power-law over a cutoff power-law), the BAT team has decided to require a chi-square improvement of more than 6 for each extra dof.
Time averaged spectrum fit using the average DRM
Power-law model
Time interval is from  -13.244 sec. to   25.796 sec.

Spectral model in power-law:
------------------------------------------------------------
Parameters  : value       lower 90%   higher 90%
Photon index: -1.21744     ( -0.275695   0.279872 )
Norm@50keV  : 1.90562E-03    ( -0.000259102   0.000258463 )
------------------------------------------------------------
#Fit statistic : Chi-Squared =          57.89 using 59 PHA bins.
# Reduced chi-squared =          1.016 for     57 degrees of freedom
# Null hypothesis probability =   4.422032e-01

Photon flux (15-150 keV)    in 39.04 sec: 0.224247 ( -0.031114  0.031267 ) ph/cm2/s
Energy fluence (15-150 keV)             : 7.51188e-07 ( -1.18733e-07  1.20819e-07 ) ergs/cm2
Cutoff power-law model
Time interval is from  -13.244 sec. to   25.796 sec.
Spectral model in the cutoff power-law:
------------------------------------------------------------
Parameters  : value       lower 90%   higher 90%
Photon index: -2.14785     ( -0.69212   1.24813 )
Epeak [keV] : 53.3538      (   )
Norm@50keV  : 5.90396E-04    (     )
------------------------------------------------------------
#Fit statistic : Chi-Squared =          56.70 using 59 PHA bins.
# Reduced chi-squared =          1.012 for     56 degrees of freedom
# Null hypothesis probability =   4.488946e-01

Photon flux (15-150 keV)    in 39.04 sec: 0.224226 ( -0.031198  0.031203 ) ph/cm2/s
Energy fluence (15-150 keV)             : 7.50396e-07 ( -1.18377e-07  1.21129e-07 ) ergs/cm2
1-s peak spectrum fit
Power-law model
Time interval is from   -4.316 sec. to   -3.316 sec.

Spectral model in power-law:
------------------------------------------------------------
Parameters  : value       lower 90%   higher 90%
Photon index: 2.10194     ( -2.33913   0.720059 )
Norm@50keV  : 2.86290E-04    ( -0.000290132   0.0035707 )
------------------------------------------------------------
#Fit statistic : Chi-Squared =          65.38 using 59 PHA bins.
# Reduced chi-squared =          1.147 for     57 degrees of freedom
# Null hypothesis probability =   2.087096e-01

Photon flux (15-150 keV)    in 1 sec: 0.408909 ( -0.408909  0.074177 ) ph/cm2/s
Energy fluence (15-150 keV)             : 5.70637e-08 ( -2.15038e-08  2.07991e-08 ) ergs/cm2
Cutoff power-law model
Time interval is from   -4.316 sec. to   -3.316 sec.
Spectral model in the cutoff power-law:
------------------------------------------------------------
Parameters  : value       lower 90%   higher 90%
Photon index: 3.27315     (       )
Epeak [keV] : 9568.00      (   )
Norm@50keV  : 5.39512E-05    (     )
------------------------------------------------------------
#Fit statistic : Chi-Squared =          65.37 using 59 PHA bins.
# Reduced chi-squared =          1.167 for     56 degrees of freedom
# Null hypothesis probability =   1.833258e-01

Photon flux (15-150 keV)    in 1 sec:  (    ) ph/cm2/s
Energy fluence (15-150 keV)             : 5.68617e-08 ( -2.1413e-08  2.06666e-08 ) ergs/cm2
Time-resolved spectra
Distribution
T90 vs. Hardness ratio plot
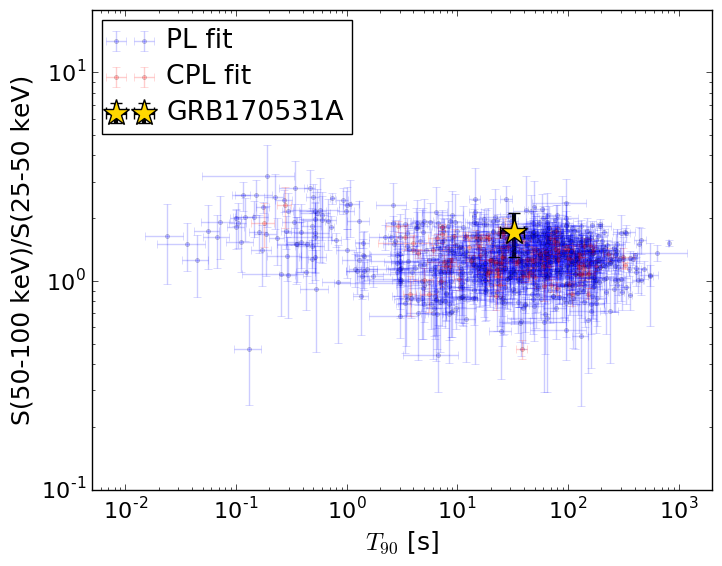
T90                                   = 32.304 sec.
Hardness ratio (energy fluence ratio) = 1.72024396104
S(15-50 keV) vs. S(50-150 keV) plot
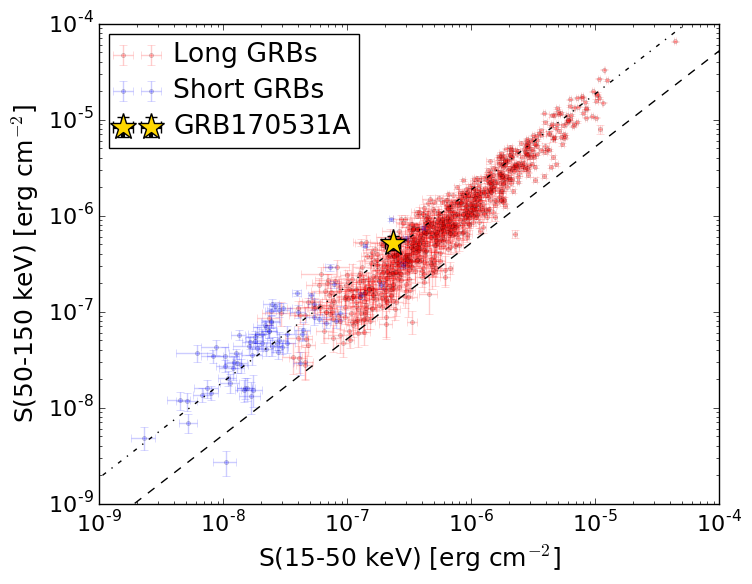
S(15-50 keV)  = 2.3236295e-07
S(50-150 keV) = 5.1883e-07
The dash-dotted line and the dashed line traces the fluences calculated from the Band function with Epeak = 15 and 150 keV, respectively. Both lines assume a canonical values of alpha = -1 and beta = -2.5.
Mask shadow pattern
IMX = -1.926601922337032E-01, IMY = 2.128380030077487E-01
Spacecraft aspect plot
Bright source in the pre-burst/pre-slew/post-slew images
Pre-burst image of 15-350 keV band
Time interval of the image:
-119.000000 -13.244000

# RAcent  DECcent POSerr Theta    Phi  PeakCts   SNR AngSep     Name
#  [deg]    [deg]    ['] [deg]  [deg]                   [']
135.5723 -40.7221   42.6  30.8  156.2  -0.0611  -0.3   10.2	Vela X-1
113.4315 -57.8283    3.1  51.2  169.9   2.3167   3.6 ------	UNKNOWN
115.0679 -50.9821    2.3  44.8  173.6   1.9623   5.0 ------	UNKNOWN
107.4145 -45.2510    2.5  43.5 -175.6   1.4443   4.5 ------	UNKNOWN
105.8199  15.5592    2.8  40.1  -76.8   2.6237   4.1 ------	UNKNOWN
Pre-slew background subtracted image of 15-350 keV band
Time interval of the image:
-13.244000 25.796000

# RAcent  DECcent POSerr Theta    Phi  PeakCts   SNR AngSep     Name
#  [deg]    [deg]    ['] [deg]  [deg]                   [']
135.4460 -40.4819    8.1  30.5  156.4  -0.2070  -1.4    5.8	Vela X-1
179.9939  -6.0312    1.9  42.7   62.1   3.0161   6.2 ------	UNKNOWN
180.1564  -1.5882    2.2  43.6   55.7   2.3158   5.4 ------	UNKNOWN
147.3637   1.7816    2.4  15.6   15.6   0.4970   4.8 ------	UNKNOWN
100.0524 -55.1929    2.8  53.8  179.2   1.7004   4.0 ------	UNKNOWN
121.2176 -14.0162    1.3  16.0 -132.2   0.9843   8.8 ------	UNKNOWN
146.3641  34.0395    2.4  44.9  -15.1   0.8774   4.8 ------	UNKNOWN
 90.7111 -11.1087    2.8  45.5 -121.8   2.0173   4.1 ------	UNKNOWN
Post-slew image of 15-350 keV band
Time interval of the image:
111.500600 288.300600

# RAcent  DECcent POSerr Theta    Phi  PeakCts   SNR AngSep     Name
#  [deg]    [deg]    ['] [deg]  [deg]                   [']
135.6062 -40.4310    4.5  29.2  123.2  -0.9813  -2.6    8.2	Vela X-1
 69.9458 -42.0899    2.9  52.2 -167.0   3.0116   4.0 ------	UNKNOWN
 98.0630   2.0840    2.6  28.1  -90.9   1.5745   4.5 ------	UNKNOWN
 62.7853 -30.2192    2.9  55.9 -151.3   6.0571   4.0 ------	UNKNOWN
116.2696  36.2861    2.9  50.5  -39.4   4.4226   4.0 ------	UNKNOWN
 65.7029 -22.8142    2.4  53.2 -142.3   8.9868   4.8 ------	UNKNOWN