Analysis Summary
Notes:
- 1) No attempt has been made to eliminate the non-significant decimal places.
- 2) This batgrbproduct analysis is done using the HEASARC data.
- 3) This batgrbproduct analysis is using the flight position for the mask-weighting calculation.
======================================================================
                  BAT GRB EVENT DATA PROCESSING REPORT
    Process Script Ver: batgrbproduct v2.46
    Process Start Time: Wed Jun 21 15:37:39 EDT 2017
             Host Name: bat1
   Current Working Dir: /local/data/bat1/alien/Swift_3rdBATcatalog/event/batevent_reproc/trigger755354
======================================================================

  Trigger: 00755354      Segment: 000

  BAT Trigger Time: 517960948.352   [s; MET]
      Trigger Stop: 517960960.512   [s; MET]
               UTC: 2017-05-31T22:02:09.205660    [includes UTCF correction]
       Where From?: TDRSS position message

  BAT
    RA: 286.89460992882   Dec: -16.426493667783  [deg; J2000]

     Catalogged Source?: NO
     Point Source?:      YES
     GRB Indicated?:     YES    [ by BAT flight software ]
     Image S/N Ratio:    9.47
     Image Trigger?:     NO
     Rate S/N Ratio:     10.0498756211209  [ if not an image trigger ]
     Image S/N Ratio:    9.47

  Analysis Position:   [ source = BAT ]
    RA: 286.89460992882   Dec: -16.426493667783  [deg; J2000]

  Refined Position:   [ source = BAT pre-slew burst ]
    RA: 286.899373486008   Dec: -16.4092626199341  [deg; J2000]
        { 19h 07m 35.8s , -16d 24' 33.3" }
         +/- 1.53624884202434 [arcmin] (estimated 90% radius based on SNR)
         +/- 0.679297089129446 [arcmin] (formal 1-sigma fit error)
    SNR: 16.4719384441095

  Angular difference between the analysis and refined position is 1.069596 arcmin

  Partial Coding Fraction: 0.96875    [ including projection effects ]

  Duration
     T90: 170.29599994421 +/- 9.10601472374974
        Measured from: 4.28799998760223
                   to: 174.583999931812     [s; relative to TRIGTIME]
     T50: 134.255999922752 +/- 5.27546206809869
        Measured from: 24.4120000004768
                   to: 158.667999923229     [s; relative to TRIGTIME]


  Fluence
     Peak Flux  (peak 1 second)
        Measured from: 42.7080000042915
                   to: 43.7080000042915     [s; relative to TRIGTIME]
     Total Fluence
        Measured from: 0.240000009536743
                   to: 181.560000002384     [s; relative to TRIGTIME]

             Band 1     Band 2     Band 3     Band 4
              15-25      25-50     50-100    100-350     keV
 Total     1.298644   1.418865   0.771787  -0.051559
           0.098181   0.093015   0.082313   0.083366 [error]
 Peak      0.035764   0.036264   0.019044   0.011116
           0.007999   0.007313   0.006313   0.006375 [error]

     [ fluence units of on-axis counts / fully illuminated detector ]

======================================================================


====== Table of the duration information =============================

        Value   tstart    tstop
T100  181.320    0.240  181.560
T90   170.296    4.288  174.584
T50   134.256   24.412  158.668
Peak    1.000   42.708   43.708


====== Spectral Analysis Summary =====================================

Model      : spectral model: simple power-law (PL) and cutoff power-law (CPL)
Ph_index   : photon index: E^{Ph_index}
Ph_90err   : 90% error of the photon index
Epeak      : Epeak in keV
Epeak_90err: 90% error of Epeak
Norm       : normalization at 50 keV in both the PL model and CPL model
Nomr_90err : 90% error of the normalization
chi2       : Chi-Squared
dof        : degree of freedo

=== Time-averaged spectral analysis ===
(Best model with acceptable fit: PL)

Model Ph_index Ph_90err_low Ph_90err_hi  Epeak  Epeak_90err_low  Epeak_90err_hi  Norm       Nomr_90err_low    Norm_90err_hi    chi2    dof
PL      -1.937    -0.149      0.145       -           -               -         1.15e-03     -1.09e-04          1.08e-04      42.160   57
CPL     -1.216    -0.586      0.682       45.166     -10.771        24.517      2.98e-03     -1.58e-03          4.35e-03      37.570   56


=== 1-s peak spectral analysis ===
(Best model with acceptable fit: PL)

Model Ph_index Ph_90err_low Ph_90err_hi  Epeak  Epeak_90err_low  Epeak_90err_hi  Norm       Nomr_90err_low    Norm_90err_hi    chi2    dof
PL      -1.724     -0.470     0.455       -           -               -         5.57e-03     -1.53e-03          1.46e-03      54.200   57
CPL     -1.731     -0.290     0.466     9999.360      N/A           N/A         5.55e-03        N/A               N/A         54.200   56


=== Fluence/Peak Flux Summary ===

              Model    Band1     Band2     Band3     Band4     Band5     Total
                       15-25     25-50    50-100    100-350    15-150    15-350    keV
Fluence         PL   4.01e-07  5.66e-07  5.91e-07  1.14e-06  1.92e-06  2.69e-06   erg/cm2
      90%_error_low -4.50e-08 -4.34e-08 -7.66e-08 -2.71e-07 -1.75e-07 -3.57e-07   erg/cm2
      90%_error_hi   4.61e-08  4.35e-08  7.81e-08  3.25e-07  1.78e-07  3.99e-07   erg/cm2
Peak flux       PL   2.84e-01  2.51e-01  1.52e-01  1.39e-01  7.46e-01  8.25e-01   ph/cm2/s
      90%_error_low -1.05e-01 -6.00e-02 -5.34e-02 -7.77e-02 -1.77e-01 -1.96e-01   ph/cm2/s
      90%_error_hi   1.13e-01  5.95e-02  5.44e-02  1.28e-01  1.77e-01  1.98e-01   ph/cm2/s

Fluence        CPL   3.75e-07  6.12e-07  5.65e-07  3.44e-07  1.76e-06  1.90e-06   erg/cm2
      90%_error_low -5.09e-08 -5.67e-08 -9.25e-08 -2.04e-07 -1.99e-07 -2.92e-07   erg/cm2
      90%_error_hi   5.12e-08  5.82e-08  8.84e-08  5.28e-07  2.10e-07  5.63e-07   erg/cm2
Peak flux      CPL   2.87e-01  2.48e-01  1.52e-01  1.38e-01  7.50e-01  8.44e-01   ph/cm2/s
      90%_error_low -1.11e-01 -5.91e-02 -5.49e-02     N/A   -1.87e-01 -2.24e-01   ph/cm2/s
      90%_error_hi   1.17e-01  7.22e-02  5.63e-02     N/A    1.77e-01  1.73e-01   ph/cm2/s

======================================================================
Image
Pre-slew 15.0-350.0 keV image (Event data)
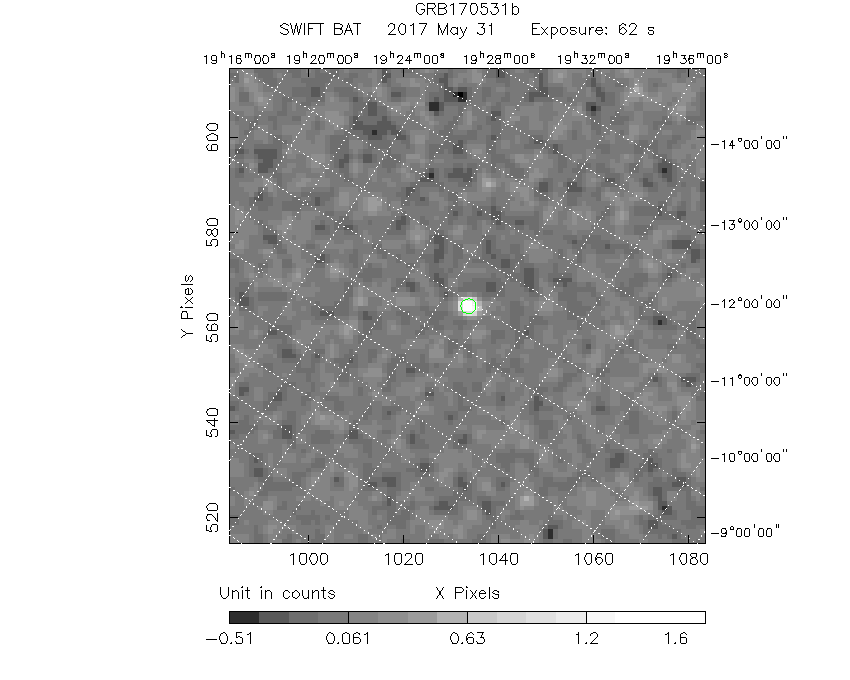
#   RAcent    DECcent   POSerr    Theta     Phi              Peak Cts       SNR   Name
  286.8994   -16.4093   0.0117    20.4338  -150.3150         2.0491415     16.472 TRIG_00755354

Foreground time interval of the image:
  0.240  62.349 (delta_t =  62.109 [sec])
Background time interval of the image:
-512.151 -493.100 (delta_t =  19.052 [sec])
-239.352   0.240 (delta_t = 239.592 [sec])
Light Curves
Note: The mask-weighted lightcurves have units of either count/det or counts/sec/det, where a det is 0.4 x 0.4 = 0.16 sq cm.
Full-time range; 1 s binning
Other quick-look light curves:
- 64 ms binning (zoomed)
- 16 ms binning (zoomed)
- 8 ms binning (zoomed)
- 2 ms binning (zoomed)
- SN=5 or 10 s binning (full-time range)
- Raw light curve
Spectra
- 64 ms binning (zoomed)
- 16 ms binning (zoomed)
- 8 ms binning (zoomed)
- 2 ms binning (zoomed)
- SN=5 or 10 s binning (full-time range)
- Raw light curve
Spectra
Notes:
- 1) The fitting includes the systematic errors.
- 2) When the burst includes telescope slew time periods, the fitting uses an average response file made from multiple 5-s response files through out the slew time plus single time preiod for the non-slew times, and weighted by the total counts in the corresponding time period using addrmf. An average response file is needed becuase a spectral fit using the pre-slew DRM will introduce some errors in both a spectral shape and a normalization if the PHA file contains a lot of the slew/post-slew time interval.
- 3) For fits to more complicated models (e.g. a power-law over a cutoff power-law), the BAT team has decided to require a chi-square improvement of more than 6 for each extra dof.
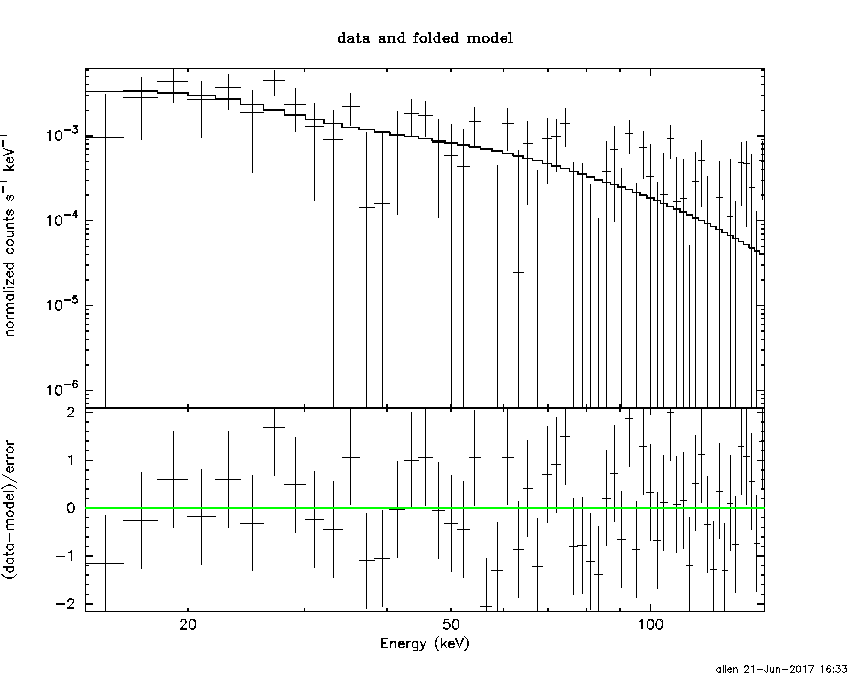
Time averaged spectrum fit using the average DRM
Power-law model
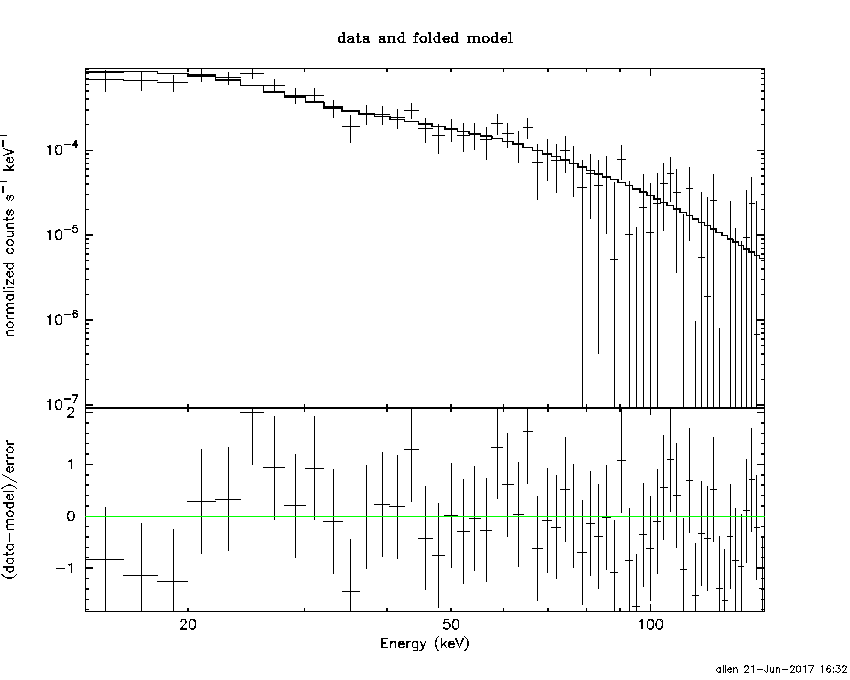
Time interval is from    0.240 sec. to  181.560 sec.

Spectral model in power-law:
------------------------------------------------------------
Parameters  : value       lower 90%   higher 90%
Photon index: -1.93735     ( -0.149438   0.14488 )
Norm@50keV  : 1.14833E-03    ( -0.000109282   0.00010774 )
------------------------------------------------------------
#Fit statistic : Chi-Squared =          42.16 using 59 PHA bins.
# Reduced chi-squared =         0.7397 for     57 degrees of freedom
# Null hypothesis probability =   9.290725e-01

Photon flux (15-150 keV)    in 181.3 sec: 0.167485 ( -0.012934  0.01294 ) ph/cm2/s
Energy fluence (15-150 keV)             : 1.91556e-06 ( -1.75046e-07  1.78492e-07 ) ergs/cm2
Cutoff power-law model
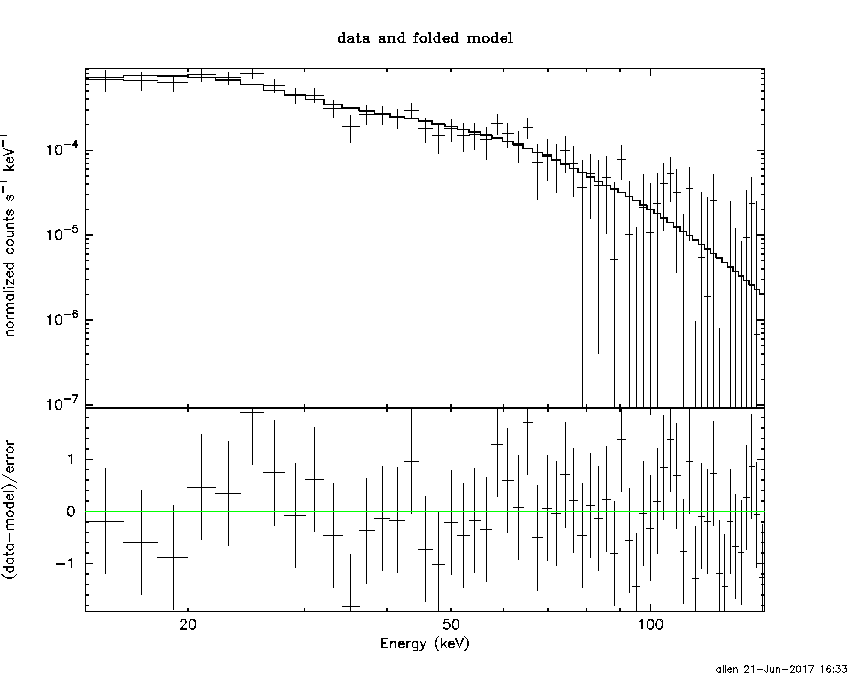
Time interval is from    0.240 sec. to  181.560 sec.
Spectral model in the cutoff power-law:
------------------------------------------------------------
Parameters  : value       lower 90%   higher 90%
Photon index: -1.21562     ( -0.585574   0.6821 )
Epeak [keV] : 45.1658      ( -10.7706 24.5168 )
Norm@50keV  : 2.98146E-03    ( -0.00157951   0.00434873 )
------------------------------------------------------------
#Fit statistic : Chi-Squared =          37.57 using 59 PHA bins.
# Reduced chi-squared =         0.6708 for     56 degrees of freedom
# Null hypothesis probability =   9.723188e-01

Photon flux (15-150 keV)    in 181.3 sec: 0.161710 ( -0.013623  0.013663 ) ph/cm2/s
Energy fluence (15-150 keV)             : 1.76245e-06 ( -1.98558e-07  2.10323e-07 ) ergs/cm2
1-s peak spectrum fit
Power-law model
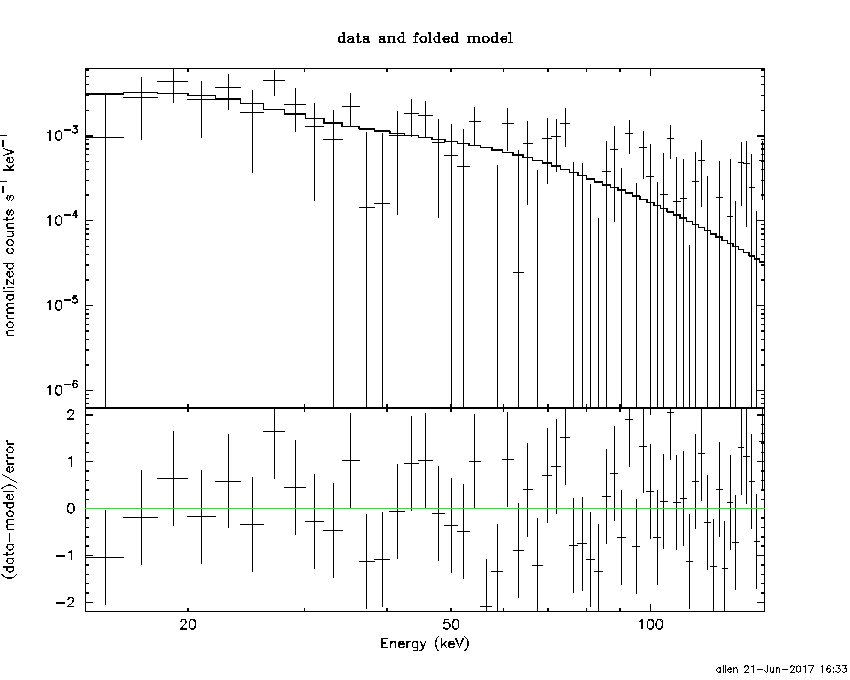
Time interval is from   42.708 sec. to   43.708 sec.

Spectral model in power-law:
------------------------------------------------------------
Parameters  : value       lower 90%   higher 90%
Photon index: -1.72435     ( -0.470371   0.454524 )
Norm@50keV  : 5.56784E-03    ( -0.00152857   0.00146256 )
------------------------------------------------------------
#Fit statistic : Chi-Squared =          54.20 using 59 PHA bins.
# Reduced chi-squared =         0.9509 for     57 degrees of freedom
# Null hypothesis probability =   5.806945e-01

Photon flux (15-150 keV)    in 1 sec: 0.745908 ( -0.176584  0.176925 ) ph/cm2/s
Energy fluence (15-150 keV)             : 5.14671e-08 ( -1.41807e-08  1.48705e-08 ) ergs/cm2
Cutoff power-law model
Time interval is from   42.708 sec. to   43.708 sec.
Spectral model in the cutoff power-law:
------------------------------------------------------------
Parameters  : value       lower 90%   higher 90%
Photon index: -2.01649     ( -0.00502127   0.750696 )
Epeak [keV] : 6.91250      (   )
Norm@50keV  : 3.88046E-03    (     )
------------------------------------------------------------
#Fit statistic : Chi-Squared =          54.14 using 59 PHA bins.
# Reduced chi-squared =         0.9667 for     56 degrees of freedom
# Null hypothesis probability =   5.457509e-01

Photon flux (15-150 keV)    in 1 sec: 0.749671 ( -0.186521  0.177328 ) ph/cm2/s
Energy fluence (15-150 keV)             : 5.19505e-08 ( -1.78532e-08  1.49193e-08 ) ergs/cm2
Time-resolved spectra
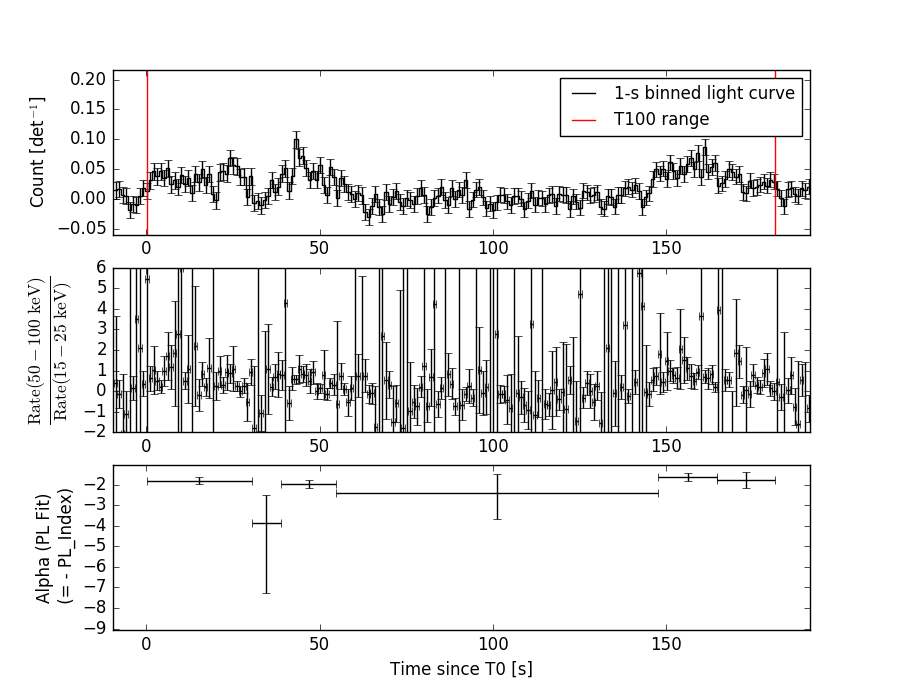
Distribution
T90 vs. Hardness ratio plot
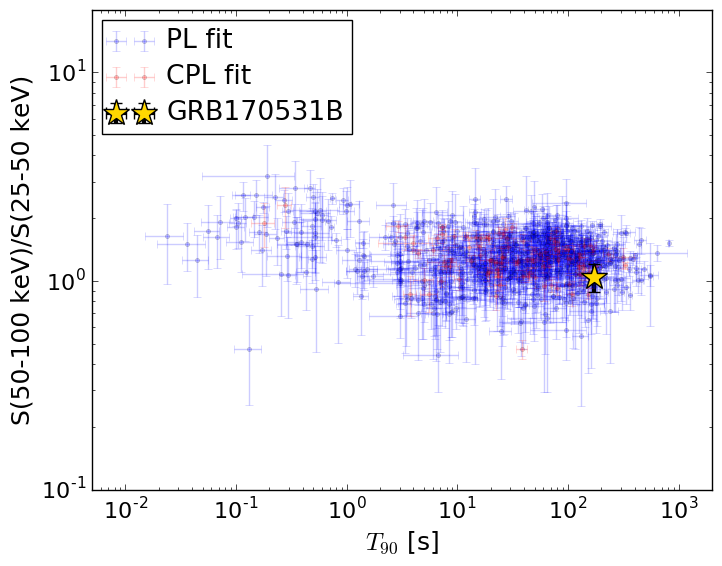
T90                                   = 170.296 sec.
Hardness ratio (energy fluence ratio) = 1.04443139388
S(15-50 keV) vs. S(50-150 keV) plot
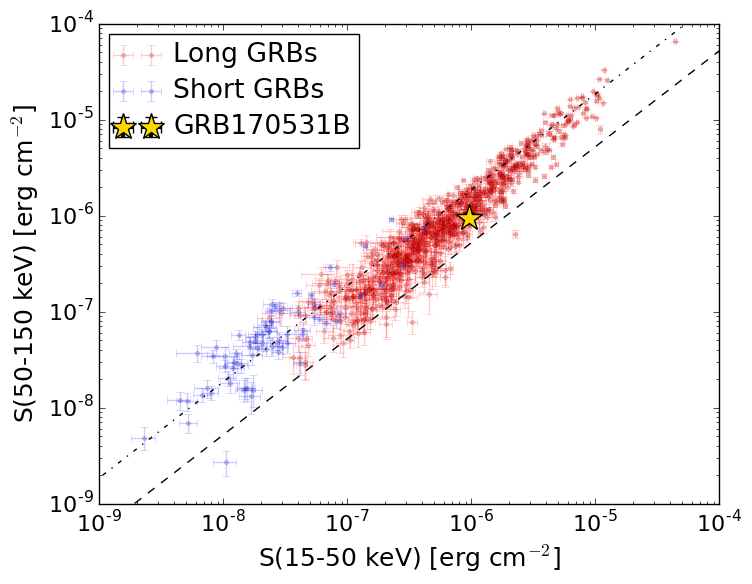
S(15-50 keV)  = 9.671374e-07
S(50-150 keV) = 9.484624e-07
The dash-dotted line and the dashed line traces the fluences calculated from the Band function with Epeak = 15 and 150 keV, respectively. Both lines assume a canonical values of alpha = -1 and beta = -2.5.
Mask shadow pattern
IMX = -3.236722325517952E-01, IMY = 1.845073450929686E-01
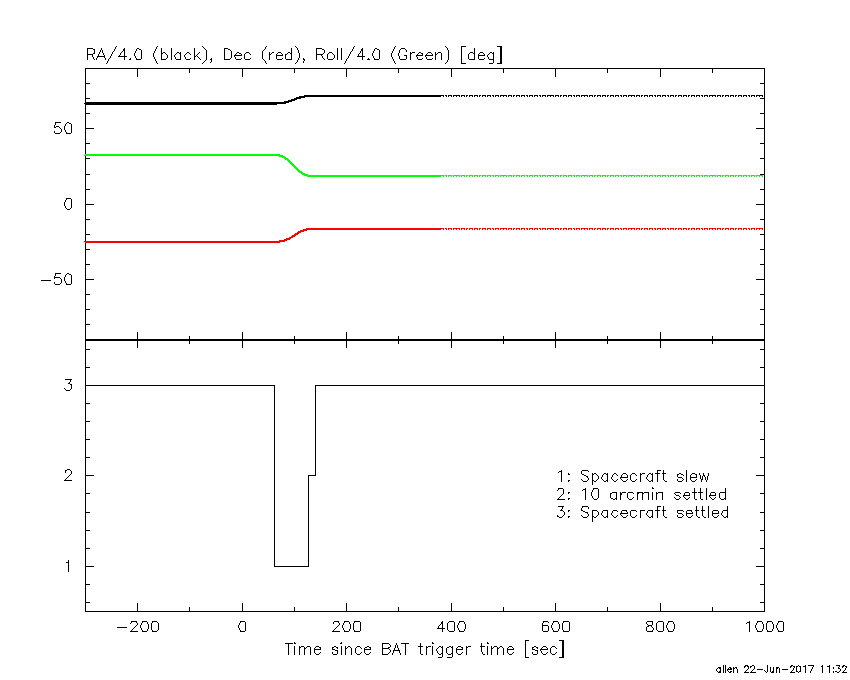
Spacecraft aspect plot
Bright source in the pre-burst/pre-slew/post-slew images
Pre-burst image of 15-350 keV band
Time interval of the image:
-512.151410 -493.099600
-239.352000 0.240000

# RAcent  DECcent POSerr Theta    Phi  PeakCts   SNR AngSep     Name
#  [deg]    [deg]    ['] [deg]  [deg]                   [']
244.9800 -15.6428    0.3  22.5   70.1  17.2208  41.2    0.2	Sco X-1
255.9688 -37.8266    0.7  16.0   -6.7   5.5549  15.6    1.3	4U 1700-377
256.3074 -36.3520    3.4  14.7   -3.9   1.2103   3.4    7.5	GX 349+2
262.9898 -24.7637    2.1   3.6   50.4   1.7567   5.5    1.5	GX 1+4
264.8829 -44.4949    6.9  19.7  -35.4   0.6354   1.7    6.6	4U 1735-44
268.3492  -1.2609    5.2  23.6  143.6  -0.8865  -2.2   11.6	SW J1753.5-0127
270.3356 -25.0755    2.6   3.1 -124.5   1.5195   4.4    2.8	GX 5-1
270.2902 -25.8023    5.7   3.2 -111.2   0.7220   2.0    3.6	GRS 1758-258
273.9780 -14.0208    3.2  12.7  172.9   1.2532   3.6    1.9	GX 17+2
276.0623 -30.2701    6.1   9.7  -93.8   0.6330   1.9    9.2	H1820-303
285.0521 -24.7554    7.8  16.4 -126.2  -0.5221  -1.5    9.9	HT1900.1-2455
288.8209  10.7939    7.9  41.5  173.7   0.8848   1.5    9.2	GRS 1915+105
263.1135 -33.8260   11.8   9.6  -20.2   0.3310   1.0    6.2	GX 354-0
250.0184 -19.2517    3.2  16.7   66.4   1.2616   3.7 ------	UNKNOWN
284.0904  10.0631    3.3  38.7  167.8   1.8744   3.5 ------	UNKNOWN
259.9091 -25.0163    1.0   6.4   47.1   4.0288  11.6 ------	UNKNOWN
294.5620  16.3724    2.4  49.2  176.1   4.2387   4.8 ------	UNKNOWN
224.8963 -53.5194    2.8  42.4   -3.6   2.3767   4.1 ------	UNKNOWN
278.9189 -20.3139    3.1  11.9 -149.7   1.1847   3.7 ------	UNKNOWN
234.1752 -65.2798    2.6  45.5  -21.3   2.6157   4.4 ------	UNKNOWN
303.5279  -6.8955    2.8  39.3 -150.7   2.2466   4.1 ------	UNKNOWN
	UNKNOWN
	UNKNOWN
Pre-slew background subtracted image of 15-350 keV band
Time interval of the image:
0.240000 62.348600

# RAcent  DECcent POSerr Theta    Phi  PeakCts   SNR AngSep     Name
#  [deg]    [deg]    ['] [deg]  [deg]                   [']
244.8197 -15.6763    5.1  22.7   69.8  -0.3434  -2.3    9.5	Sco X-1
255.9348 -37.8083    4.4  16.0   -6.6  -0.3199  -2.6    3.3	4U 1700-377
256.5048 -36.4057   10.0  14.6   -4.5  -0.1437  -1.2    3.5	GX 349+2
263.0009 -24.9392    8.4   3.6   47.7  -0.1703  -1.4   11.6	GX 1+4
264.6485 -44.5485    4.9  19.8  -34.9   0.2986   2.4    7.2	4U 1735-44
268.5326  -1.4818   10.3  23.4  144.1  -0.1652  -1.1   10.0	SW J1753.5-0127
270.5088 -25.0493   97.8   3.2 -125.2  -0.0138  -0.1   12.3	GX 5-1
270.2362 -25.7204   11.6   3.1 -112.4   0.1167   1.0    3.8	GRS 1758-258
274.0362 -13.9069    5.2  12.8  172.8   0.2721   2.2    8.0	GX 17+2
276.0553 -30.4677    6.2   9.8  -92.8  -0.2368  -1.9    9.1	H1820-303
285.0896 -25.1269    0.0  16.4 -124.9  -0.0825  -0.6   12.7	HT1900.1-2455
288.8750  10.8595    5.0  41.6  173.7  -0.4656  -2.3    6.9	GRS 1915+105
262.9486 -33.9422  132.9   9.8  -19.7   0.0104   0.1    6.8	GX 354-0
267.7826 -16.9818    3.0   7.9  145.9   0.4498   3.9 ------	UNKNOWN
286.8994 -16.4092    0.7  20.4 -150.3   2.0490  16.5 ------	UNKNOWN
Post-slew image of 15-350 keV band
Time interval of the image:
127.948600 962.718000

# RAcent  DECcent POSerr Theta    Phi  PeakCts   SNR AngSep     Name
#  [deg]    [deg]    ['] [deg]  [deg]                   [']
244.9814 -15.6765    0.8  40.2  100.2  48.7059  13.7    2.2	Sco X-1
256.0063 -37.8533    1.5  34.6   60.9  12.1913   7.6    1.1	4U 1700-377
256.4904 -36.2948   10.4  33.5   63.0  -1.6071  -1.1    8.1	GX 349+2
263.0177 -24.7545    1.9  23.8   80.9   5.8733   6.2    0.7	GX 1+4
264.6171 -44.3091   19.2  33.6   44.6   0.7156   0.6   10.0	4U 1735-44
268.4522  -1.5810    8.8  23.5  142.6  -1.0844  -1.3    9.2	SW J1753.5-0127
270.2768 -25.1190    2.4  17.8   73.3   3.9542   4.9    2.4	GX 5-1
270.3592 -25.6793    6.4  18.0   71.6   1.6466   2.0    4.9	GRS 1758-258
274.1240 -14.0427    3.2  12.6  114.5   3.2460   3.6    6.9	GX 17+2
275.8547 -30.5121    3.6  17.3   49.0   2.6837   3.2    9.4	H1820-303
284.9402 -25.0970    5.6   8.9   27.0  -1.5684  -2.0   11.8	HT1900.1-2455
288.7859  10.9013    4.5  27.4 -160.8   2.1724   2.6    2.8	GRS 1915+105
299.6168  35.1801    1.4  53.0 -151.8  27.1565   8.6    1.8	Cyg X-1
262.8954 -33.9187    5.6  27.8   61.7   2.1050   2.1    6.9	GX 354-0
259.8829 -25.0239    1.0  26.6   82.0  11.5129  11.0 ------	UNKNOWN
272.4436 -26.4244    4.0  16.8   66.2   2.1104   2.9 ------	UNKNOWN
291.8280 -39.5958    2.6  23.5    5.8   3.2843   4.4 ------	UNKNOWN
314.9822  22.9555    3.2  48.0 -129.1  18.2210   3.6 ------	UNKNOWN
317.7531  17.2576    3.5  45.4 -121.3  15.9537   3.3 ------	UNKNOWN