Analysis Summary
Notes:
- 1) No attempt has been made to eliminate the non-significant decimal places.
- 2) This batgrbproduct analysis is done using the HEASARC data.
- 3) This batgrbproduct analysis is using the flight position for the mask-weighting calculation.
======================================================================
                  BAT GRB EVENT DATA PROCESSING REPORT
    Process Script Ver: batgrbproduct v2.46
    Process Start Time: Wed Jun 21 15:26:01 EDT 2017
             Host Name: bat1
   Current Working Dir: /local/data/bat1/alien/Swift_3rdBATcatalog/event/batevent_reproc/trigger755867
======================================================================

  Trigger: 00755867      Segment: 000

  BAT Trigger Time: 518296149.568   [s; MET]
      Trigger Stop: 518296153.664   [s; MET]
               UTC: 2017-06-04T19:08:50.402040    [includes UTCF correction]
       Where From?: TDRSS position message

  BAT
    RA: 342.645334010525   Dec: -15.4143151566099  [deg; J2000]

     Catalogged Source?: NO
     Point Source?:      YES
     GRB Indicated?:     YES    [ by BAT flight software ]
     Image S/N Ratio:    7.97
     Image Trigger?:     NO
     Rate S/N Ratio:     30.6267856622271  [ if not an image trigger ]
     Image S/N Ratio:    7.97

  Analysis Position:   [ source = BAT ]
    RA: 342.645334010525   Dec: -15.4143151566099  [deg; J2000]

  Refined Position:   [ source = BAT pre-slew burst ]
    RA: 342.645244721413   Dec: -15.404374103901  [deg; J2000]
        { 22h 50m 34.9s , -15d 24' 15.7" }
         +/- 1.30291349247094 [arcmin] (estimated 90% radius based on SNR)
         +/- 0.58567330290179 [arcmin] (formal 1-sigma fit error)
    SNR: 20.8426657349901

  Angular difference between the analysis and refined position is 0.596486 arcmin

  Partial Coding Fraction: 0.08789062    [ including projection effects ]

  Duration
     T90: 26.527999997139 +/- 2.83976335112829
        Measured from: -10.2960000038147
                   to: 16.2319999933243     [s; relative to TRIGTIME]
     T50: 8.81600004434586 +/- 1.08705842583515
        Measured from: -4.00800001621246
                   to: 4.80800002813339     [s; relative to TRIGTIME]


  Fluence
     Peak Flux  (peak 1 second)
        Measured from: 2.63599997758865
                   to: 3.63599997758865     [s; relative to TRIGTIME]
     Total Fluence
        Measured from: -11.6560000181198
                   to: 18.839999973774     [s; relative to TRIGTIME]

             Band 1     Band 2     Band 3     Band 4
              15-25      25-50     50-100    100-350     keV
 Total     1.430839   2.177472   2.331546   1.036795
           0.139353   0.153619   0.140583   0.124146 [error]
 Peak      0.109885   0.192326   0.179610   0.088507
           0.029141   0.033633   0.030259   0.024575 [error]

     [ fluence units of on-axis counts / fully illuminated detector ]

======================================================================


====== Table of the duration information =============================

        Value   tstart    tstop
T100   30.496  -11.656   18.840
T90    26.528  -10.296   16.232
T50     8.816   -4.008    4.808
Peak    1.000    2.636    3.636


====== Spectral Analysis Summary =====================================

Model      : spectral model: simple power-law (PL) and cutoff power-law (CPL)
Ph_index   : photon index: E^{Ph_index}
Ph_90err   : 90% error of the photon index
Epeak      : Epeak in keV
Epeak_90err: 90% error of Epeak
Norm       : normalization at 50 keV in both the PL model and CPL model
Nomr_90err : 90% error of the normalization
chi2       : Chi-Squared
dof        : degree of freedo

=== Time-averaged spectral analysis ===
(Best model with acceptable fit: PL)

Model Ph_index Ph_90err_low Ph_90err_hi  Epeak  Epeak_90err_low  Epeak_90err_hi  Norm       Nomr_90err_low    Norm_90err_hi    chi2    dof
PL      -1.297    -0.116      0.118       -           -               -         1.69e-02     -1.13e-03          1.12e-03      67.720   57
CPL     -1.224    -0.180      0.394      607.425    -607.425      -607.425      1.82e-02     -2.38e-03          8.66e-03      67.760   56


=== 1-s peak spectral analysis ===
(Best model with acceptable fit: PL)

Model Ph_index Ph_90err_low Ph_90err_hi  Epeak  Epeak_90err_low  Epeak_90err_hi  Norm       Nomr_90err_low    Norm_90err_hi    chi2    dof
PL      -1.614     -0.269     0.259       -           -               -         3.29e-02     -6.42e-03          6.42e-03      69.190   57
CPL     -0.356     -1.075     1.365       83.517     -20.323       102.780      1.13e-01     -1.13e-01          2.63e-01      65.130   56


=== Fluence/Peak Flux Summary ===

              Model    Band1     Band2     Band3     Band4     Band5     Total
                       15-25     25-50    50-100    100-350    15-150    15-350    keV
Fluence         PL   5.43e-07  1.13e-06  1.84e-06  6.75e-06  5.09e-06  1.03e-05   erg/cm2
      90%_error_low -7.15e-08 -9.13e-08 -1.38e-07 -1.08e-06 -3.50e-07 -1.15e-06   erg/cm2
      90%_error_hi   7.48e-08  9.05e-08  1.37e-07  1.21e-06  3.51e-07  1.26e-06   erg/cm2
Peak flux       PL   1.51e+00  1.42e+00  9.30e-01  9.41e-01  4.25e+00  4.81e+00   ph/cm2/s
      90%_error_low -4.59e-01 -3.13e-01 -1.98e-01 -3.25e-01 -9.00e-01 -9.47e-01   ph/cm2/s
      90%_error_hi   5.03e-01  3.10e-01  1.95e-01  3.74e-01  9.07e-01  9.49e-01   ph/cm2/s

Fluence        CPL   5.40e-07  1.13e-06  1.85e-06  6.72e-06  5.09e-06  1.00e-05   erg/cm2
      90%_error_low -9.17e-08 -9.49e-08 -1.46e-07 -2.91e-06 -3.62e-07 -2.67e-06   erg/cm2
      90%_error_hi   6.40e-08  9.99e-08  1.60e-07  6.90e-07  3.56e-07  1.41e-06   erg/cm2
Peak flux      CPL   1.06e+00  1.54e+00  1.20e+00  5.49e-01  4.16e+00  4.35e+00   ph/cm2/s
      90%_error_low -5.22e-01 -3.70e-01 -3.00e-01 -2.67e-01 -8.97e-01 -9.49e-01   ph/cm2/s
      90%_error_hi   6.06e-01  3.66e-01  3.16e-01  3.96e-01  9.08e-01  9.75e-01   ph/cm2/s

======================================================================
Image
Pre-slew 15.0-350.0 keV image (Event data)
#   RAcent    DECcent   POSerr    Theta     Phi              Peak Cts       SNR   Name
  342.6452   -15.4044   0.0092    52.4058   165.4841         7.1941994     20.843 TRIG_00755867

Foreground time interval of the image:
-11.656  18.840 (delta_t =  30.496 [sec])
Background time interval of the image:
-575.167 -560.790 (delta_t =  14.377 [sec])
-239.568 -11.656 (delta_t = 227.912 [sec])
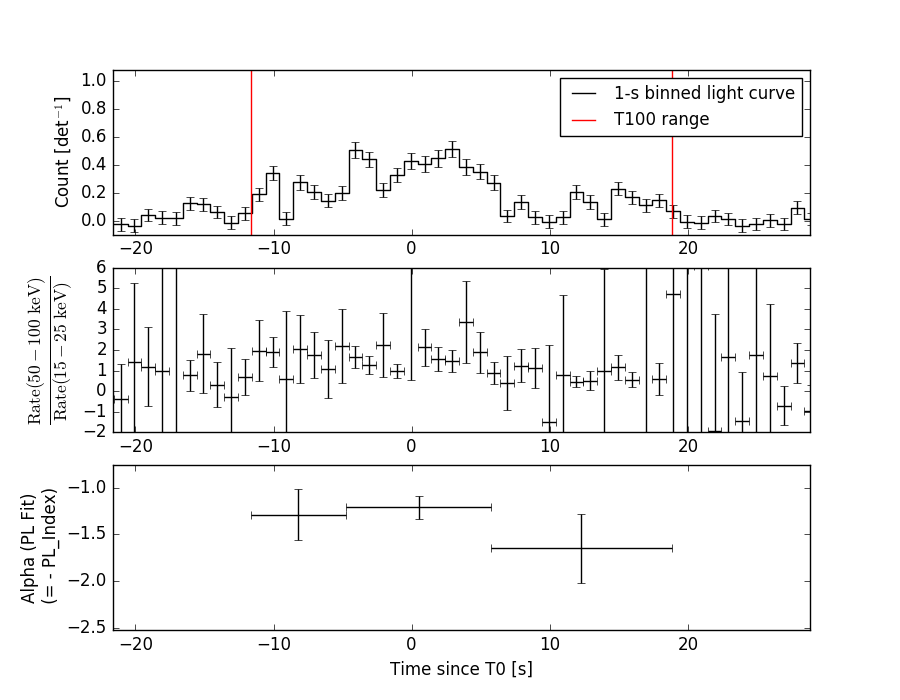
Light Curves
Note: The mask-weighted lightcurves have units of either count/det or counts/sec/det, where a det is 0.4 x 0.4 = 0.16 sq cm.
Full-time range; 1 s binning
Other quick-look light curves:
- 64 ms binning (zoomed)
- 16 ms binning (zoomed)
- 8 ms binning (zoomed)
- 2 ms binning (zoomed)
- SN=5 or 10 s binning (full-time range)
- Raw light curve
Spectra
- 64 ms binning (zoomed)
- 16 ms binning (zoomed)
- 8 ms binning (zoomed)
- 2 ms binning (zoomed)
- SN=5 or 10 s binning (full-time range)
- Raw light curve
Spectra
Notes:
- 1) The fitting includes the systematic errors.
- 2) When the burst includes telescope slew time periods, the fitting uses an average response file made from multiple 5-s response files through out the slew time plus single time preiod for the non-slew times, and weighted by the total counts in the corresponding time period using addrmf. An average response file is needed becuase a spectral fit using the pre-slew DRM will introduce some errors in both a spectral shape and a normalization if the PHA file contains a lot of the slew/post-slew time interval.
- 3) For fits to more complicated models (e.g. a power-law over a cutoff power-law), the BAT team has decided to require a chi-square improvement of more than 6 for each extra dof.
Time averaged spectrum fit using the average DRM
Power-law model
Time interval is from  -11.656 sec. to   18.840 sec.

Spectral model in power-law:
------------------------------------------------------------
Parameters  : value       lower 90%   higher 90%
Photon index: -1.29669     ( -0.116047   0.117622 )
Norm@50keV  : 1.68724E-02    ( -0.00112512   0.00112249 )
------------------------------------------------------------
#Fit statistic : Chi-Squared =          67.72 using 59 PHA bins.
# Reduced chi-squared =          1.188 for     57 degrees of freedom
# Null hypothesis probability =   1.564681e-01

Photon flux (15-150 keV)    in 30.5 sec: 2.01171 ( -0.14564  0.14644 ) ph/cm2/s
Energy fluence (15-150 keV)             : 5.09002e-06 ( -3.50006e-07  3.50741e-07 ) ergs/cm2
Cutoff power-law model

Time interval is from  -11.656 sec. to   18.840 sec.
Spectral model in the cutoff power-law:
------------------------------------------------------------
Parameters  : value       lower 90%   higher 90%
Photon index: -1.2926     ( -0.175862   0.398384 )
Epeak [keV] : 9997.53      ( -9997.37 -9997.37 )
Norm@50keV  : 1.69446E-02    ( -0.00111803   0.00992 )
------------------------------------------------------------
#Fit statistic : Chi-Squared =          67.72 using 59 PHA bins.
# Reduced chi-squared =          1.209 for     56 degrees of freedom
# Null hypothesis probability =   1.355513e-01

Photon flux (15-150 keV)    in 30.5 sec: 2.00939 ( -0.15211  0.14343 ) ph/cm2/s
Energy fluence (15-150 keV)             : 5.08569e-06 ( -3.618e-07  3.562e-07 ) ergs/cm2
1-s peak spectrum fit
Power-law model
Time interval is from    2.636 sec. to    3.636 sec.

Spectral model in power-law:
------------------------------------------------------------
Parameters  : value       lower 90%   higher 90%
Photon index: -1.61399     ( -0.268721   0.259185 )
Norm@50keV  : 3.29359E-02    ( -0.00641934   0.00641891 )
------------------------------------------------------------
#Fit statistic : Chi-Squared =          69.19 using 59 PHA bins.
# Reduced chi-squared =          1.214 for     57 degrees of freedom
# Null hypothesis probability =   1.291053e-01

Photon flux (15-150 keV)    in 1 sec: 4.25106 ( -0.89994  0.90662 ) ph/cm2/s
Energy fluence (15-150 keV)             : 3.07553e-07 ( -6.0483e-08  6.04319e-08 ) ergs/cm2
Cutoff power-law model
Time interval is from    2.636 sec. to    3.636 sec.
Spectral model in the cutoff power-law:
------------------------------------------------------------
Parameters  : value       lower 90%   higher 90%
Photon index: -0.355736     ( -1.07537   1.36512 )
Epeak [keV] : 83.5174      ( -20.3199 102.783 )
Norm@50keV  : 0.112799    ( -0.112814   0.263376 )
------------------------------------------------------------
#Fit statistic : Chi-Squared =          65.13 using 59 PHA bins.
# Reduced chi-squared =          1.163 for     56 degrees of freedom
# Null hypothesis probability =   1.889588e-01

Photon flux (15-150 keV)    in 1 sec: 4.16381 ( -0.89701  0.9076 ) ph/cm2/s
Energy fluence (15-150 keV)             : 3.26979e-07 ( -6.3273e-08  6.32235e-08 ) ergs/cm2
Time-resolved spectra
Distribution
T90 vs. Hardness ratio plot
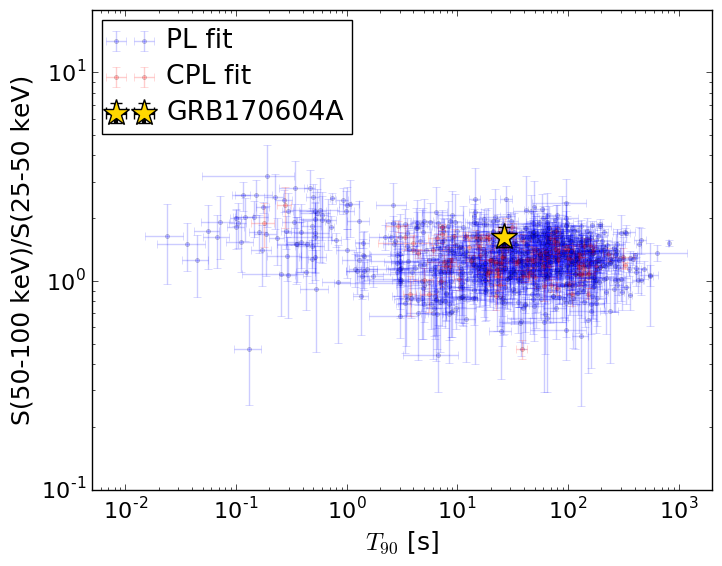
T90                                   = 26.528 sec.
Hardness ratio (energy fluence ratio) = 1.6282844469
S(15-50 keV) vs. S(50-150 keV) plot
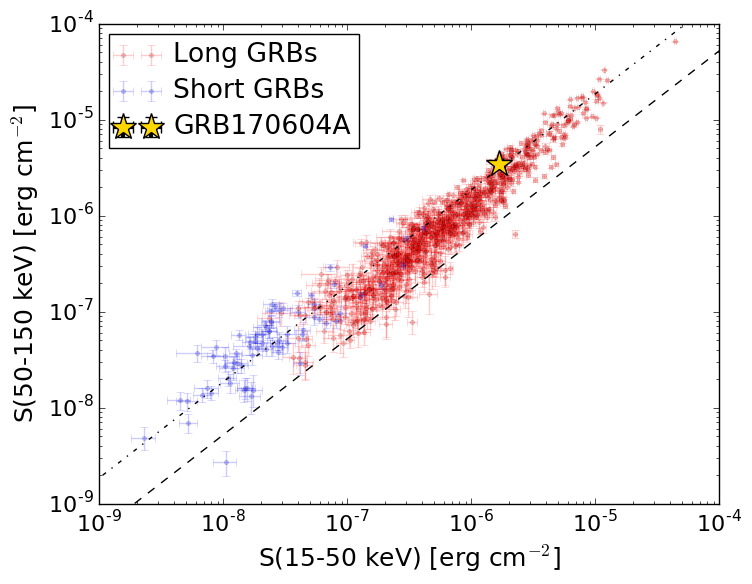
S(15-50 keV)  = 1.6740592e-06
S(50-150 keV) = 3.415909e-06
The dash-dotted line and the dashed line traces the fluences calculated from the Band function with Epeak = 15 and 150 keV, respectively. Both lines assume a canonical values of alpha = -1 and beta = -2.5.
Mask shadow pattern
IMX = -1.257337098614037E+00, IMY = -3.255414899676689E-01
Spacecraft aspect plot
Bright source in the pre-burst/pre-slew/post-slew images
Pre-burst image of 15-350 keV band
Time interval of the image:
-575.167400 -560.790000
-239.568000 -11.656000

# RAcent  DECcent POSerr Theta    Phi  PeakCts   SNR AngSep     Name
#  [deg]    [deg]    ['] [deg]  [deg]                   [']
303.4253 -53.6021    3.2  40.7   97.6   3.3308   3.7 ------	UNKNOWN
300.7638 -71.3548    3.5  32.4   70.9   1.4941   3.3 ------	UNKNOWN
  0.7522 -27.1476    4.3  35.4 -177.7   0.7886   2.7 ------	UNKNOWN
 35.8211 -43.5053    3.1  18.4 -109.8   0.9759   3.8 ------	UNKNOWN
 23.0954 -30.8047    2.5  28.9 -141.8   1.2342   4.7 ------	UNKNOWN
 41.9050 -18.4277    3.6  43.8 -116.2   3.0957   3.2 ------	UNKNOWN
 38.6717 -16.0963    3.1  45.4 -121.3   3.7004   3.7 ------	UNKNOWN
Pre-slew background subtracted image of 15-350 keV band
Time interval of the image:
-11.656000 18.840000

# RAcent  DECcent POSerr Theta    Phi  PeakCts   SNR AngSep     Name
#  [deg]    [deg]    ['] [deg]  [deg]                   [']
171.3429 -64.0653    2.4  54.2   19.3   1.8188   4.8 ------	UNKNOWN
342.6453 -15.4044    0.6  52.4  165.5   7.1944  20.8 ------	UNKNOWN
 11.9709 -24.4517    1.9  35.8 -159.7   0.5533   5.9 ------	UNKNOWN
Post-slew image of 15-350 keV band
Time interval of the image:
108.732590 429.132610

# RAcent  DECcent POSerr Theta    Phi  PeakCts   SNR AngSep     Name
#  [deg]    [deg]    ['] [deg]  [deg]                   [']
326.2428  38.3948    5.4  56.0 -173.6   2.6642   2.1    5.5	Cyg X-2
305.5532  -9.7754    2.3  36.6  116.3   3.4962   5.0 ------	UNKNOWN
  5.3764 -67.3107    2.3  54.0   11.3   6.0114   5.0 ------	UNKNOWN
351.7474 -26.5644    3.0  14.0  -13.8   0.9744   3.9 ------	UNKNOWN
 27.1409 -36.7089    3.3  44.7  -31.0   1.6647   3.5 ------	UNKNOWN
 22.3985  -6.3797    3.2  40.0  -76.7   3.4224   3.6 ------	UNKNOWN