Analysis Summary
Notes:
- 1) No attempt has been made to eliminate the non-significant decimal places.
- 2) This batgrbproduct analysis is done using the HEASARC data.
- 3) This batgrbproduct analysis is using the flight position for the mask-weighting calculation.
======================================================================
BAT GRB EVENT DATA PROCESSING REPORT
Process Script Ver: batgrbproduct v2.46
Process Start Time: Wed Jun 21 15:21:57 EDT 2017
Host Name: bat1
Current Working Dir: /local/data/bat1/alien/Swift_3rdBATcatalog/event/batevent_reproc/trigger756284
======================================================================
Trigger: 00756284 Segment: 000
BAT Trigger Time: 518570512.896 [s; MET]
Trigger Stop: 518570513.92 [s; MET]
UTC: 2017-06-07T23:21:33.713940 [includes UTCF correction]
Where From?: TDRSS position message
BAT
RA: 7.34357806330534 Dec: 9.23797385784254 [deg; J2000]
Catalogged Source?: NO
Point Source?: YES
GRB Indicated?: YES [ by BAT flight software ]
Image S/N Ratio: 16.32
Image Trigger?: NO
Rate S/N Ratio: 41.821047332653 [ if not an image trigger ]
Image S/N Ratio: 16.32
Analysis Position: [ source = BAT ]
RA: 7.34357806330534 Dec: 9.23797385784254 [deg; J2000]
Refined Position: [ source = BAT pre-slew burst ]
RA: 7.35798348835567 Dec: 9.22449023832508 [deg; J2000]
{ 00h 29m 25.9s , +09d 13' 28.2" }
+/- 1.01266702398168 [arcmin] (estimated 90% radius based on SNR)
+/- 0.32009528664773 [arcmin] (formal 1-sigma fit error)
SNR: 29.875064679646
Angular difference between the analysis and refined position is 1.175731 arcmin
Partial Coding Fraction: 0.5703125 [ including projection effects ]
Duration
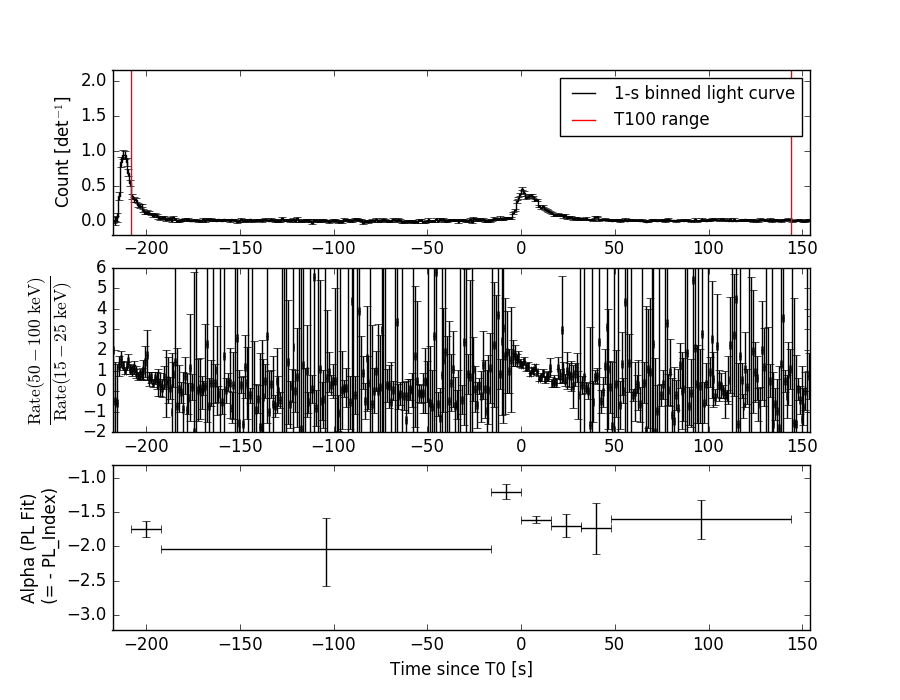
T90: 320 +/- 172.325273828304
Measured from: -191.896000027657
to: 128.103999972343 [s; relative to TRIGTIME]
T50: 192 +/- 150.943698112906
Measured from: -143.896000027657
to: 48.1039999723434 [s; relative to TRIGTIME]
Fluence
Peak Flux (peak 1 second)
Measured from: 7.60399997234344
to: 8.60399997234344 [s; relative to TRIGTIME]
Total Fluence
Measured from: -207.896000027657
to: 144.103999972343 [s; relative to TRIGTIME]
Band 1 Band 2 Band 3 Band 4
15-25 25-50 50-100 100-350 keV
Total 3.547108 4.578176 3.260995 0.659440
0.138965 0.145247 0.127647 0.110512 [error]
Peak 0.087767 0.127296 0.086378 0.016081
0.009489 0.010320 0.008786 0.007334 [error]
[ fluence units of on-axis counts / fully illuminated detector ]
======================================================================
====== Table of the duration information =============================
Value tstart tstop
T100 352.000 -207.896 144.104
T90 320.000 -191.896 128.104
T50 192.000 -143.896 48.104
Peak 1.000 7.604 8.604
====== Spectral Analysis Summary =====================================
Model : spectral model: simple power-law (PL) and cutoff power-law (CPL)
Ph_index : photon index: E^{Ph_index}
Ph_90err : 90% error of the photon index
Epeak : Epeak in keV
Epeak_90err: 90% error of Epeak
Norm : normalization at 50 keV in both the PL model and CPL model
Nomr_90err : 90% error of the normalization
chi2 : Chi-Squared
dof : degree of freedo
=== Time-averaged spectral analysis ===
(Best model with acceptable fit: PL)
Model Ph_index Ph_90err_low Ph_90err_hi Epeak Epeak_90err_low Epeak_90err_hi Norm Nomr_90err_low Norm_90err_hi chi2 dof
PL -1.625 -0.072 0.072 - - - 2.32e-03 -8.96e-05 8.93e-05 42.220 57
CPL -1.579 -0.114 0.241 465.611 -465.611 -465.611 2.45e-03 -2.09e-04 7.28e-04 42.280 56
=== 1-s peak spectral analysis ===
(Best model with acceptable fit: PL)
Model Ph_index Ph_90err_low Ph_90err_hi Epeak Epeak_90err_low Epeak_90err_hi Norm Nomr_90err_low Norm_90err_hi chi2 dof
PL -1.666 -0.167 0.164 - - - 2.06e-02 -2.10e-03 2.07e-03 57.950 57
CPL -1.583 -0.717 0.627 220.114 N/A N/A 2.29e-02 N/A N/A 57.900 56
=== Fluence/Peak Flux Summary ===
Model Band1 Band2 Band3 Band4 Band5 Total
15-25 25-50 50-100 100-350 15-150 15-350 keV
Fluence PL 1.17e-06 2.00e-06 2.59e-06 6.79e-06 7.63e-06 1.26e-05 erg/cm2
90%_error_low -8.20e-08 -8.18e-08 -1.32e-07 -7.40e-07 -3.11e-07 -8.32e-07 erg/cm2
90%_error_hi 8.41e-08 8.15e-08 1.32e-07 8.01e-07 3.12e-07 8.79e-07 erg/cm2
Peak flux PL 9.97e-01 9.09e-01 5.73e-01 5.53e-01 2.71e+00 3.03e+00 ph/cm2/s
90%_error_low -1.46e-01 -8.59e-02 -7.56e-02 -1.33e-01 -2.52e-01 -2.84e-01 ph/cm2/s
90%_error_hi 1.51e-01 8.56e-02 7.53e-02 1.57e-01 2.53e-01 2.85e-01 ph/cm2/s
Fluence CPL 1.17e-06 2.01e-06 2.60e-06 6.77e-06 7.62e-06 1.24e-05 erg/cm2
90%_error_low -1.02e-07 -8.84e-08 -1.09e-07 -2.33e-06 -3.55e-07 -2.39e-06 erg/cm2
90%_error_hi 6.92e-08 8.95e-08 1.39e-07 4.81e-07 3.19e-07 1.02e-06 erg/cm2
Peak flux CPL 9.86e-01 9.18e-01 5.75e-01 4.91e-01 2.70e+00 2.97e+00 ph/cm2/s
90%_error_low -1.63e-01 -9.37e-02 -7.72e-02 N/A -2.54e-01 -3.89e-01 ph/cm2/s
90%_error_hi 8.46e-02 1.07e-01 7.90e-02 N/A 2.58e-01 3.41e-01 ph/cm2/s
======================================================================
Image
Pre-slew 15.0-350.0 keV image (Event data)
#   RAcent    DECcent   POSerr    Theta     Phi              Peak Cts       SNR   Name
    7.3580     9.2245   0.0064    28.0316   132.9764         6.2914612     29.875 TRIG_00756284

Foreground time interval of the image:
-122.995  13.805 (delta_t = 136.800 [sec])
Background time interval of the image:
Light Curves
Note: The mask-weighted lightcurves have units of either count/det or counts/sec/det, where a det is 0.4 x 0.4 = 0.16 sq cm.
Full-time range; 1 s binning
Other quick-look light curves:
- 64 ms binning (zoomed)
- 16 ms binning (zoomed)
- 8 ms binning (zoomed)
- 2 ms binning (zoomed)
- SN=5 or 10 s binning (full-time range)
- Raw light curve
Spectra
- 64 ms binning (zoomed)
- 16 ms binning (zoomed)
- 8 ms binning (zoomed)
- 2 ms binning (zoomed)
- SN=5 or 10 s binning (full-time range)
- Raw light curve
Spectra
Notes:
- 1) The fitting includes the systematic errors.
- 2) When the burst includes telescope slew time periods, the fitting uses an average response file made from multiple 5-s response files through out the slew time plus single time preiod for the non-slew times, and weighted by the total counts in the corresponding time period using addrmf. An average response file is needed becuase a spectral fit using the pre-slew DRM will introduce some errors in both a spectral shape and a normalization if the PHA file contains a lot of the slew/post-slew time interval.
- 3) For fits to more complicated models (e.g. a power-law over a cutoff power-law), the BAT team has decided to require a chi-square improvement of more than 6 for each extra dof.
Time averaged spectrum fit using the average DRM
Power-law model
Time interval is from -207.896 sec. to  144.104 sec.

Spectral model in power-law:
------------------------------------------------------------
Parameters  : value       lower 90%   higher 90%
Photon index: -1.62528     ( -0.072468   0.0721692 )
Norm@50keV  : 2.32298E-03    ( -8.958e-05   8.93247e-05 )
------------------------------------------------------------
#Fit statistic : Chi-Squared =          42.22 using 59 PHA bins.
# Reduced chi-squared =         0.7408 for     57 degrees of freedom
# Null hypothesis probability =   9.280700e-01

Photon flux (15-150 keV)    in 352 sec: 0.300910 ( -0.012181  0.01223 ) ph/cm2/s
Energy fluence (15-150 keV)             : 7.62576e-06 ( -3.11465e-07  3.12448e-07 ) ergs/cm2
Cutoff power-law model
Time interval is from -207.896 sec. to  144.104 sec.
Spectral model in the cutoff power-law:
------------------------------------------------------------
Parameters  : value       lower 90%   higher 90%
Photon index: -1.62335     ( -0.111382   0.243878 )
Epeak [keV] : 9996.03      ( -9995.7 -9995.7 )
Norm@50keV  : 2.32821E-03    ( -8.9223e-05   0.000848082 )
------------------------------------------------------------
#Fit statistic : Chi-Squared =          42.22 using 59 PHA bins.
# Reduced chi-squared =         0.7540 for     56 degrees of freedom
# Null hypothesis probability =   9.134945e-01

Photon flux (15-150 keV)    in 352 sec: 0.300692 ( -0.013345  0.012407 ) ph/cm2/s
Energy fluence (15-150 keV)             : 7.6189e-06 ( -3.55119e-07  3.18581e-07 ) ergs/cm2
1-s peak spectrum fit
Power-law model
Time interval is from    7.604 sec. to    8.604 sec.

Spectral model in power-law:
------------------------------------------------------------
Parameters  : value       lower 90%   higher 90%
Photon index: -1.66607     ( -0.167266   0.163981 )
Norm@50keV  : 2.06408E-02    ( -0.00210146   0.00207279 )
------------------------------------------------------------
#Fit statistic : Chi-Squared =          57.95 using 59 PHA bins.
# Reduced chi-squared =          1.017 for     57 degrees of freedom
# Null hypothesis probability =   4.399693e-01

Photon flux (15-150 keV)    in 1 sec: 2.70974 ( -0.25239  0.25253 ) ph/cm2/s
Energy fluence (15-150 keV)             : 1.91695e-07 ( -2.06186e-08  2.08691e-08 ) ergs/cm2
Cutoff power-law model
Time interval is from    7.604 sec. to    8.604 sec.
Spectral model in the cutoff power-law:
------------------------------------------------------------
Parameters  : value       lower 90%   higher 90%
Photon index: -1.58305     ( -0.717751   0.627121 )
Epeak [keV] : 220.114      (   )
Norm@50keV  : 2.28991E-02    (     )
------------------------------------------------------------
#Fit statistic : Chi-Squared =          57.89 using 59 PHA bins.
# Reduced chi-squared =          1.034 for     56 degrees of freedom
# Null hypothesis probability =   4.053505e-01

Photon flux (15-150 keV)    in 1 sec: 2.70123 ( -0.25364  0.25808 ) ph/cm2/s
Energy fluence (15-150 keV)             : 1.90187e-07 ( -2.31049e-08  2.20201e-08 ) ergs/cm2
Time-resolved spectra
Distribution
T90 vs. Hardness ratio plot
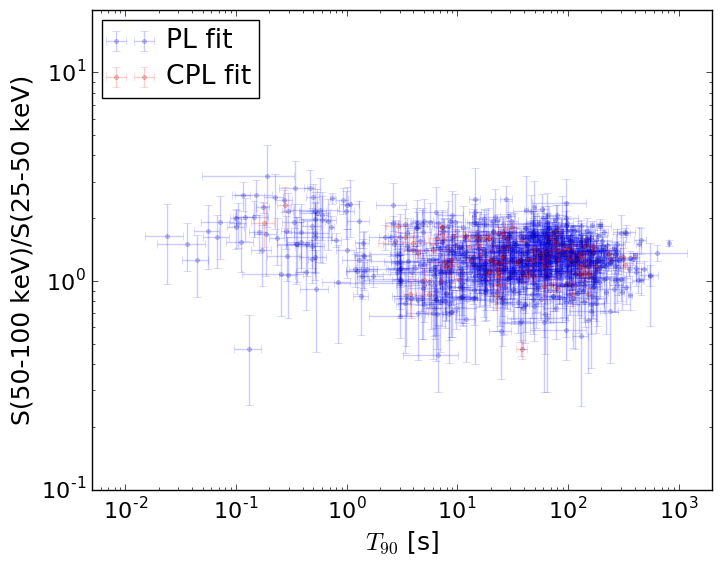
T90                                   = N/A sec.
Hardness ratio (energy fluence ratio) = N/A
S(15-50 keV) vs. S(50-150 keV) plot

S(15-50 keV)  = N/A
S(50-150 keV) = N/A
The dash-dotted line and the dashed line traces the fluences calculated from the Band function with Epeak = 15 and 150 keV, respectively. Both lines assume a canonical values of alpha = -1 and beta = -2.5.
Mask shadow pattern
IMX = -3.629465970071011E-01, IMY = -3.895343691985889E-01
Spacecraft aspect plot
Bright source in the pre-burst/pre-slew/post-slew images
Pre-burst image of 15-350 keV band
Time interval of the image:
Pre-slew background subtracted image of 15-350 keV band
Time interval of the image:
-122.995400 13.804600

# RAcent  DECcent POSerr Theta    Phi  PeakCts   SNR AngSep     Name
#  [deg]    [deg]    ['] [deg]  [deg]                   [']
357.3081  15.8868    1.8  39.6  137.9   2.3065   6.3 ------	UNKNOWN
357.4795  25.7640    2.4  43.9  151.3   1.9051   4.8 ------	UNKNOWN
  7.3580   9.2245    0.4  28.0  133.0   6.2906  29.9 ------	UNKNOWN
 13.4773  25.3928    2.3  32.7  166.2   1.1081   5.0 ------	UNKNOWN
  2.0004  49.8441    1.9  57.4  177.7   6.0188   6.0 ------	UNKNOWN
 63.4691 -51.7358    3.5  56.8   -0.2   2.6704   3.3 ------	UNKNOWN
 69.5285 -23.8268    2.6  41.7  -32.3   1.2838   4.4 ------	UNKNOWN
 73.3284   4.4960    3.5  40.0  -76.6   2.2105   3.3 ------	UNKNOWN
 77.1245  -3.6513    3.4  43.5  -64.2   2.5482   3.4 ------	UNKNOWN
 61.9377  39.6879    3.0  48.1 -129.2   3.4264   3.9 ------	UNKNOWN
 62.7977  37.9781    2.8  47.2 -127.0   3.6046   4.1 ------	UNKNOWN
Post-slew image of 15-350 keV band
Time interval of the image:
62.404590 836.886000
900.104000 962.157600

# RAcent  DECcent POSerr Theta    Phi  PeakCts   SNR AngSep     Name
#  [deg]    [deg]    ['] [deg]  [deg]                   [']
326.2369  38.2280    7.0  46.9  156.1   2.6455   1.7    6.4	Cyg X-2
 13.5503 -13.5443    3.3  23.6    6.0   1.7877   3.5 ------	UNKNOWN
 29.5390 -40.4280    2.5  53.7    0.3   6.9802   4.6 ------	UNKNOWN
 15.4297  -2.3488    2.7  14.1  -14.0   2.0825   4.2 ------	UNKNOWN
 40.8430  48.1001    3.0  48.0 -129.1  10.9304   3.8 ------	UNKNOWN
 46.9500  26.2135    4.9  41.1  -98.4   6.5090   2.4 ------	UNKNOWN
 52.4685  -4.2975    3.4  46.9  -54.0   9.6062   3.4 ------	UNKNOWN