Analysis Summary
Notes:
- 1) No attempt has been made to eliminate the non-significant decimal places.
- 2) This batgrbproduct analysis is done using the HEASARC data.
- 3) This batgrbproduct analysis is using the flight position for the mask-weighting calculation.
======================================================================
                  BAT GRB EVENT DATA PROCESSING REPORT
    Process Script Ver: batgrbproduct v2.46
    Process Start Time: Wed Aug  2 15:01:47 EDT 2017
             Host Name: bat1
   Current Working Dir: /local/data/bat1/alien/Swift_3rdBATcatalog/event/batevent_reproc/trigger760064
======================================================================

  Trigger: 00760064      Segment: 000

  BAT Trigger Time: 520915566.4   [s; MET]
      Trigger Stop: 520915567.424   [s; MET]
               UTC: 2017-07-05T02:45:47.080260    [includes UTCF correction]
       Where From?: TDRSS position message

  BAT
    RA: 191.705000976796   Dec: 18.29305165087  [deg; J2000]

     Catalogged Source?: NO
     Point Source?:      YES
     GRB Indicated?:     YES    [ by BAT flight software ]
     Image S/N Ratio:    8.55
     Image Trigger?:     NO
     Rate S/N Ratio:     15.2315462117278  [ if not an image trigger ]
     Image S/N Ratio:    8.55

  Analysis Position:   [ source = BAT ]
    RA: 191.705000976796   Dec: 18.29305165087  [deg; J2000]

  Refined Position:   [ source = BAT pre-slew burst ]
    RA: 191.708449416614   Dec: 18.2971908310857  [deg; J2000]
        { 12h 46m 50.0s , +18d 17' 49.9" }
         +/- 0.659520317019392 [arcmin] (estimated 90% radius based on SNR)
         +/- 0.23724287812918 [arcmin] (formal 1-sigma fit error)
    SNR: 55.1269339758875

  Angular difference between the analysis and refined position is 0.316654 arcmin

  Partial Coding Fraction: 0.8359375    [ including projection effects ]

  Duration
     T90: 223.203999936581 +/- 15.5520109197925
        Measured from: 4.37200003862381
                   to: 227.575999975204     [s; relative to TRIGTIME]
     T50: 90.5199999213219 +/- 55.6082785008254
        Measured from: 12.2800000309944
                   to: 102.799999952316     [s; relative to TRIGTIME]


  Fluence
     Peak Flux  (peak 1 second)
        Measured from: 13.4120000004768
                   to: 14.4120000004768     [s; relative to TRIGTIME]
     Total Fluence
        Measured from: -0.387999951839447
                   to: 310.464000046253     [s; relative to TRIGTIME]

             Band 1     Band 2     Band 3     Band 4
              15-25      25-50     50-100    100-350     keV
 Total     4.696455   5.691067   4.073681   1.036151
           0.112395   0.118211   0.104684   0.092327 [error]
 Peak      0.362903   0.615514   0.556924   0.132558
           0.012749   0.015500   0.015156   0.010266 [error]

     [ fluence units of on-axis counts / fully illuminated detector ]

======================================================================


====== Table of the duration information =============================

        Value   tstart    tstop
T100  310.852   -0.388  310.464
T90   223.204    4.372  227.576
T50    90.520   12.280  102.800
Peak    1.000   13.412   14.412


====== Spectral Analysis Summary =====================================

Model      : spectral model: simple power-law (PL) and cutoff power-law (CPL)
Ph_index   : photon index: E^{Ph_index}
Ph_90err   : 90% error of the photon index
Epeak      : Epeak in keV
Epeak_90err: 90% error of Epeak
Norm       : normalization at 50 keV in both the PL model and CPL model
Nomr_90err : 90% error of the normalization
chi2       : Chi-Squared
dof        : degree of freedo

=== Time-averaged spectral analysis ===
(Best model with acceptable fit: PL)

Model Ph_index Ph_90err_low Ph_90err_hi  Epeak  Epeak_90err_low  Epeak_90err_hi  Norm       Nomr_90err_low    Norm_90err_hi    chi2    dof
PL      -1.629    -0.054      0.054       -           -               -         3.19e-03     -8.63e-05          8.62e-05      60.340   57
CPL     -1.608    -0.072      0.130      996.671    -996.661      -996.671      3.26e-03     -1.53e-04          4.31e-04      60.620   56


=== 1-s peak spectral analysis ===
(Best model with acceptable fit: CPL)

Model Ph_index Ph_90err_low Ph_90err_hi  Epeak  Epeak_90err_low  Epeak_90err_hi  Norm       Nomr_90err_low    Norm_90err_hi    chi2    dof
PL      -1.292     -0.053     0.053       -           -               -         1.16e-01     -3.46e-03          3.46e-03      47.200   57
CPL     -0.917     -0.216     0.227      161.283     -40.411       135.388      1.72e-01     -3.42e-02          4.50e-02      38.170   56


=== Fluence/Peak Flux Summary ===

              Model    Band1     Band2     Band3     Band4     Band5     Total
                       15-25     25-50    50-100    100-350    15-150    15-350    keV
Fluence         PL   1.42e-06  2.42e-06  3.13e-06  8.17e-06  9.22e-06  1.52e-05   erg/cm2
      90%_error_low -7.63e-08 -7.34e-08 -1.11e-07 -6.52e-07 -2.62e-07 -7.15e-07   erg/cm2
      90%_error_hi   7.80e-08  7.32e-08  1.11e-07  6.92e-07  2.63e-07  7.46e-07   erg/cm2
Peak flux       PL   8.02e-04  9.49e-03  1.54e-01  1.35e+01  4.39e-01  1.35e+01   ph/cm2/s
      90%_error_low     N/A       N/A       N/A       N/A       N/A       N/A     ph/cm2/s
      90%_error_hi      N/A       N/A       N/A       N/A       N/A       N/A     ph/cm2/s

Fluence        CPL   1.43e-06  2.41e-06  3.12e-06  8.15e-06  9.28e-06  1.59e-05   erg/cm2
      90%_error_low    N/A       N/A    -9.79e-08    N/A    -1.93e-07 -2.41e-06   erg/cm2
      90%_error_hi     N/A       N/A     1.24e-07    N/A     1.99e-07  -4.04e-07   erg/cm2
Peak flux      CPL   3.56e+00  4.55e+00  3.79e+00  3.45e+00  1.36e+01  1.54e+01   ph/cm2/s
      90%_error_low -2.93e-01 -1.71e-01 -1.53e-01 -6.26e-01 -4.58e-01 -8.05e-01   ph/cm2/s
      90%_error_hi   3.00e-01  1.72e-01  1.55e-01  7.98e-01  4.59e-01  9.29e-01   ph/cm2/s

======================================================================
Image
Pre-slew 15.0-350.0 keV image (Event data)
#   RAcent    DECcent   POSerr    Theta     Phi              Peak Cts       SNR   Name
  191.7084    18.2972   0.0035    27.6461  -153.2645         3.5017277     55.127 TRIG_00760064

Foreground time interval of the image:
 -0.388   2.729 (delta_t =   3.117 [sec])
  3.600  11.901 (delta_t =   8.301 [sec])
Background time interval of the image:
-573.299 -558.717 (delta_t =  14.582 [sec])
-239.400  -0.388 (delta_t = 239.012 [sec])
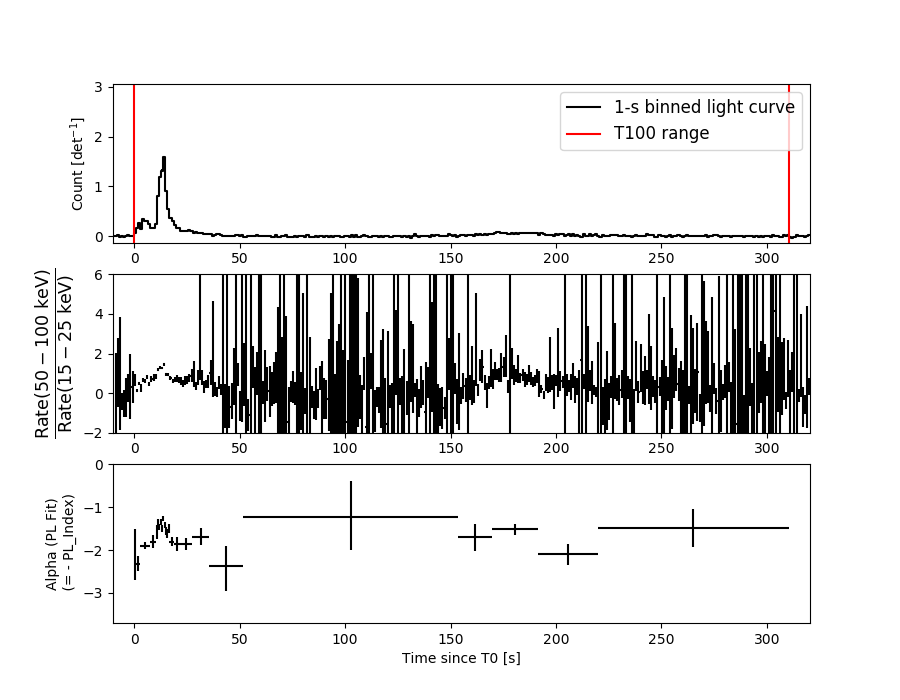
Light Curves
Note: The mask-weighted lightcurves have units of either count/det or counts/sec/det, where a det is 0.4 x 0.4 = 0.16 sq cm.
Full-time range; 1 s binning
Other quick-look light curves:
- 64 ms binning (zoomed)
- 16 ms binning (zoomed)
- 8 ms binning (zoomed)
- 2 ms binning (zoomed)
- SN=5 or 10 s binning (full-time range)
- Raw light curve
Spectra
- 64 ms binning (zoomed)
- 16 ms binning (zoomed)
- 8 ms binning (zoomed)
- 2 ms binning (zoomed)
- SN=5 or 10 s binning (full-time range)
- Raw light curve
Spectra
Notes:
- 1) The fitting includes the systematic errors.
- 2) When the burst includes telescope slew time periods, the fitting uses an average response file made from multiple 5-s response files through out the slew time plus single time preiod for the non-slew times, and weighted by the total counts in the corresponding time period using addrmf. An average response file is needed becuase a spectral fit using the pre-slew DRM will introduce some errors in both a spectral shape and a normalization if the PHA file contains a lot of the slew/post-slew time interval.
- 3) For fits to more complicated models (e.g. a power-law over a cutoff power-law), the BAT team has decided to require a chi-square improvement of more than 6 for each extra dof.
Time averaged spectrum fit using the average DRM
Power-law model
Multiple GTIs in the spectrum
tstart tstop
-0.388000 2.728800
3.600000 310.464000

Spectral model in power-law:
------------------------------------------------------------
Parameters  : value       lower 90%   higher 90%
Photon index: -1.62864     ( -0.0541709   0.0540294 )
Norm@50keV  : 3.19001E-03    ( -8.62583e-05   8.61768e-05 )
------------------------------------------------------------
#Fit statistic : Chi-Squared =          60.34 using 59 PHA bins.
# Reduced chi-squared =          1.059 for     57 degrees of freedom
# Null hypothesis probability =   3.558693e-01

Photon flux (15-150 keV)    in 310 sec: 0.413666 ( -0.012391  0.012439 ) ph/cm2/s
Energy fluence (15-150 keV)             : 9.21915e-06 ( -2.6217e-07  2.62668e-07 ) ergs/cm2
Cutoff power-law model

Multiple GTIs in the spectrum
tstart tstop
-0.388000 2.728800
3.600000 310.464000
Spectral model in the cutoff power-law:
------------------------------------------------------------
Parameters  : value       lower 90%   higher 90%
Photon index: -1.6267     ( -0.0719356   0.129511 )
Epeak [keV] : 9999.36      ( -9999.35 -9999.36 )
Norm@50keV  : 3.19705E-03    ( -8.66233e-05   0.000496574 )
------------------------------------------------------------
#Fit statistic : Chi-Squared =          60.37 using 59 PHA bins.
# Reduced chi-squared =          1.078 for     56 degrees of freedom
# Null hypothesis probability =   3.209149e-01

Photon flux (15-150 keV)    in 310 sec: 0.416287 ( -0.014745  0.00977 ) ph/cm2/s
Energy fluence (15-150 keV)             : 9.27622e-06 ( -1.93382e-07  1.98613e-07 ) ergs/cm2
1-s peak spectrum fit
Power-law model
Time interval is from   13.412 sec. to   14.412 sec.

Spectral model in power-law:
------------------------------------------------------------
Parameters  : value       lower 90%   higher 90%
Photon index: -1.29248     ( -0.053072   0.0530887 )
Norm@50keV  : 0.116061    ( -0.00346143   0.00346141 )
------------------------------------------------------------
#Fit statistic : Chi-Squared =          47.20 using 59 PHA bins.
# Reduced chi-squared =         0.8281 for     57 degrees of freedom
# Null hypothesis probability =   8.192800e-01

Photon flux (15-150 keV)    in 1 sec: 0.439072 (    ) ph/cm2/s
Energy fluence (15-150 keV)             : 1.14916e-06 ( -3.72747e-08  3.73188e-08 ) ergs/cm2
Cutoff power-law model
Time interval is from   13.412 sec. to   14.412 sec.
Spectral model in the cutoff power-law:
------------------------------------------------------------
Parameters  : value       lower 90%   higher 90%
Photon index: -0.917261     ( -0.216402   0.227248 )
Epeak [keV] : 161.283      ( -40.4108 135.387 )
Norm@50keV  : 0.172109    ( -0.0341799   0.0449787 )
------------------------------------------------------------
#Fit statistic : Chi-Squared =          38.17 using 59 PHA bins.
# Reduced chi-squared =         0.6815 for     56 degrees of freedom
# Null hypothesis probability =   9.672778e-01

Photon flux (15-150 keV)    in 1 sec: 13.5576 ( -0.4581  0.4589 ) ph/cm2/s
Energy fluence (15-150 keV)             : 1.12694e-06 ( -3.98888e-08  3.97622e-08 ) ergs/cm2
Time-resolved spectra
Distribution
T90 vs. Hardness ratio plot
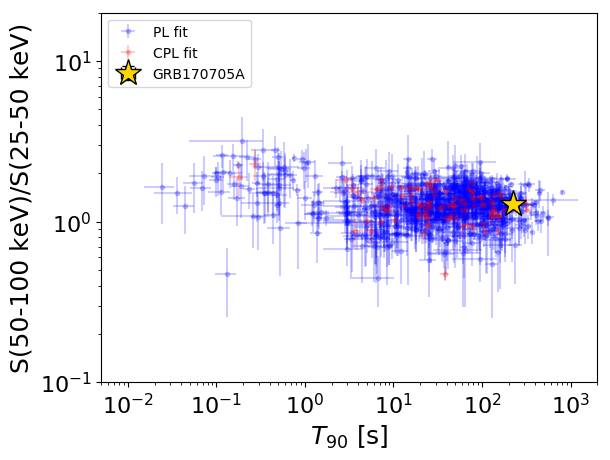
T90                                   = 223.204 sec.
Hardness ratio (energy fluence ratio) = 1.29359971314
S(15-50 keV) vs. S(50-150 keV) plot
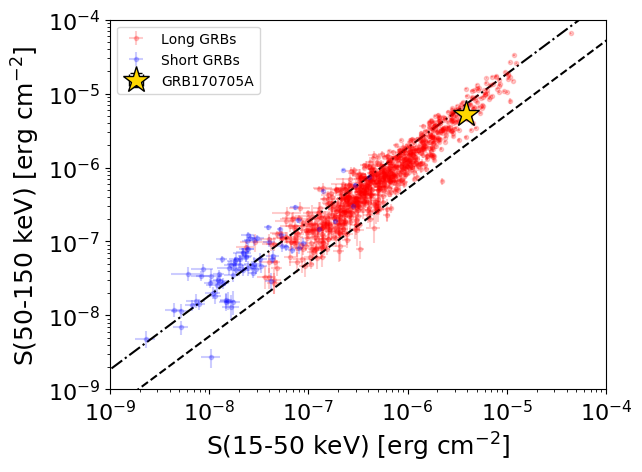
S(15-50 keV)  = 3.845595e-06
S(50-150 keV) = 5.373505e-06
The dash-dotted line and the dashed line traces the fluences calculated from the Band function with Epeak = 15 and 150 keV, respectively. Both lines assume a canonical values of alpha = -1 and beta = -2.5.
Mask shadow pattern
IMX = -4.678128887453081E-01, IMY = 2.356490593944571E-01
Spacecraft aspect plot
Bright source in the pre-burst/pre-slew/post-slew images
Pre-burst image of 15-350 keV band
Time interval of the image:
-573.299410 -558.717300
-239.400000 -0.388000

# RAcent  DECcent POSerr Theta    Phi  PeakCts   SNR AngSep     Name
#  [deg]    [deg]    ['] [deg]  [deg]                   [']
254.3725  35.3059    4.0  29.9   31.7   0.8338   2.9    4.7	Her X-1
290.6135  46.8464    3.7  55.8   10.6   4.2911   3.2 ------	UNKNOWN
272.3863  51.0986    2.7  43.7    6.0   1.7228   4.2 ------	UNKNOWN
248.4076  50.7397    2.2  29.2   -1.1   1.3566   5.3 ------	UNKNOWN
227.6955  43.7738    2.2  14.2  -13.6   1.1573   5.2 ------	UNKNOWN
175.8572  -0.1286    2.5  51.3 -160.8   2.9263   4.5 ------	UNKNOWN
Pre-slew background subtracted image of 15-350 keV band
Time interval of the image:
-0.388000 2.728800
3.600000 11.900590

# RAcent  DECcent POSerr Theta    Phi  PeakCts   SNR AngSep     Name
#  [deg]    [deg]    ['] [deg]  [deg]                   [']
254.6794  35.2966    0.0  30.2   31.7  -0.1467  -1.8   11.2	Her X-1
240.1637  19.5068    2.4  22.8   75.4   0.3330   4.7 ------	UNKNOWN
191.7084  18.2972    0.2  27.6 -153.3   3.5019  55.1 ------	UNKNOWN
185.5470  77.6668    2.3  48.5  -50.2   1.2935   5.0 ------	UNKNOWN
Post-slew image of 15-350 keV band
Time interval of the image:
61.300620 837.757800
840.600000 962.630900

# RAcent  DECcent POSerr Theta    Phi  PeakCts   SNR AngSep     Name
#  [deg]    [deg]    ['] [deg]  [deg]                   [']
209.2576  -6.0998    2.5  29.9  122.3   5.0234   4.6 ------	UNKNOWN
242.0803  54.4402    3.3  52.6   13.5   8.8532   3.5 ------	UNKNOWN
245.9800  57.8175    3.4  55.9   10.7  12.8652   3.4 ------	UNKNOWN
191.7677  18.2917    1.7   0.1   95.2   4.4196   6.7 ------	UNKNOWN
163.7670  -2.2846    3.2  34.4 -144.8   3.2391   3.6 ------	UNKNOWN
180.5727  67.6817    3.1  49.9  -26.3   5.9703   3.7 ------	UNKNOWN
147.8775  21.7289    5.0  41.2  -98.5   7.7902   2.4 ------	UNKNOWN
147.0422   5.6049    3.2  45.4 -121.3  11.4455   3.7 ------	UNKNOWN
150.5345  52.6776    3.9  46.9  -54.0  10.6829   3.0 ------	UNKNOWN
150.4767  53.4697    2.9  47.4  -53.1  15.5017   4.0 ------	UNKNOWN