Analysis Summary
Notes:
- 1) No attempt has been made to eliminate the non-significant decimal places.
- 2) This batgrbproduct analysis is done using the HEASARC data.
- 3) This batgrbproduct analysis is using the flight position for the mask-weighting calculation.
======================================================================
BAT GRB EVENT DATA PROCESSING REPORT
Process Script Ver: batgrbproduct v2.46
Process Start Time: Wed Aug 2 14:57:46 EDT 2017
Host Name: bat1
Current Working Dir: /local/data/bat1/alien/Swift_3rdBATcatalog/event/batevent_reproc/trigger761119
======================================================================
Trigger: 00761119 Segment: 000
BAT Trigger Time: 521340363.968 [s; MET]
Trigger Stop: 521340368.064 [s; MET]
UTC: 2017-07-10T00:45:44.623200 [includes UTCF correction]
Where From?: TDRSS position message
BAT
RA: 231.81245248794 Dec: -38.5470762478186 [deg; J2000]
Catalogged Source?: NO
Point Source?: YES
GRB Indicated?: YES [ by BAT flight software ]
Image S/N Ratio: 6.88
Image Trigger?: NO
Rate S/N Ratio: 7.87400787401181 [ if not an image trigger ]
Image S/N Ratio: 6.88
Analysis Position: [ source = BAT ]
RA: 231.81245248794 Dec: -38.5470762478186 [deg; J2000]
Refined Position: [ source = BAT pre-slew burst ]
RA: 231.849844108435 Dec: -38.5227185855827 [deg; J2000]
{ 15h 27m 24.0s , -38d 31' 21.8" }
+/- 2.51906033302231 [arcmin] (estimated 90% radius based on SNR)
+/- 1.31900280964353 [arcmin] (formal 1-sigma fit error)
SNR: 8.12681594328101
Angular difference between the analysis and refined position is 2.283777 arcmin
Partial Coding Fraction: 0.2285156 [ including projection effects ]
Duration
T90: 33.1200000047684 +/- 10.8611601354231
Measured from: 0.568000018596649
to: 33.688000023365 [s; relative to TRIGTIME]
T50: 15.9679999947548 +/- 7.83892645512002
Measured from: 3.19200003147125
to: 19.160000026226 [s; relative to TRIGTIME]
Fluence
Peak Flux (peak 1 second)
Measured from: 0.491999983787537
to: 1.49199998378754 [s; relative to TRIGTIME]
Total Fluence
Measured from: 0.167999982833862
to: 36.7919999957085 [s; relative to TRIGTIME]
Band 1 Band 2 Band 3 Band 4
15-25 25-50 50-100 100-350 keV
Total 0.419266 0.497776 0.326038 0.055708
0.085266 0.084466 0.074213 0.067624 [error]
Peak 0.016995 0.029650 0.047331 0.034167
0.014286 0.013706 0.013653 0.011141 [error]
[ fluence units of on-axis counts / fully illuminated detector ]
======================================================================
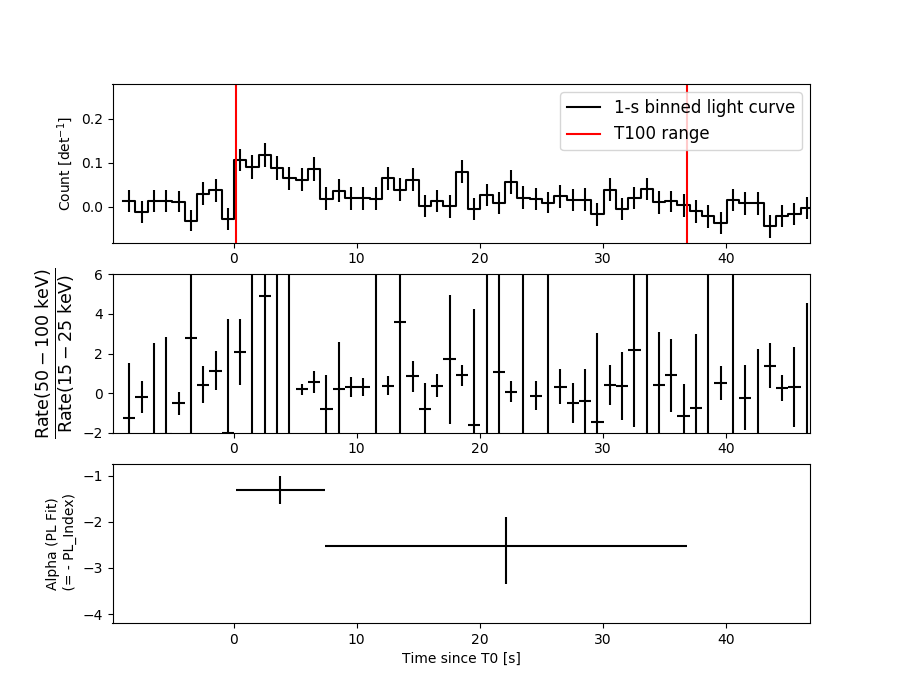
====== Table of the duration information =============================
Value tstart tstop
T100 36.624 0.168 36.792
T90 33.120 0.568 33.688
T50 15.968 3.192 19.160
Peak 1.000 0.492 1.492
====== Spectral Analysis Summary =====================================
Model : spectral model: simple power-law (PL) and cutoff power-law (CPL)
Ph_index : photon index: E^{Ph_index}
Ph_90err : 90% error of the photon index
Epeak : Epeak in keV
Epeak_90err: 90% error of Epeak
Norm : normalization at 50 keV in both the PL model and CPL model
Nomr_90err : 90% error of the normalization
chi2 : Chi-Squared
dof : degree of freedo
=== Time-averaged spectral analysis ===
(Best model with acceptable fit: PL)
Model Ph_index Ph_90err_low Ph_90err_hi Epeak Epeak_90err_low Epeak_90err_hi Norm Nomr_90err_low Norm_90err_hi chi2 dof
PL -1.892 -0.374 0.344 - - - 2.27e-03 -5.23e-04 4.99e-04 48.730 57
CPL -1.892 N/A N/A 9999.160 N/A N/A 2.27e-03 N/A N/A 48.730 56
=== 1-s peak spectral analysis ===
(Best model with acceptable fit: PL)
Model Ph_index Ph_90err_low Ph_90err_hi Epeak Epeak_90err_low Epeak_90err_hi Norm Nomr_90err_low Norm_90err_hi chi2 dof
PL -0.894 -0.601 0.686 - - - 8.43e-03 -3.08e-03 2.85e-03 43.260 57
CPL -0.896 -0.596 0.703 9999.350 -9999.350 -9999.350 8.50e-03 -2.83e-03 6.63e-02 43.260 56
=== Fluence/Peak Flux Summary ===
Model Band1 Band2 Band3 Band4 Band5 Total
15-25 25-50 50-100 100-350 15-150 15-350 keV
Fluence PL 1.54e-07 2.23e-07 2.40e-07 4.82e-07 7.65e-07 1.10e-06 erg/cm2
90%_error_low -4.12e-08 -4.09e-08 -7.35e-08 -2.43e-07 -1.67e-07 -3.32e-07 erg/cm2
90%_error_hi 4.31e-08 4.09e-08 7.51e-08 3.71e-07 1.73e-07 4.31e-07 erg/cm2
Peak flux PL 1.95e-01 2.82e-01 3.03e-01 6.08e-01 9.68e-01 1.39e+00 ph/cm2/s
90%_error_low -1.25e-01 -1.33e-01 -9.80e-02 -3.50e-01 -3.31e-01 -4.52e-01 ph/cm2/s
90%_error_hi 1.78e-01 1.31e-01 9.63e-02 5.89e-01 3.39e-01 5.06e-01 ph/cm2/s
Fluence CPL 1.55e-07 2.20e-07 2.40e-07 5.29e-07 7.70e-07 1.09e-06 erg/cm2
90%_error_low -4.38e-08 -3.95e-08 -8.02e-08 -4.07e-07 -1.78e-07 -4.84e-07 erg/cm2
90%_error_hi 4.47e-08 5.56e-08 8.21e-08 1.53e-07 1.29e-07 2.16e-07 erg/cm2
Peak flux CPL 2.10e-01 2.82e-01 3.02e-01 6.35e-01 9.73e-01 1.41e+00 ph/cm2/s
90%_error_low N/A -1.42e-01 -9.67e-02 N/A -3.44e-01 -6.79e-01 ph/cm2/s
90%_error_hi N/A 1.31e-01 1.28e-01 N/A 3.38e-01 4.80e-01 ph/cm2/s
======================================================================
Image
Pre-slew 15.0-350.0 keV image (Event data)
#   RAcent    DECcent   POSerr    Theta     Phi              Peak Cts       SNR   Name
  231.8498   -38.5227   0.0235    35.3359   125.6589         1.2712620      8.127 TRIG_00761119

Foreground time interval of the image:
  0.168  36.792 (delta_t =  36.624 [sec])
Background time interval of the image:
-606.567 -589.275 (delta_t =  17.292 [sec])
-239.968   0.168 (delta_t = 240.136 [sec])
Light Curves
Note: The mask-weighted lightcurves have units of either count/det or counts/sec/det, where a det is 0.4 x 0.4 = 0.16 sq cm.
Full-time range; 1 s binning
Other quick-look light curves:
- 64 ms binning (zoomed)
- 16 ms binning (zoomed)
- 8 ms binning (zoomed)
- 2 ms binning (zoomed)
- SN=5 or 10 s binning (full-time range)
- Raw light curve
Spectra
- 64 ms binning (zoomed)
- 16 ms binning (zoomed)
- 8 ms binning (zoomed)
- 2 ms binning (zoomed)
- SN=5 or 10 s binning (full-time range)
- Raw light curve
Spectra
Notes:
- 1) The fitting includes the systematic errors.
- 2) When the burst includes telescope slew time periods, the fitting uses an average response file made from multiple 5-s response files through out the slew time plus single time preiod for the non-slew times, and weighted by the total counts in the corresponding time period using addrmf. An average response file is needed becuase a spectral fit using the pre-slew DRM will introduce some errors in both a spectral shape and a normalization if the PHA file contains a lot of the slew/post-slew time interval.
- 3) For fits to more complicated models (e.g. a power-law over a cutoff power-law), the BAT team has decided to require a chi-square improvement of more than 6 for each extra dof.
Time averaged spectrum fit using the average DRM
Power-law model

Time interval is from    0.168 sec. to   36.792 sec.

Spectral model in power-law:
------------------------------------------------------------
Parameters  : value       lower 90%   higher 90%
Photon index: -1.89223     ( -0.374249   0.344352 )
Norm@50keV  : 2.27124E-03    ( -0.000522515   0.000498601 )
------------------------------------------------------------
#Fit statistic : Chi-Squared =          48.73 using 59 PHA bins.
# Reduced chi-squared =         0.8549 for     57 degrees of freedom
# Null hypothesis probability =   7.740993e-01

Photon flux (15-150 keV)    in 36.62 sec: 0.324897 ( -0.06001  0.060058 ) ph/cm2/s
Energy fluence (15-150 keV)             : 7.64765e-07 ( -1.67443e-07  1.72707e-07 ) ergs/cm2
Cutoff power-law model
Time interval is from    0.168 sec. to   36.792 sec.
Spectral model in the cutoff power-law:
------------------------------------------------------------
Parameters  : value       lower 90%   higher 90%
Photon index: -1.89247     (       )
Epeak [keV] : 9999.16      (   )
Norm@50keV  : 2.27217E-03    (     )
------------------------------------------------------------
#Fit statistic : Chi-Squared =          48.73 using 59 PHA bins.
# Reduced chi-squared =         0.8702 for     56 degrees of freedom
# Null hypothesis probability =   7.439363e-01

Photon flux (15-150 keV)    in 36.62 sec: 0.325938 ( -0.063032  0.060564 ) ph/cm2/s
Energy fluence (15-150 keV)             : 7.70049e-07 ( -1.78081e-07  1.28824e-07 ) ergs/cm2
1-s peak spectrum fit
Power-law model
Time interval is from    0.492 sec. to    1.492 sec.

Spectral model in power-law:
------------------------------------------------------------
Parameters  : value       lower 90%   higher 90%
Photon index: -0.893892     ( -0.601316   0.686477 )
Norm@50keV  : 8.43425E-03    ( -0.0030785   0.00285363 )
------------------------------------------------------------
#Fit statistic : Chi-Squared =          43.26 using 59 PHA bins.
# Reduced chi-squared =         0.7590 for     57 degrees of freedom
# Null hypothesis probability =   9.105124e-01

Photon flux (15-150 keV)    in 1 sec: 0.968013 ( -0.330753  0.339177 ) ph/cm2/s
Energy fluence (15-150 keV)             : 9.48899e-08 ( -3.07187e-08  3.0852e-08 ) ergs/cm2
Cutoff power-law model
Time interval is from    0.492 sec. to    1.492 sec.
Spectral model in the cutoff power-law:
------------------------------------------------------------
Parameters  : value       lower 90%   higher 90%
Photon index: -0.896011     ( -0.599183   0.700208 )
Epeak [keV] : 9999.35      ( -9999.36 -9999.36 )
Norm@50keV  : 8.50147E-03    ( -0.00282104   0.0663482 )
------------------------------------------------------------
#Fit statistic : Chi-Squared =          43.26 using 59 PHA bins.
# Reduced chi-squared =         0.7725 for     56 degrees of freedom
# Null hypothesis probability =   8.934256e-01

Photon flux (15-150 keV)    in 1 sec: 0.972524 ( -0.343549  0.338016 ) ph/cm2/s
Energy fluence (15-150 keV)             : 9.49883e-08 ( -3.12926e-08  3.11683e-08 ) ergs/cm2
Time-resolved spectra
Distribution
T90 vs. Hardness ratio plot
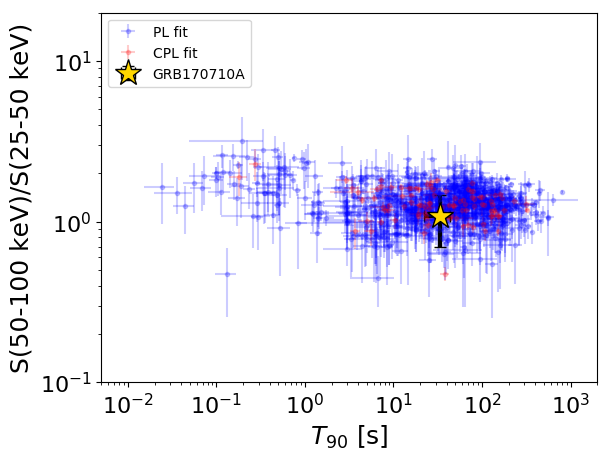
T90                                   = 33.12 sec.
Hardness ratio (energy fluence ratio) = 1.07760615956
S(15-50 keV) vs. S(50-150 keV) plot
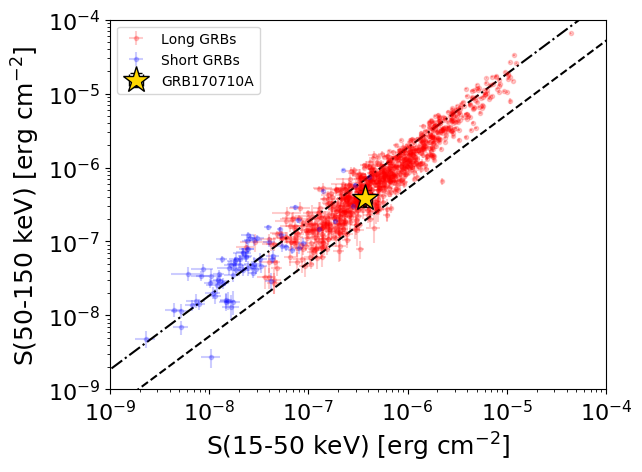
S(15-50 keV)  = 3.761862e-07
S(50-150 keV) = 3.885622e-07
The dash-dotted line and the dashed line traces the fluences calculated from the Band function with Epeak = 15 and 150 keV, respectively. Both lines assume a canonical values of alpha = -1 and beta = -2.5.
Mask shadow pattern
IMX = -4.133066594442243E-01, IMY = -5.760480846399125E-01
Spacecraft aspect plot
Bright source in the pre-burst/pre-slew/post-slew images
Pre-burst image of 15-350 keV band
Time interval of the image:
-606.567400 -589.275000
-239.968000 0.168000

# RAcent  DECcent POSerr Theta    Phi  PeakCts   SNR AngSep     Name
#  [deg]    [deg]    ['] [deg]  [deg]                   [']
244.9882 -15.6674    0.9  35.3   80.6   8.2998  12.5    1.7	Sco X-1
213.9751 -34.1794    3.7  25.0  147.7   0.8152   3.2 ------	UNKNOWN
215.9474  46.8908    4.1  56.7  -17.7   2.8655   2.8 ------	UNKNOWN
168.8013  -6.0153    2.5  40.3 -111.2   3.1666   4.6 ------	UNKNOWN
169.9136   2.2390    3.5  41.0  -98.4   3.4398   3.3 ------	UNKNOWN
160.5223 -18.1715    2.5  48.0 -129.1   5.3371   4.6 ------	UNKNOWN
Pre-slew background subtracted image of 15-350 keV band
Time interval of the image:
0.168000 36.792000

# RAcent  DECcent POSerr Theta    Phi  PeakCts   SNR AngSep     Name
#  [deg]    [deg]    ['] [deg]  [deg]                   [']
244.9864 -15.6760  411.0  35.3   80.6  -0.0054  -0.0    2.2	Sco X-1
231.8498 -38.5227    1.4  35.3  125.7   1.2711   8.1 ------	UNKNOWN
169.7641 -10.6872    2.4  38.9 -118.4   0.7451   4.8 ------	UNKNOWN
Post-slew image of 15-350 keV band
Time interval of the image:
112.532590 662.312000

# RAcent  DECcent POSerr Theta    Phi  PeakCts   SNR AngSep     Name
#  [deg]    [deg]    ['] [deg]  [deg]                   [']
170.4060 -60.7702    4.9  43.4 -140.3  -6.0024  -2.3    9.2	Cen X-3
186.9684 -62.7837   26.9  36.1 -145.7  -0.7328  -0.4    8.6	GX 301-2
244.9835 -15.6094    1.3  25.7   31.6  14.9639   9.2    1.9	Sco X-1
255.9906 -37.8151    1.5  19.0   96.5  12.7819   7.7    1.8	4U 1700-377
256.4214 -36.5592    5.5  19.6   93.0   3.4271   2.1    8.2	GX 349+2
262.8326 -24.7068    6.4  29.6   72.5   4.4921   1.8    9.9	GX 1+4
264.7328 -44.6006   19.8  25.2  115.7  -1.0887  -0.6    9.0	4U 1735-44
270.2837 -25.0787   10.0  35.1   80.1   4.0566   1.2    0.0	GX 5-1
270.3598 -25.8555 2591.3  34.7   81.3  -0.0127  -0.0    7.4	GRS 1758-258
276.1008 -30.3349    6.1  37.1   92.1  -7.8289  -1.9    9.3	H1820-303
263.0762 -33.7968    4.1  25.6   90.2   5.9022   2.9    4.9	GX 354-0
207.5189 -58.2888    3.2  25.2 -148.4   5.1359   3.6 ------	UNKNOWN
215.4495  16.0927    4.0  56.7  -17.7  20.5571   2.9 ------	UNKNOWN
136.6005 -67.4833    2.4  56.7 -151.8  39.4523   4.9 ------	UNKNOWN
163.3957 -52.3266    3.0  48.0 -129.0  26.9153   3.9 ------	UNKNOWN