Analysis Summary
Notes:
- 1) No attempt has been made to eliminate the non-significant decimal places.
- 2) This batgrbproduct analysis is done using the HEASARC data.
- 3) This batgrbproduct analysis is using the flight position for the mask-weighting calculation.
==========================================================================
           BAT GROUND-DETECTED GRB DATA PROCESSING REPORT
            (This burst occurred during telescope slew)
    Process Script Ver: batgrbproduct v2.46
    Process Start Time: Mon Jul 10 17:01:54 EDT 2017
             Host Name: bat1
   Current Working Dir: /local/data/bat1/alien/Swift_3rdBATcatalog/event/batevent_reproc/GRB170710B
======================================================================

  Trigger: 00086619      Segment: 001

  BAT Trigger Time: 521367025.6
               UTC: 20170710T08:10:06.251   [includes UTCF correction]
       Where From?: Ground analysis (best_duration.txt)
  NOTE: BAT trigger time for ground-detected burst during slew is the T100 start time.

  Analysis Position:   [ source = GCN ]
    RA: 43.12361967   Dec: 42.68415110  [deg; J2000]

  Refined Position:   [ source = BAT mosaic image ]
    RA: 43.1220545845827   Dec: 42.6787730091842  [deg; J2000]
        { 02h 52m 29.3s , +42d 40' 43.6" }
        +/- 0.810837503439 [arcmin] (estimated 90% radius based on SNR)
    SNR: 41.0458949592


  Angular difference between the analysis and refined position is 0.329987 arcmin

  Partial Coding Fraction: Unavailable because the burst occurred during slew.

  Duration
     T90: 54.4000000357628 +/- 1.6
        Measured from: 1.6
                   to: 56     [s; relative to TRIGTIME]
     T50: 30.4000000357628 +/- 1.6
        Measured from: 12.8
                   to: 43.2     [s; relative to TRIGTIME]


====== Table of the duration information =============================

        Value   tstart    tstop
T100   59.200    0.000   59.200
T90    54.400    1.600   56.000
T50    30.400   12.800   43.200
Peak    1.000    5.100    6.100


====== Spectral Analysis Summary =====================================

Model      : spectral model: simple power-law (PL) and cutoff power-law (CPL)
Ph_index   : photon index: E^{Ph_index}
Ph_90err   : 90% error of the photon index
Epeak      : Epeak in keV
Epeak_90err: 90% error of Epeak
Norm       : normalization at 50 keV in both the PL model and CPL model
Nomr_90err : 90% error of the normalization
chi2       : Chi-Squared
dof        : degree of freedo

=== Time-averaged spectral analysis ===
(Best model with acceptable fit: PL)

Model Ph_index Ph_90err_low Ph_90err_hi  Epeak  Epeak_90err_low  Epeak_90err_hi  Norm       Nomr_90err_low    Norm_90err_hi    chi2    dof
PL      -1.377    -0.077      0.077       -           -               -         4.14e-03     -1.71e-04          1.71e-04      50.650   57
CPL     -1.276    -0.150      0.269      356.927    -356.927      -356.927      4.62e-03     -6.20e-04          1.41e-03      50.810   56


=== 1-s peak spectral analysis ===
(Best model with acceptable fit: PL)

Model Ph_index Ph_90err_low Ph_90err_hi  Epeak  Epeak_90err_low  Epeak_90err_hi  Norm       Nomr_90err_low    Norm_90err_hi    chi2    dof
PL      -0.941     -0.223     0.233       -           -               -         1.01e-02     -1.45e-03          1.44e-03      49.550   57
CPL      0.632     -1.100     1.488       99.897     -22.806        89.152      4.62e-02     -4.62e-02          1.28e-01      42.940   56


=== Fluence/Peak Flux Summary ===

              Model    Band1     Band2     Band3     Band4     Band5     Total
                       15-25     25-50    50-100    100-350    15-150    15-350    keV
Fluence         PL   2.79e-07  5.53e-07  8.51e-07  2.87e-06  2.38e-06  4.55e-06   erg/cm2
      90%_error_low -2.23e-08 -2.61e-08 -4.36e-08 -3.21e-07 -1.07e-07 -3.49e-07   erg/cm2
      90%_error_hi   2.29e-08  2.59e-08  4.34e-08  3.49e-07  1.07e-07  3.71e-07   erg/cm2
Peak flux       PL   2.43e-01  3.42e-01  3.56e-01  6.82e-01  1.16e+00  1.62e+00   ph/cm2/s
      90%_error_low -6.61e-02 -6.19e-02 -5.16e-02 -1.84e-01 -1.67e-01 -2.39e-01   ph/cm2/s
      90%_error_hi   7.35e-02  6.14e-02  5.13e-02  2.23e-01  1.68e-01  2.47e-01   ph/cm2/s

Fluence        CPL   2.76e-07  5.55e-07  8.55e-07  2.65e-06  2.37e-06  4.34e-06   erg/cm2
      90%_error_low -2.79e-08 -2.64e-08 -4.45e-08 -9.02e-07 -1.17e-07 -9.01e-07   erg/cm2
      90%_error_hi   2.22e-08  2.89e-08  4.85e-08  3.00e-07  1.09e-07  3.29e-07   erg/cm2
Peak flux      CPL   1.52e-01  3.55e-01  4.22e-01  2.37e-01  1.09e+00  1.17e+00   ph/cm2/s
      90%_error_low -7.45e-02 -7.59e-02 -6.87e-02     N/A   -1.73e-01 -2.14e-01   ph/cm2/s
      90%_error_hi   8.99e-02  7.41e-02  7.08e-02     N/A    1.74e-01  2.76e-01   ph/cm2/s

======================================================================
Image
Note1: The mosaic image is made with timebin = 0.2 s; energybin = 15-350 keV
Note2: The mosaic image uses Galactic coordinate.
#RAcent DECcent POSerr Theta  Phi  Peak_Cts  SNR Name
43.122 42.679 0.002 32.546 154.957 0.074 41.046 UNKNOWN

Image time interval: 1.196 to 40.840 [sec]
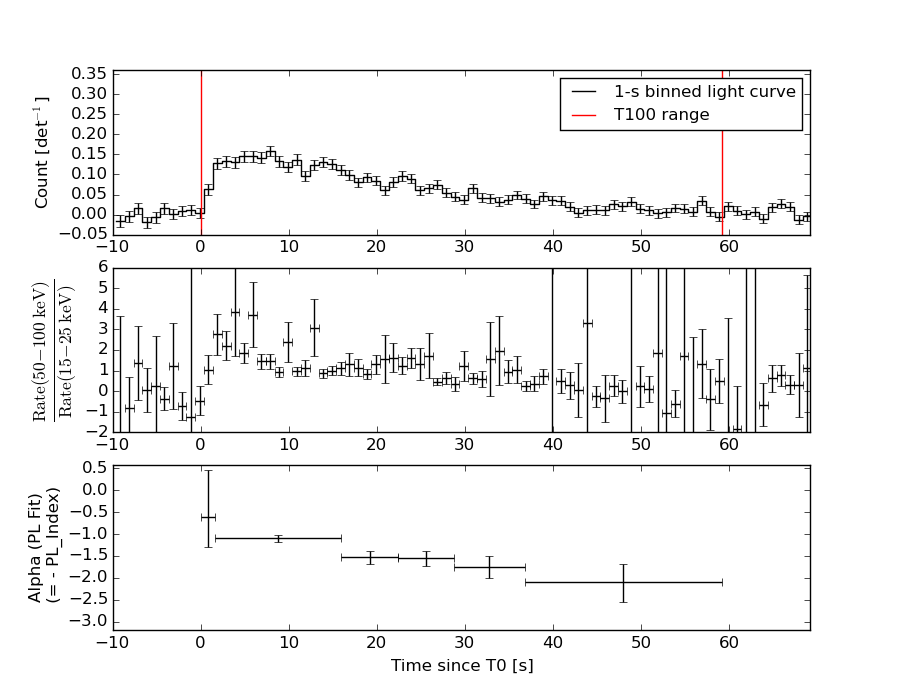
Light Curves
Note: The mask-weighted lightcurves have units of either count/det or counts/sec/det, where a det is 0.4 x 0.4 = 0.16 sq cm.
Best duration plot

Full-time range; 1 s binning
Other quick-look light curves:
- 64 ms binning (zoomed)
- 16 ms binning (zoomed)
- 8 ms binning (zoomed)
- 2 ms binning (zoomed)
- SN=5 or 10 s binning (full-time range)
- Raw light curve
Spectra
- 64 ms binning (zoomed)
- 16 ms binning (zoomed)
- 8 ms binning (zoomed)
- 2 ms binning (zoomed)
- SN=5 or 10 s binning (full-time range)
- Raw light curve
Spectra
Notes:
- 1) The fitting includes the systematic errors.
- 2) When the burst includes telescope slew time periods, the fitting uses an average response file made from multiple 5-s response files through out the slew time plus single time preiod for the non-slew times, and weighted by the total counts in the corresponding time period using addrmf. An average response file is needed becuase a spectral fit using the pre-slew DRM will introduce some errors in both a spectral shape and a normalization if the PHA file contains a lot of the slew/post-slew time interval.
- 3) For fits to more complicated models (e.g. a power-law over a cutoff power-law), the BAT team has decided to require a chi-square improvement of more than 6 for each extra dof.
Time averaged spectrum fit using the average DRM
Power-law model
Time interval is from    0.000 sec. to   59.200 sec.

Spectral model in power-law:
------------------------------------------------------------
Parameters  : value       lower 90%   higher 90%
Photon index: -1.37701     ( -0.0765902   0.0767227 )
Norm@50keV  : 4.14018E-03    ( -0.00017057   0.000170543 )
------------------------------------------------------------
#Fit statistic : Chi-Squared =          50.65 using 59 PHA bins.
# Reduced chi-squared =         0.8885 for     57 degrees of freedom
# Null hypothesis probability =   7.107980e-01

Photon flux (15-150 keV)    in 59.2 sec: 0.501637 ( -0.021906  0.021975 ) ph/cm2/s
Energy fluence (15-150 keV)             : 2.37997e-06 ( -1.06906e-07  1.07293e-07 ) ergs/cm2
Cutoff power-law model
Time interval is from    0.000 sec. to   59.200 sec.
Spectral model in the cutoff power-law:
------------------------------------------------------------
Parameters  : value       lower 90%   higher 90%
Photon index: -1.2759     ( -0.104592   0.314306 )
Epeak [keV] : 356.927      ( -668.612 -668.612 )
Norm@50keV  : 4.61772E-03    ( -0.000389556   0.00163962 )
------------------------------------------------------------
#Fit statistic : Chi-Squared =          50.81 using 59 PHA bins.
# Reduced chi-squared =         0.9073 for     56 degrees of freedom
# Null hypothesis probability =   6.710683e-01

Photon flux (15-150 keV)    in 59.2 sec: 0.500042 ( -0.023459  0.022349 ) ph/cm2/s
Energy fluence (15-150 keV)             : 2.37127e-06 ( -1.1713e-07  1.0884e-07 ) ergs/cm2
1-s peak spectrum fit
Power-law model

Time interval is from    5.100 sec. to    6.100 sec.

Spectral model in power-law:
------------------------------------------------------------
Parameters  : value       lower 90%   higher 90%
Photon index: -0.941008     ( -0.223252   0.233326 )
Norm@50keV  : 1.00626E-02    ( -0.0014515   0.00144065 )
------------------------------------------------------------
#Fit statistic : Chi-Squared =          49.55 using 59 PHA bins.
# Reduced chi-squared =         0.8693 for     57 degrees of freedom
# Null hypothesis probability =   7.478667e-01

Photon flux (15-150 keV)    in 1 sec: 1.15578 ( -0.167446  0.16834 ) ph/cm2/s
Energy fluence (15-150 keV)             : 1.11191e-07 ( -1.62093e-08  1.62825e-08 ) ergs/cm2
Cutoff power-law model
Time interval is from    5.100 sec. to    6.100 sec.
Spectral model in the cutoff power-law:
------------------------------------------------------------
Parameters  : value       lower 90%   higher 90%
Photon index: 0.631674     ( -1.10072   1.48683 )
Epeak [keV] : 99.8967      ( -22.7914 89.1667 )
Norm@50keV  : 4.62324E-02    ( -0.0462614   0.127498 )
------------------------------------------------------------
#Fit statistic : Chi-Squared =          42.94 using 59 PHA bins.
# Reduced chi-squared =         0.7668 for     56 degrees of freedom
# Null hypothesis probability =   8.999597e-01

Photon flux (15-150 keV)    in 1 sec: 1.08950 ( -0.173046  0.17446 ) ph/cm2/s
Energy fluence (15-150 keV)             : 1.05167e-07 ( -1.72951e-08  1.72749e-08 ) ergs/cm2
Time-resolved spectra
Distribution
T90 vs. Hardness ratio plot
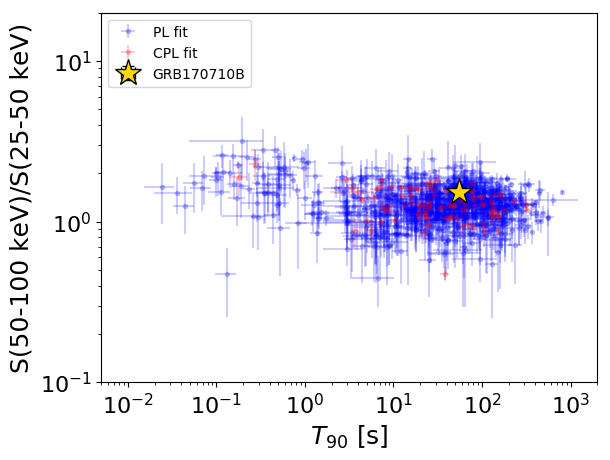
T90                                   = 54.4 sec.
Hardness ratio (energy fluence ratio) = 1.54006794619
S(15-50 keV) vs. S(50-150 keV) plot
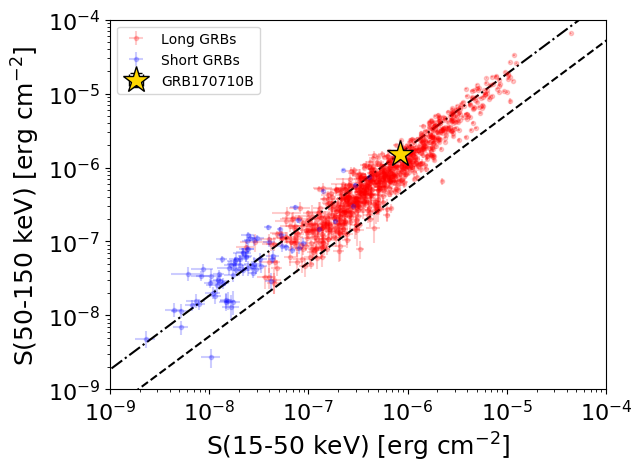
S(15-50 keV)  = 8.315351e-07
S(50-150 keV) = 1.5484625e-06
The dash-dotted line and the dashed line traces the fluences calculated from the Band function with Epeak = 15 and 150 keV, respectively. Both lines assume a canonical values of alpha = -1 and beta = -2.5.
Mask shadow pattern
Mask shadow pattern unavailable because this burst occurs during telescope slews.Spacecraft aspect plot