Analysis Summary
Notes:
- 1) No attempt has been made to eliminate the non-significant decimal places.
- 2) This batgrbproduct analysis is done using the HEASARC data.
- 3) This batgrbproduct analysis is using the flight position for the mask-weighting calculation.
======================================================================
                  BAT GRB EVENT DATA PROCESSING REPORT
    Process Script Ver: batgrbproduct v2.46
    Process Start Time: Wed Aug  2 14:51:10 EDT 2017
             Host Name: bat1
   Current Working Dir: /local/data/bat1/alien/Swift_3rdBATcatalog/event/batevent_reproc/trigger762535
======================================================================

  Trigger: 00762535      Segment: 000

  BAT Trigger Time: 521727952   [s; MET]
      Trigger Stop: 521728272   [s; MET]
               UTC: 2017-07-14T12:25:32.632340    [includes UTCF correction]
       Where From?: TDRSS position message

  BAT
    RA: 34.3206186211749   Dec: 1.98718338129198  [deg; J2000]

     Catalogged Source?: NO
     Point Source?:      YES
     GRB Indicated?:     NO    [ by BAT flight software ]
     Image S/N Ratio:    8.63
     Image Trigger?:     YES
     Rate S/N Ratio:     0  [ if not an image trigger ]
     Image S/N Ratio:    8.63

  Analysis Position:   [ source = BAT ]
    RA: 34.3206186211749   Dec: 1.98718338129198  [deg; J2000]

  Refined Position:   [ source = BAT pre-slew burst ]
    RA: 34.3207834638727   Dec: 1.96207813444826  [deg; J2000]
        { 02h 17m 17.0s , +01d 57' 43.5" }
         +/- 2.18117139186743 [arcmin] (estimated 90% radius based on SNR)
         +/- 0.752658462098504 [arcmin] (formal 1-sigma fit error)
    SNR: 9.98333900529056

  Angular difference between the analysis and refined position is 1.506347 arcmin

  Partial Coding Fraction: 0.6171875    [ including projection effects ]

  Duration
     T90: 459.216000020504 +/- 94.6098907172477
        Measured from: -32.9039999842644
                   to: 426.31200003624     [s; relative to TRIGTIME]
     T50: 258.192000031471 +/- 65.4396307404171
        Measured from: 47.5759999752045
                   to: 305.768000006676     [s; relative to TRIGTIME]


  Fluence
     Peak Flux  (peak 1 second)
        Measured from: 0.220000028610229
                   to: 1.22000002861023     [s; relative to TRIGTIME]
     Total Fluence
        Measured from: -74.3600000143051
                   to: 464.231999993324     [s; relative to TRIGTIME]

             Band 1     Band 2     Band 3     Band 4
              15-25      25-50     50-100    100-350     keV
 Total     1.553832   1.974808   1.214273   0.351318
           0.146770   0.151900   0.134759   0.122159 [error]
 Peak      0.011592   0.020263   0.001588   0.018516
           0.006995   0.007354   0.006165   0.005450 [error]

     [ fluence units of on-axis counts / fully illuminated detector ]

======================================================================


====== Table of the duration information =============================

        Value   tstart    tstop
T100  538.592  -74.360  464.232
T90   459.216  -32.904  426.312
T50   258.192   47.576  305.768
Peak    1.000    0.220    1.220


====== Spectral Analysis Summary =====================================

Model      : spectral model: simple power-law (PL) and cutoff power-law (CPL)
Ph_index   : photon index: E^{Ph_index}
Ph_90err   : 90% error of the photon index
Epeak      : Epeak in keV
Epeak_90err: 90% error of Epeak
Norm       : normalization at 50 keV in both the PL model and CPL model
Nomr_90err : 90% error of the normalization
chi2       : Chi-Squared
dof        : degree of freedo

=== Time-averaged spectral analysis ===
(Best model with acceptable fit: N/A)

Model Ph_index Ph_90err_low Ph_90err_hi  Epeak  Epeak_90err_low  Epeak_90err_hi  Norm       Nomr_90err_low    Norm_90err_hi    chi2    dof
PL      -1.673    -0.172      0.168       -           -               -         5.73e-04     -5.81e-05          5.72e-05      54.200   57
CPL     -1.495    -0.343      0.719      132.203    -107.204      -132.203      7.14e-04     -3.07e-04          9.85e-04      53.980   56


=== 1-s peak spectral analysis ===
(Best model with acceptable fit: N/A)

Model Ph_index Ph_90err_low Ph_90err_hi  Epeak  Epeak_90err_low  Epeak_90err_hi  Norm       Nomr_90err_low    Norm_90err_hi    chi2    dof
PL      -1.967     -1.466     1.462       -           -               -         2.28e-03     -2.28e-03          1.51e-03      55.770   57
CPL     -1.956      N/A       N/A        9999.360      N/A           N/A         2.29e-03        N/A               N/A         55.780   56


=== Fluence/Peak Flux Summary ===

              Model    Band1     Band2     Band3     Band4     Band5     Total
                       15-25     25-50    50-100    100-350    15-150    15-350    keV
Fluence         PL   4.64e-07  7.67e-07  9.62e-07  2.40e-06  2.87e-06  4.59e-06   erg/cm2
      90%_error_low -6.67e-08 -6.99e-08 -1.33e-07 -6.29e-07 -3.07e-07 -7.58e-07   erg/cm2
      90%_error_hi   6.91e-08  6.99e-08  1.33e-07  7.66e-07  3.12e-07  8.70e-07   erg/cm2
Peak flux       PL   1.47e-01  1.13e-01  5.75e-02  4.23e-02  3.37e-01  3.60e-01   ph/cm2/s
      90%_error_low -1.47e-01 -1.13e-01 -4.74e-02 -4.23e-02 -1.68e-01 -1.84e-01   ph/cm2/s
      90%_error_hi   1.08e-01  5.66e-02  5.80e-02  2.11e-01  1.68e-01  1.42e+00   ph/cm2/s

Fluence        CPL   4.53e-07  7.83e-07  9.66e-07  1.76e-06  2.81e-06  3.96e-06   erg/cm2
      90%_error_low -7.81e-08 -8.19e-08 -1.36e-07 -1.13e-06 -3.55e-07 -1.20e-06   erg/cm2
      90%_error_hi   7.71e-08  9.09e-08  1.38e-07  7.96e-07  3.48e-07  8.97e-07   erg/cm2
Peak flux      CPL   1.18e-01  8.07e-02  3.79e-02  2.97e-02  2.50e-01  2.68e-01   ph/cm2/s
      90%_error_low     N/A   -8.07e-02     N/A   -2.97e-02     N/A   -2.68e-01   ph/cm2/s
      90%_error_hi      N/A    1.18e-01     N/A    3.52e-02     N/A    2.60e-01   ph/cm2/s

======================================================================
Image
Pre-slew 15.0-350.0 keV image (Event data)
#   RAcent    DECcent   POSerr    Theta     Phi              Peak Cts       SNR   Name
   34.3208     1.9621   0.0193    24.0888   112.4001         3.5461153      9.983 TRIG_00762535

Foreground time interval of the image:
-11.899 336.701 (delta_t = 348.600 [sec])
Background time interval of the image:
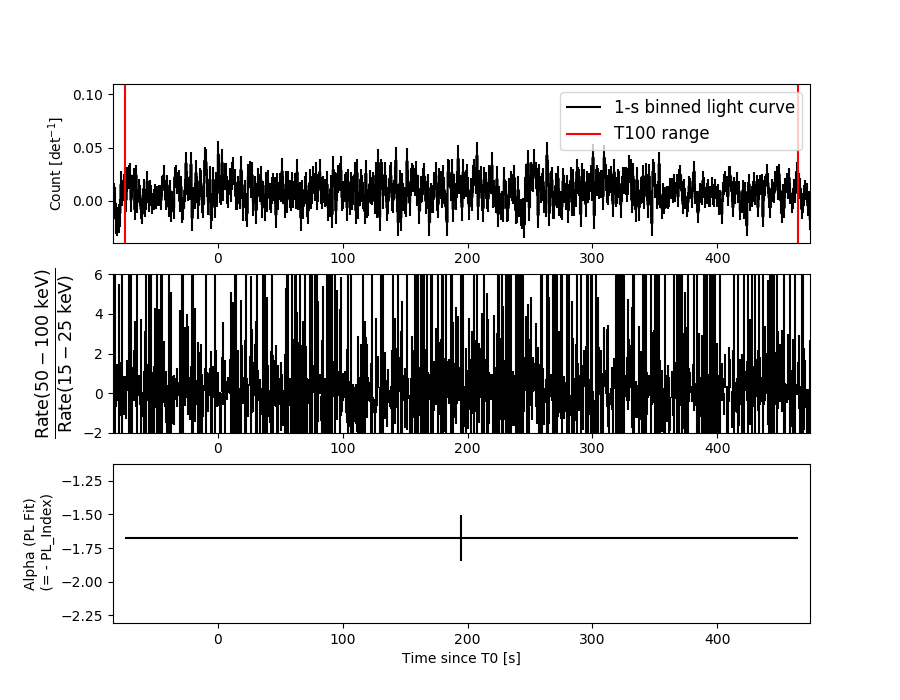
Light Curves
Note: The mask-weighted lightcurves have units of either count/det or counts/sec/det, where a det is 0.4 x 0.4 = 0.16 sq cm.
Full-time range; 1 s binning
Other quick-look light curves:
- 64 ms binning (zoomed)
- 16 ms binning (zoomed)
- 8 ms binning (zoomed)
- 2 ms binning (zoomed)
- SN=5 or 10 s binning (full-time range)
- Raw light curve
Spectra
- 64 ms binning (zoomed)
- 16 ms binning (zoomed)
- 8 ms binning (zoomed)
- 2 ms binning (zoomed)
- SN=5 or 10 s binning (full-time range)
- Raw light curve
Spectra
Notes:
- 1) The fitting includes the systematic errors.
- 2) When the burst includes telescope slew time periods, the fitting uses an average response file made from multiple 5-s response files through out the slew time plus single time preiod for the non-slew times, and weighted by the total counts in the corresponding time period using addrmf. An average response file is needed becuase a spectral fit using the pre-slew DRM will introduce some errors in both a spectral shape and a normalization if the PHA file contains a lot of the slew/post-slew time interval.
- 3) For fits to more complicated models (e.g. a power-law over a cutoff power-law), the BAT team has decided to require a chi-square improvement of more than 6 for each extra dof.
Time averaged spectrum fit using the average DRM
Power-law model
Time interval is from  -74.360 sec. to  464.232 sec.

Spectral model in power-law:
------------------------------------------------------------
Parameters  : value       lower 90%   higher 90%
Photon index: -1.67345     ( -0.172309   0.167627 )
Norm@50keV  : 5.73229E-04    ( -5.81432e-05   5.72335e-05 )
------------------------------------------------------------
#Fit statistic : Chi-Squared =          54.20 using 59 PHA bins.
# Reduced chi-squared =         0.9509 for     57 degrees of freedom
# Null hypothesis probability =   5.806704e-01

Photon flux (15-150 keV)    in 538.6 sec: 7.54419E-02 ( -0.0068863  0.0068932 ) ph/cm2/s
Energy fluence (15-150 keV)             : 2.86534e-06 ( -3.06777e-07  3.11945e-07 ) ergs/cm2
Cutoff power-law model

Time interval is from  -74.360 sec. to  464.232 sec.
Spectral model in the cutoff power-law:
------------------------------------------------------------
Parameters  : value       lower 90%   higher 90%
Photon index: -1.49455     ( -0.34264   0.719334 )
Epeak [keV] : 132.203      ( -107.404 -132.402 )
Norm@50keV  : 7.13889E-04    ( -0.000306589   0.000985055 )
------------------------------------------------------------
#Fit statistic : Chi-Squared =          53.98 using 59 PHA bins.
# Reduced chi-squared =         0.9640 for     56 degrees of freedom
# Null hypothesis probability =   5.516383e-01

Photon flux (15-150 keV)    in 538.6 sec: 7.47746E-02 ( -0.0073027  0.0072512 ) ph/cm2/s
Energy fluence (15-150 keV)             : 2.81499e-06 ( -3.55037e-07  3.47846e-07 ) ergs/cm2
1-s peak spectrum fit
Power-law model
Time interval is from    0.220 sec. to    1.220 sec.

Spectral model in power-law:
------------------------------------------------------------
Parameters  : value       lower 90%   higher 90%
Photon index: -1.96655     ( -1.46531   1.46268 )
Norm@50keV  : 2.28019E-03    ( -0.00227899   0.00151047 )
------------------------------------------------------------
#Fit statistic : Chi-Squared =          55.77 using 59 PHA bins.
# Reduced chi-squared =         0.9785 for     57 degrees of freedom
# Null hypothesis probability =   5.211329e-01

Photon flux (15-150 keV)    in 1 sec: 0.336889 ( -0.167646  0.167631 ) ph/cm2/s
Energy fluence (15-150 keV)             : 2.09889e-08 ( -1.28744e-08  1.53825e-08 ) ergs/cm2
Cutoff power-law model
Time interval is from    0.220 sec. to    1.220 sec.
Spectral model in the cutoff power-law:
------------------------------------------------------------
Parameters  : value       lower 90%   higher 90%
Photon index: -1.95594     (       )
Epeak [keV] : 9999.36      (   )
Norm@50keV  : 2.29139E-03    (     )
------------------------------------------------------------
#Fit statistic : Chi-Squared =          55.78 using 59 PHA bins.
# Reduced chi-squared =         0.9960 for     56 degrees of freedom
# Null hypothesis probability =   4.833302e-01

Photon flux (15-150 keV)    in 1 sec: 0.250353 (    ) ph/cm2/s
Energy fluence (15-150 keV)             : 1.69348e-08 ( -1.68792e-08  1.48478e-08 ) ergs/cm2
Time-resolved spectra
Distribution
T90 vs. Hardness ratio plot
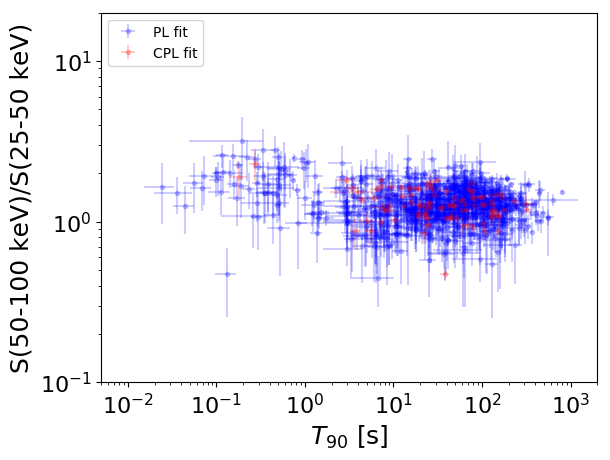
T90                                   = N/A sec.
Hardness ratio (energy fluence ratio) = N/A
S(15-50 keV) vs. S(50-150 keV) plot
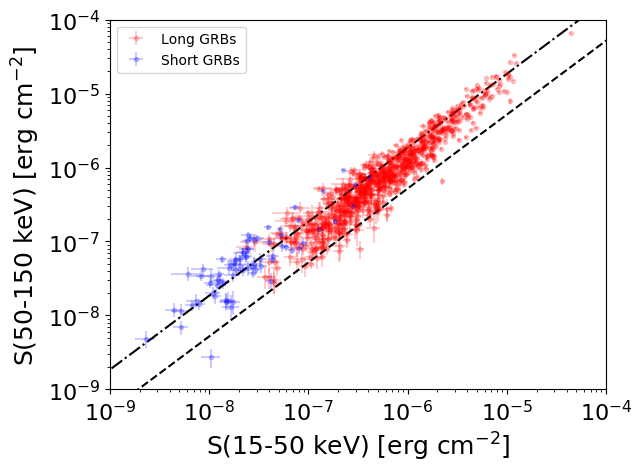
S(15-50 keV)  = N/A
S(50-150 keV) = N/A
The dash-dotted line and the dashed line traces the fluences calculated from the Band function with Epeak = 15 and 150 keV, respectively. Both lines assume a canonical values of alpha = -1 and beta = -2.5.
Mask shadow pattern
IMX = -1.703726376191623E-01, IMY = -4.133521449098388E-01
Spacecraft aspect plot
Bright source in the pre-burst/pre-slew/post-slew images
Pre-burst image of 15-350 keV band
Time interval of the image:
Pre-slew background subtracted image of 15-350 keV band
Time interval of the image:
-11.899400 336.700600

# RAcent  DECcent POSerr Theta    Phi  PeakCts   SNR AngSep     Name
#  [deg]    [deg]    ['] [deg]  [deg]                   [']
 83.6275  22.0153    0.4  33.1 -115.8  14.2201  26.0    0.3	Crab
 22.6830   1.6110    3.5  35.7  110.3   2.2994   3.3 ------	UNKNOWN
 34.3208   1.9621    1.2  24.1  112.4   3.5460  10.0 ------	UNKNOWN
 28.5291  51.0376    2.8  56.9  175.7   7.8687   4.1 ------	UNKNOWN
 63.4137 -22.9184    2.2  23.4    5.8   1.4616   5.3 ------	UNKNOWN
 32.2354  52.5679    2.7  56.9  179.0   8.4796   4.3 ------	UNKNOWN
 86.8140 -53.2844    3.3  58.3   -2.0   6.3450   3.5 ------	UNKNOWN
 97.9820 -45.7051    2.3  57.5  -14.3   7.2418   5.0 ------	UNKNOWN
 89.7906  38.3120    2.6  48.0 -129.0   6.8270   4.4 ------	UNKNOWN
Post-slew image of 15-350 keV band
Time interval of the image:
382.100590 963.120400

# RAcent  DECcent POSerr Theta    Phi  PeakCts   SNR AngSep     Name
#  [deg]    [deg]    ['] [deg]  [deg]                   [']
358.6768   0.8028    3.2  35.7  110.4   3.4049   3.6   92.9	UNKNOWN
355.3696  23.0613    2.2  43.3  144.2   5.1609   5.1 ------	UNKNOWN
 34.3029   1.9818    1.2   0.0  116.1   3.4265   9.3 ------	UNKNOWN
 70.9902   2.7012    3.7  36.6  -70.1   2.9467   3.1 ------	UNKNOWN