Analysis Summary
Notes:
- 1) No attempt has been made to eliminate the non-significant decimal places.
- 2) This batgrbproduct analysis is done using the HEASARC data.
- 3) This batgrbproduct analysis is using the flight position for the mask-weighting calculation.
======================================================================
BAT GRB EVENT DATA PROCESSING REPORT
Process Script Ver: batgrbproduct v2.46
Process Start Time: Tue Aug 15 14:48:25 EDT 2017
Host Name: bat1
Current Working Dir: /local/data/bat1/alien/Swift_3rdBATcatalog/event/batevent_reproc/trigger764204
======================================================================
Trigger: 00764204 Segment: 000
BAT Trigger Time: 522550144 [s; MET]
Trigger Stop: 522550208 [s; MET]
UTC: 2017-07-24T00:48:44.583880 [includes UTCF correction]
Where From?: TDRSS position message
BAT
RA: 150.081345377704 Dec: -1.04756718482438 [deg; J2000]
Catalogged Source?: NO
Point Source?: YES
GRB Indicated?: YES [ by BAT flight software ]
Image S/N Ratio: 8.43
Image Trigger?: YES
Rate S/N Ratio: 0 [ if not an image trigger ]
Image S/N Ratio: 8.43
Analysis Position: [ source = BAT ]
RA: 150.081345377704 Dec: -1.04756718482438 [deg; J2000]
Refined Position: [ source = BAT pre-slew burst ]
RA: 150.059986745671 Dec: -1.02641211043445 [deg; J2000]
{ 10h 00m 14.4s , -01d 01' 35.1" }
+/- 2.3714513329908 [arcmin] (estimated 90% radius based on SNR)
+/- 0.943849677733481 [arcmin] (formal 1-sigma fit error)
SNR: 8.85898130146444
Angular difference between the analysis and refined position is 1.803575 arcmin
Partial Coding Fraction: 0.5859375 [ including projection effects ]
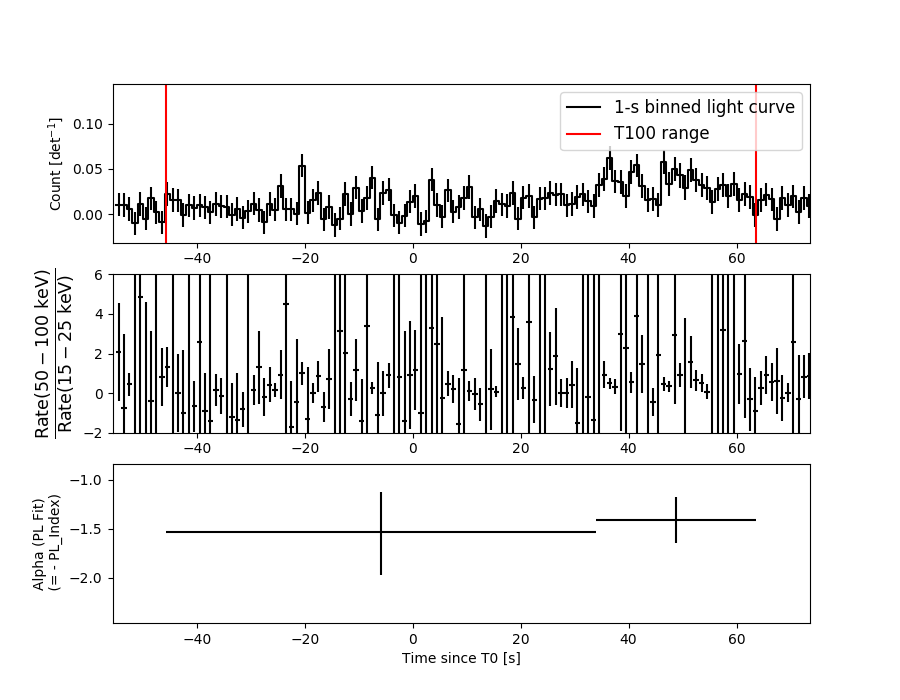
Duration
T90: 98.9799999594688 +/- 20.7571577896258
Measured from: -39.7680000066757
to: 59.2119999527931 [s; relative to TRIGTIME]
T50: 43.8759999275208 +/- 21.2041981897892
Measured from: 4.90799999237061
to: 48.7839999198914 [s; relative to TRIGTIME]
Fluence
Peak Flux (peak 1 second)
Measured from: 35.9160000085831
to: 36.9160000085831 [s; relative to TRIGTIME]
Total Fluence
Measured from: -45.6439999938011
to: 63.6039999723434 [s; relative to TRIGTIME]
Band 1 Band 2 Band 3 Band 4
15-25 25-50 50-100 100-350 keV
Total 0.492392 0.586664 0.498023 0.195087
0.072252 0.075177 0.065906 0.057768 [error]
Peak 0.025161 0.014238 0.018288 0.012139
0.006775 0.007269 0.006504 0.005588 [error]
[ fluence units of on-axis counts / fully illuminated detector ]
======================================================================
====== Table of the duration information =============================
Value tstart tstop
T100 109.248 -45.644 63.604
T90 98.980 -39.768 59.212
T50 43.876 4.908 48.784
Peak 1.000 35.916 36.916
====== Spectral Analysis Summary =====================================
Model : spectral model: simple power-law (PL) and cutoff power-law (CPL)
Ph_index : photon index: E^{Ph_index}
Ph_90err : 90% error of the photon index
Epeak : Epeak in keV
Epeak_90err: 90% error of Epeak
Norm : normalization at 50 keV in both the PL model and CPL model
Nomr_90err : 90% error of the normalization
chi2 : Chi-Squared
dof : degree of freedo
=== Time-averaged spectral analysis ===
(Best model with acceptable fit: PL)
Model Ph_index Ph_90err_low Ph_90err_hi Epeak Epeak_90err_low Epeak_90err_hi Norm Nomr_90err_low Norm_90err_hi chi2 dof
PL -1.466 -0.235 0.232 - - - 1.03e-03 -1.35e-04 1.34e-04 49.590 57
CPL -1.467 -0.233 0.420 9999.360 -9999.360 -9999.360 1.03e-03 -1.03e-03 1.33e-03 49.590 56
=== 1-s peak spectral analysis ===
(Best model with acceptable fit: N/A)
Model Ph_index Ph_90err_low Ph_90err_hi Epeak Epeak_90err_low Epeak_90err_hi Norm Nomr_90err_low Norm_90err_hi chi2 dof
PL -2.431 -1.186 0.839 - - - 2.44e-03 -1.66e-03 1.74e-03 60.650 57
CPL -1.977 N/A N/A 2.980 N/A N/A 4.10e-03 N/A N/A 61.170 56
=== Fluence/Peak Flux Summary ===
Model Band1 Band2 Band3 Band4 Band5 Total
15-25 25-50 50-100 100-350 15-150 15-350 keV
Fluence PL 1.40e-07 2.62e-07 3.79e-07 1.17e-06 1.08e-06 1.95e-06 erg/cm2
90%_error_low -3.01e-08 -3.48e-08 -6.60e-08 -3.87e-07 -1.56e-07 -4.45e-07 erg/cm2
90%_error_hi 3.18e-08 3.44e-08 6.52e-08 5.02e-07 1.58e-07 5.41e-07 erg/cm2
Peak flux PL 2.48e-01 1.45e-01 5.37e-02 2.64e-02 4.60e-01 4.73e-01 ph/cm2/s
90%_error_low -1.09e-01 -7.08e-02 -4.10e-02 -2.64e-02 -1.68e-01 -1.77e-01 ph/cm2/s
90%_error_hi 1.07e-01 6.13e-02 5.81e-02 8.16e-02 1.68e-01 1.84e-01 ph/cm2/s
Fluence CPL 1.41e-07 2.60e-07 3.77e-07 1.23e-06 1.08e-06 1.90e-06 erg/cm2
90%_error_low -3.58e-08 -3.56e-08 -6.88e-08 N/A -1.77e-07 -7.13e-07 erg/cm2
90%_error_hi 3.26e-08 4.20e-08 7.26e-08 N/A 1.66e-07 5.69e-07 erg/cm2
Peak flux CPL 2.28e-01 9.21e-02 2.31e-02 8.44e-03 3.48e-01 3.50e-01 ph/cm2/s
90%_error_low -1.13e-01 -9.21e-02 N/A -8.44e-03 N/A N/A ph/cm2/s
90%_error_hi 1.14e-01 1.06e-01 N/A 8.08e-02 N/A N/A ph/cm2/s
======================================================================
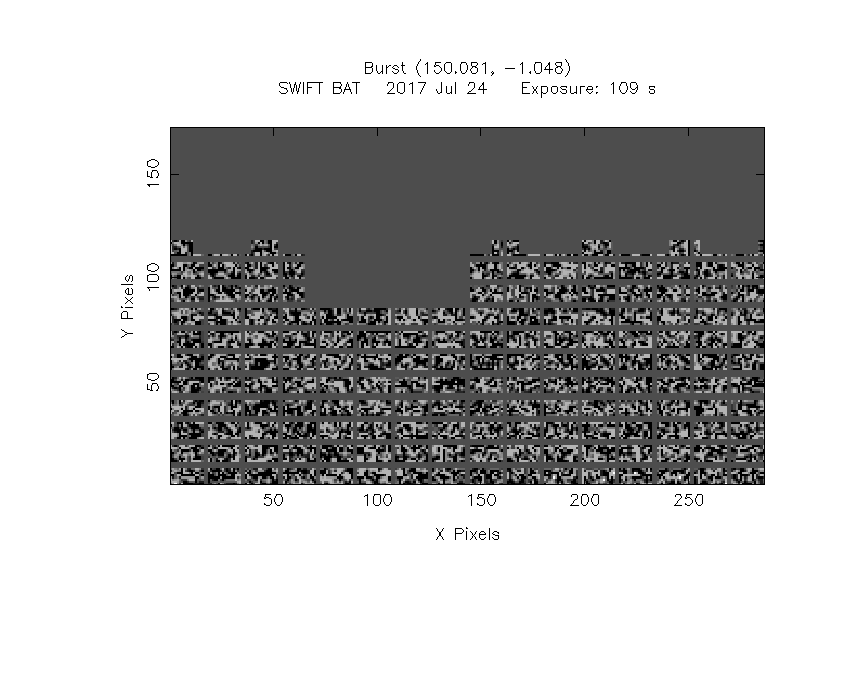
Image
Pre-slew 15.0-350.0 keV image (Event data)
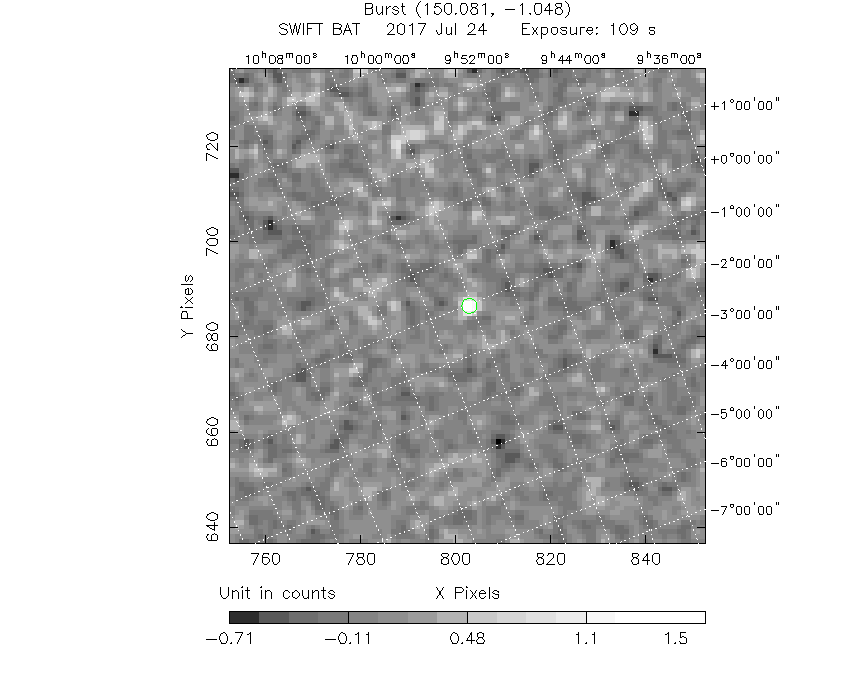
#   RAcent    DECcent   POSerr    Theta     Phi              Peak Cts       SNR   Name
  150.0600    -1.0264   0.0217    25.1525   -69.9172         1.7298344      8.859 TRIG_00764204

Foreground time interval of the image:
-45.644  63.604 (delta_t = 109.248 [sec])
Background time interval of the image:
-142.099 -45.644 (delta_t =  96.455 [sec])
Light Curves
Note: The mask-weighted lightcurves have units of either count/det or counts/sec/det, where a det is 0.4 x 0.4 = 0.16 sq cm.
Full-time range; 1 s binning
Other quick-look light curves:
- 64 ms binning (zoomed)
- 16 ms binning (zoomed)
- 8 ms binning (zoomed)
- 2 ms binning (zoomed)
- SN=5 or 10 s binning (full-time range)
- Raw light curve
Spectra
- 64 ms binning (zoomed)
- 16 ms binning (zoomed)
- 8 ms binning (zoomed)
- 2 ms binning (zoomed)
- SN=5 or 10 s binning (full-time range)
- Raw light curve
Spectra
Notes:
- 1) The fitting includes the systematic errors.
- 2) When the burst includes telescope slew time periods, the fitting uses an average response file made from multiple 5-s response files through out the slew time plus single time preiod for the non-slew times, and weighted by the total counts in the corresponding time period using addrmf. An average response file is needed becuase a spectral fit using the pre-slew DRM will introduce some errors in both a spectral shape and a normalization if the PHA file contains a lot of the slew/post-slew time interval.
- 3) For fits to more complicated models (e.g. a power-law over a cutoff power-law), the BAT team has decided to require a chi-square improvement of more than 6 for each extra dof.
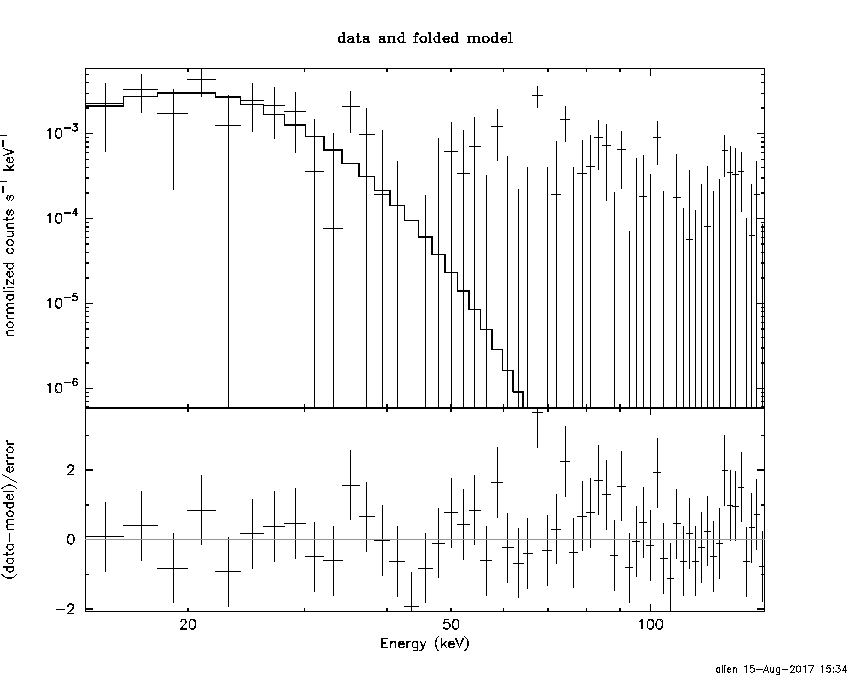
Time averaged spectrum fit using the average DRM
Power-law model
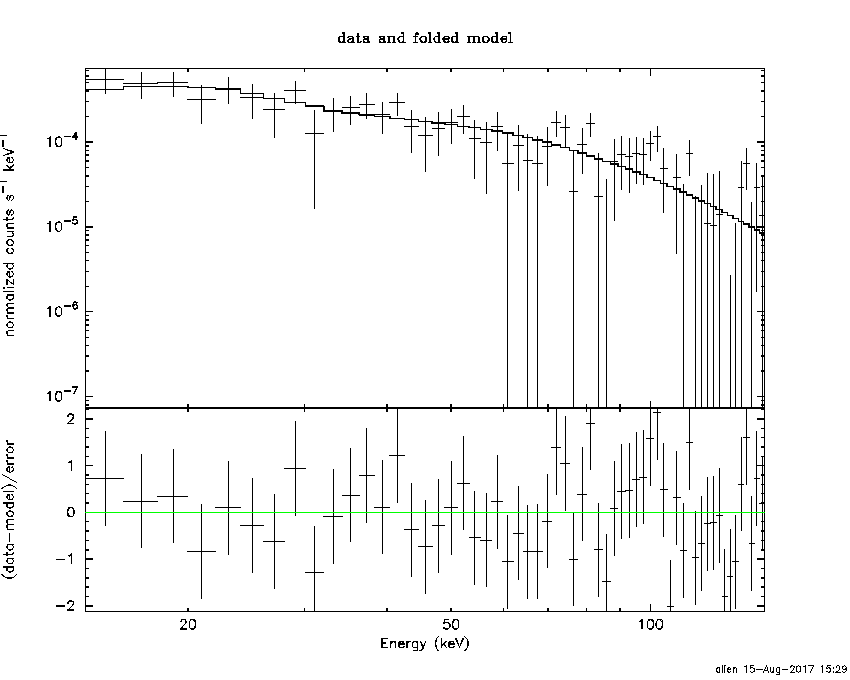
Time interval is from  -45.644 sec. to   63.604 sec.

Spectral model in power-law:
------------------------------------------------------------
Parameters  : value       lower 90%   higher 90%
Photon index: -1.46589     ( -0.235261   0.232317 )
Norm@50keV  : 1.03374E-03    ( -0.000135119   0.000133781 )
------------------------------------------------------------
#Fit statistic : Chi-Squared =          49.59 using 59 PHA bins.
# Reduced chi-squared =         0.8699 for     57 degrees of freedom
# Null hypothesis probability =   7.466256e-01

Photon flux (15-150 keV)    in 109.2 sec: 0.127907 ( -0.01633  0.016371 ) ph/cm2/s
Energy fluence (15-150 keV)             : 1.07729e-06 ( -1.56305e-07  1.58409e-07 ) ergs/cm2
Cutoff power-law model
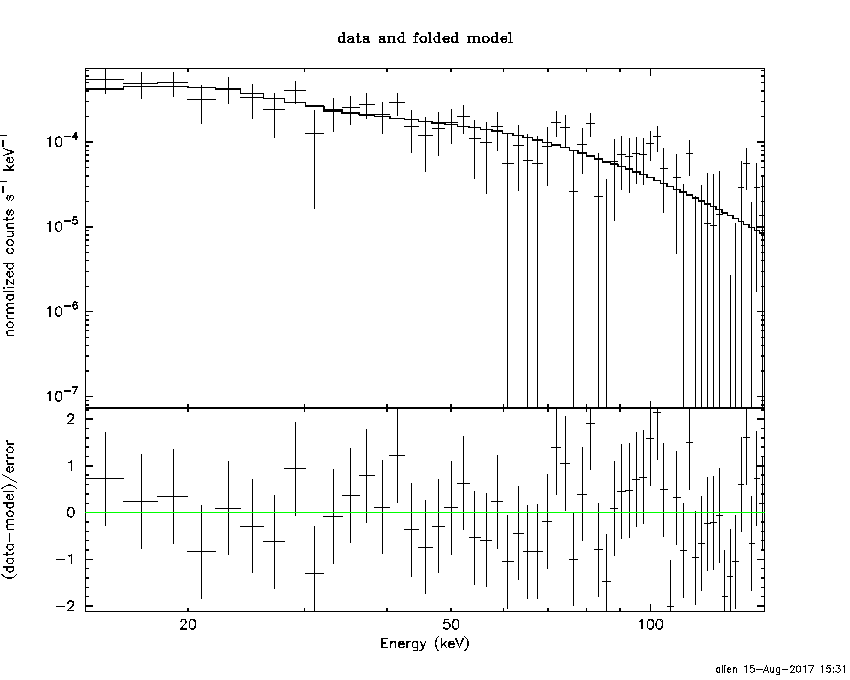
Time interval is from  -45.644 sec. to   63.604 sec.
Spectral model in the cutoff power-law:
------------------------------------------------------------
Parameters  : value       lower 90%   higher 90%
Photon index: -1.46663     ( -0.233425   0.41941 )
Epeak [keV] : 9999.36      ( -9999.36 -9999.36 )
Norm@50keV  : 1.03494E-03    ( -0.00103655   0.00132983 )
------------------------------------------------------------
#Fit statistic : Chi-Squared =          49.59 using 59 PHA bins.
# Reduced chi-squared =         0.8855 for     56 degrees of freedom
# Null hypothesis probability =   7.145532e-01

Photon flux (15-150 keV)    in 109.2 sec: 0.128449 (    ) ph/cm2/s
Energy fluence (15-150 keV)             : 1.08219e-06 ( -1.76991e-07  1.66152e-07 ) ergs/cm2
1-s peak spectrum fit
Power-law model
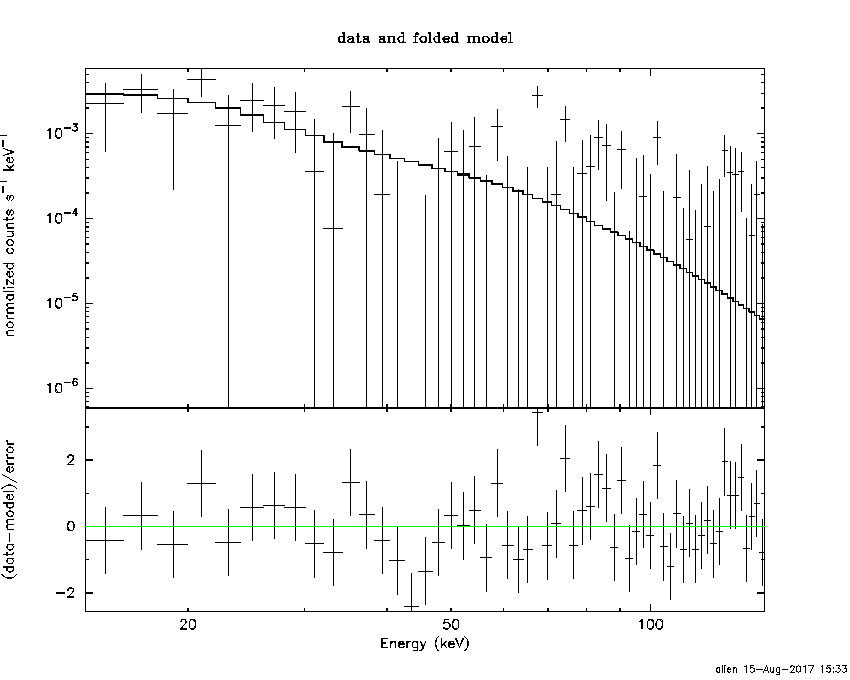
Time interval is from   35.916 sec. to   36.916 sec.

Spectral model in power-law:
------------------------------------------------------------
Parameters  : value       lower 90%   higher 90%
Photon index: -2.43134     ( -1.18602   0.839175 )
Norm@50keV  : 2.44186E-03    ( -0.00165887   0.00174075 )
------------------------------------------------------------
#Fit statistic : Chi-Squared =          60.65 using 59 PHA bins.
# Reduced chi-squared =          1.064 for     57 degrees of freedom
# Null hypothesis probability =   3.457547e-01

Photon flux (15-150 keV)    in 1 sec: 0.460283 ( -0.167721  0.168181 ) ph/cm2/s
Energy fluence (15-150 keV)             : 2.39988e-08 ( -1.16763e-08  1.44648e-08 ) ergs/cm2
Cutoff power-law model
Time interval is from   35.916 sec. to   36.916 sec.
Spectral model in the cutoff power-law:
------------------------------------------------------------
Parameters  : value       lower 90%   higher 90%
Photon index: 5.55447     (       )
Epeak [keV] : 22.1472      (   )
Norm@50keV  : 4385.81    (     )
------------------------------------------------------------
#Fit statistic : Chi-Squared =          60.56 using 59 PHA bins.
# Reduced chi-squared =          1.081 for     56 degrees of freedom
# Null hypothesis probability =   3.148384e-01

Photon flux (15-150 keV)    in 1 sec: 0.347527 (    ) ph/cm2/s
Energy fluence (15-150 keV)             : 0 ( 0  0 ) ergs/cm2
Time-resolved spectra
Distribution
T90 vs. Hardness ratio plot
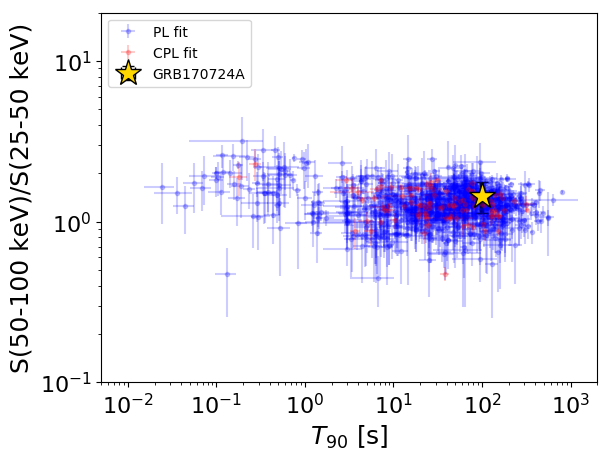
T90                                   = 98.98 sec.
Hardness ratio (energy fluence ratio) = 1.44813854156
S(15-50 keV) vs. S(50-150 keV) plot
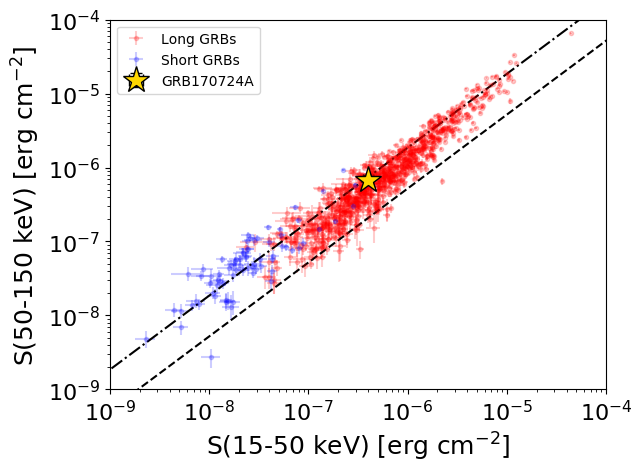
S(15-50 keV)  = 4.015335e-07
S(50-150 keV) = 6.757476e-07
The dash-dotted line and the dashed line traces the fluences calculated from the Band function with Epeak = 15 and 150 keV, respectively. Both lines assume a canonical values of alpha = -1 and beta = -2.5.
Mask shadow pattern
IMX = 1.612335672968598E-01, IMY = 4.410025128998756E-01
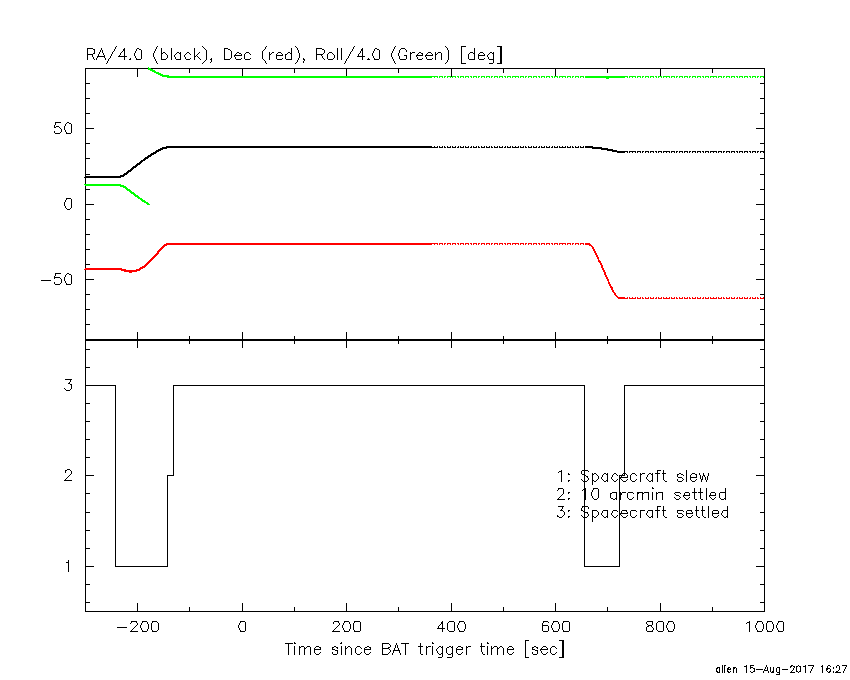
Spacecraft aspect plot
Bright source in the pre-burst/pre-slew/post-slew images
Pre-burst image of 15-350 keV band
Time interval of the image:
-142.099400 -45.644000

# RAcent  DECcent POSerr Theta    Phi  PeakCts   SNR AngSep     Name
#  [deg]    [deg]    ['] [deg]  [deg]                   [']
135.5591 -40.4085    6.0  19.0  149.6   0.2146   1.9    8.9	Vela X-1
170.1587 -60.7203    4.2  37.0   96.1   0.8786   2.7    7.4	Cen X-3
144.4993 -60.9050    2.3  35.0  117.1   1.1654   5.1 ------	UNKNOWN
102.7455  -2.8001    2.9  51.6 -139.6   2.3821   4.0 ------	UNKNOWN
Pre-slew background subtracted image of 15-350 keV band
Time interval of the image:
-45.644000 63.604000

# RAcent  DECcent POSerr Theta    Phi  PeakCts   SNR AngSep     Name
#  [deg]    [deg]    ['] [deg]  [deg]                   [']
135.4632 -40.5162   40.9  19.2  149.5  -0.0461  -0.3    3.8	Vela X-1
170.1661 -60.7250    7.8  37.0   96.1  -0.6214  -1.5    7.5	Cen X-3
176.2876 -35.0278    2.1  23.6   50.0   0.9103   5.6 ------	UNKNOWN
191.7959   0.9200    2.3  47.9   -6.1   1.4430   5.0 ------	UNKNOWN
101.3289 -24.3953    2.4  44.5 -167.2   1.2954   4.8 ------	UNKNOWN
150.0600  -1.0264    1.3  25.2  -69.9   1.7294   8.9 ------	UNKNOWN
Post-slew image of 15-350 keV band
Time interval of the image:
721.400610 963.099800

# RAcent  DECcent POSerr Theta    Phi  PeakCts   SNR AngSep     Name
#  [deg]    [deg]    ['] [deg]  [deg]                   [']
135.3187 -40.4508   13.7  22.0  -75.1  -0.2177  -0.8   11.4	Vela X-1
170.2590 -60.6507    2.3  14.8   30.1   1.0831   5.0    2.4	Cen X-3
186.3927 -62.6959   63.8  21.4   44.7  -0.0381  -0.2    8.5	GX 301-2
 11.4846 -66.0316    3.1  46.0  139.1   2.9158   3.7 ------	UNKNOWN
212.4530 -33.8200    2.7  52.9   26.0   4.6353   4.3 ------	UNKNOWN