Analysis Summary
Notes:
- 1) No attempt has been made to eliminate the non-significant decimal places.
- 2) This batgrbproduct analysis is done using the HEASARC data.
- 3) This batgrbproduct analysis is using the flight position for the mask-weighting calculation.
======================================================================
BAT GRB EVENT DATA PROCESSING REPORT
Process Script Ver: batgrbproduct v2.46
Process Start Time: Mon Aug 28 18:08:17 EDT 2017
Host Name: bat1
Current Working Dir: /local/data/bat1/alien/Swift_3rdBATcatalog/event/batevent_reproc/trigger766821
======================================================================
Trigger: 00766821 Segment: 000
BAT Trigger Time: 523835788.608 [s; MET]
Trigger Stop: 523835789.12 [s; MET]
UTC: 2017-08-07T21:56:09.115840 [includes UTCF correction]
Where From?: TDRSS position message
BAT
RA: 143.379449689179 Dec: -17.3293730191527 [deg; J2000]
Catalogged Source?: NO
Point Source?: YES
GRB Indicated?: YES [ by BAT flight software ]
Image S/N Ratio: 7.17
Image Trigger?: NO
Rate S/N Ratio: 14.247806848775 [ if not an image trigger ]
Image S/N Ratio: 7.17
Analysis Position: [ source = BAT ]
RA: 143.379449689179 Dec: -17.3293730191527 [deg; J2000]
Refined Position: [ source = BAT pre-slew burst ]
RA: 143.433398615419 Dec: -17.3478077800731 [deg; J2000]
{ 09h 33m 44.0s , -17d 20' 52.1" }
+/- 1.52125162759394 [arcmin] (estimated 90% radius based on SNR)
+/- 0.652205832713866 [arcmin] (formal 1-sigma fit error)
SNR: 16.704410627956
Angular difference between the analysis and refined position is 3.281859 arcmin
Partial Coding Fraction: 0.921875 [ including projection effects ]
Duration
T90: 36.323999941349 +/- 7.97291137847716
Measured from: 0.164000034332275
to: 36.4879999756813 [s; relative to TRIGTIME]
T50: 28.4119999408722 +/- 7.53834567873316
Measured from: 1.9200000166893
to: 30.3319999575615 [s; relative to TRIGTIME]
Fluence
Peak Flux (peak 1 second)
Measured from: 0.700000047683716
to: 1.70000004768372 [s; relative to TRIGTIME]
Total Fluence
Measured from: -0.435999989509583
to: 52.2319999933243 [s; relative to TRIGTIME]
Band 1 Band 2 Band 3 Band 4
15-25 25-50 50-100 100-350 keV
Total 0.515886 0.638487 0.340486 0.042848
0.043118 0.043779 0.037046 0.031474 [error]
Peak 0.054651 0.070699 0.051889 0.015181
0.006725 0.007077 0.006197 0.004729 [error]
[ fluence units of on-axis counts / fully illuminated detector ]
======================================================================
====== Table of the duration information =============================
Value tstart tstop
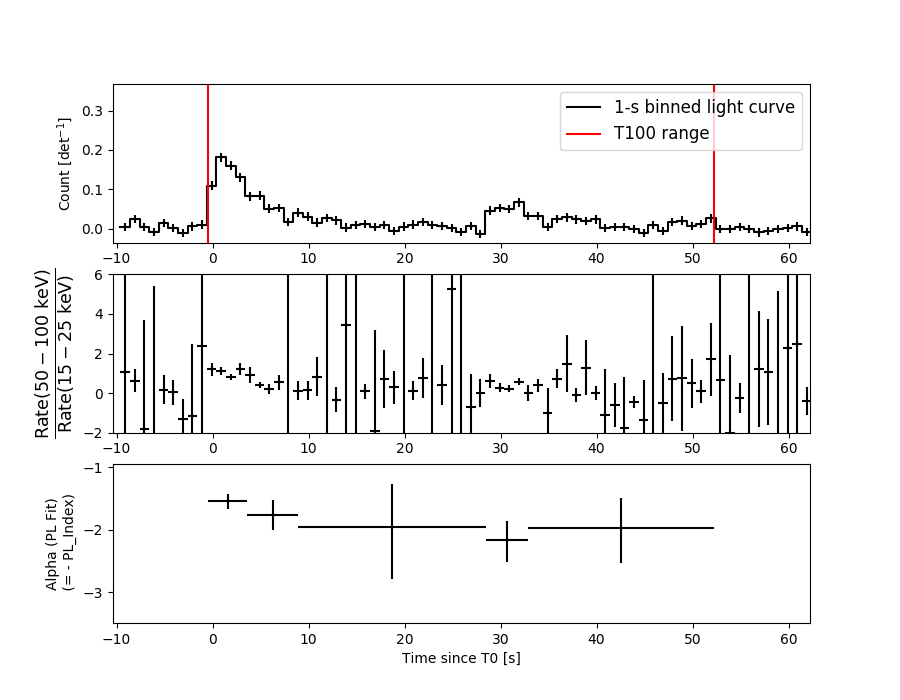
T100 52.668 -0.436 52.232
T90 36.324 0.164 36.488
T50 28.412 1.920 30.332
Peak 1.000 0.700 1.700
====== Spectral Analysis Summary =====================================
Model : spectral model: simple power-law (PL) and cutoff power-law (CPL)
Ph_index : photon index: E^{Ph_index}
Ph_90err : 90% error of the photon index
Epeak : Epeak in keV
Epeak_90err: 90% error of Epeak
Norm : normalization at 50 keV in both the PL model and CPL model
Nomr_90err : 90% error of the normalization
chi2 : Chi-Squared
dof : degree of freedo
=== Time-averaged spectral analysis ===
(Best model with acceptable fit: PL)
Model Ph_index Ph_90err_low Ph_90err_hi Epeak Epeak_90err_low Epeak_90err_hi Norm Nomr_90err_low Norm_90err_hi chi2 dof
PL -1.816 -0.150 0.145 - - - 1.74e-03 -1.66e-04 1.64e-04 65.680 57
CPL -0.983 -0.631 0.755 52.678 -9.961 33.967 5.12e-03 -2.82e-03 8.55e-03 60.350 56
=== 1-s peak spectral analysis ===
(Best model with acceptable fit: PL)
Model Ph_index Ph_90err_low Ph_90err_hi Epeak Epeak_90err_low Epeak_90err_hi Norm Nomr_90err_low Norm_90err_hi chi2 dof
PL -1.496 -0.189 0.187 - - - 1.17e-02 -1.34e-03 1.32e-03 61.020 57
CPL -1.380 -0.723 0.685 246.342 -246.342 -246.342 1.34e-02 -5.60e-03 1.68e-02 60.920 56
=== Fluence/Peak Flux Summary ===
Model Band1 Band2 Band3 Band4 Band5 Total
15-25 25-50 50-100 100-350 15-150 15-350 keV
Fluence PL 1.58e-07 2.39e-07 2.71e-07 5.87e-07 8.43e-07 1.26e-06 erg/cm2
90%_error_low -1.89e-08 -1.94e-08 -3.49e-08 -1.40e-07 -8.10e-08 -1.78e-07 erg/cm2
90%_error_hi 1.94e-08 1.95e-08 3.53e-08 1.66e-07 8.24e-08 1.98e-07 erg/cm2
Peak flux PL 4.79e-01 4.83e-01 3.43e-01 3.87e-01 1.46e+00 1.69e+00 ph/cm2/s
90%_error_low -8.43e-02 -5.49e-02 -4.98e-02 -1.03e-01 -1.59e-01 -1.89e-01 ph/cm2/s
90%_error_hi 8.78e-02 5.45e-02 4.93e-02 1.23e-01 1.59e-01 1.91e-01 ph/cm2/s
Fluence CPL 1.45e-07 2.63e-07 2.65e-07 1.64e-07 7.75e-07 8.37e-07 erg/cm2
90%_error_low -2.17e-08 -2.64e-08 -4.20e-08 -9.79e-08 -9.14e-08 -1.36e-07 erg/cm2
90%_error_hi 2.18e-08 2.74e-08 4.00e-08 2.47e-07 9.53e-08 2.59e-07 erg/cm2
Peak flux CPL 4.71e-01 4.90e-01 3.46e-01 3.30e-01 1.45e+00 1.64e+00 ph/cm2/s
90%_error_low -9.44e-02 -6.00e-02 -5.18e-02 -1.85e-01 -1.61e-01 -2.53e-01 ph/cm2/s
90%_error_hi 8.06e-02 6.61e-02 5.35e-02 7.22e-02 1.61e-01 2.34e-01 ph/cm2/s
======================================================================
Image
Pre-slew 15.0-350.0 keV image (Event data)

#   RAcent    DECcent   POSerr    Theta     Phi              Peak Cts       SNR   Name
  143.4334   -17.3478   0.0116    14.2808  -116.5428         1.4928568     16.704 TRIG_00766821

Foreground time interval of the image:
 -0.436  52.232 (delta_t =  52.668 [sec])
Background time interval of the image:
-213.907  -0.436 (delta_t = 213.471 [sec])
Light Curves
Note: The mask-weighted lightcurves have units of either count/det or counts/sec/det, where a det is 0.4 x 0.4 = 0.16 sq cm.
Full-time range; 1 s binning
Other quick-look light curves:
- 64 ms binning (zoomed)
- 16 ms binning (zoomed)
- 8 ms binning (zoomed)
- 2 ms binning (zoomed)
- SN=5 or 10 s binning (full-time range)
- Raw light curve
Spectra
- 64 ms binning (zoomed)
- 16 ms binning (zoomed)
- 8 ms binning (zoomed)
- 2 ms binning (zoomed)
- SN=5 or 10 s binning (full-time range)
- Raw light curve
Spectra
Notes:
- 1) The fitting includes the systematic errors.
- 2) When the burst includes telescope slew time periods, the fitting uses an average response file made from multiple 5-s response files through out the slew time plus single time preiod for the non-slew times, and weighted by the total counts in the corresponding time period using addrmf. An average response file is needed becuase a spectral fit using the pre-slew DRM will introduce some errors in both a spectral shape and a normalization if the PHA file contains a lot of the slew/post-slew time interval.
- 3) For fits to more complicated models (e.g. a power-law over a cutoff power-law), the BAT team has decided to require a chi-square improvement of more than 6 for each extra dof.
Time averaged spectrum fit using the average DRM
Power-law model

Time interval is from   -0.436 sec. to   52.232 sec.

Spectral model in power-law:
------------------------------------------------------------
Parameters  : value       lower 90%   higher 90%
Photon index: -1.81609     ( -0.149863   0.145432 )
Norm@50keV  : 1.73976E-03    ( -0.000166159   0.000163875 )
------------------------------------------------------------
#Fit statistic : Chi-Squared =          65.68 using 59 PHA bins.
# Reduced chi-squared =          1.152 for     57 degrees of freedom
# Null hypothesis probability =   2.014012e-01

Photon flux (15-150 keV)    in 52.67 sec: 0.241260 ( -0.019775  0.019782 ) ph/cm2/s
Energy fluence (15-150 keV)             : 8.43284e-07 ( -8.10407e-08  8.2359e-08 ) ergs/cm2
Cutoff power-law model
Time interval is from   -0.436 sec. to   52.232 sec.
Spectral model in the cutoff power-law:
------------------------------------------------------------
Parameters  : value       lower 90%   higher 90%
Photon index: -0.983158     ( -0.631421   0.7553 )
Epeak [keV] : 52.6785      ( -9.96112 33.9666 )
Norm@50keV  : 5.11702E-03    ( -0.00281918   0.0085548 )
------------------------------------------------------------
#Fit statistic : Chi-Squared =          60.35 using 59 PHA bins.
# Reduced chi-squared =          1.078 for     56 degrees of freedom
# Null hypothesis probability =   3.213758e-01

Photon flux (15-150 keV)    in 52.67 sec: 0.233034 ( -0.020654  0.020669 ) ph/cm2/s
Energy fluence (15-150 keV)             : 7.74665e-07 ( -9.14093e-08  9.53032e-08 ) ergs/cm2
1-s peak spectrum fit
Power-law model

Time interval is from    0.700 sec. to    1.700 sec.

Spectral model in power-law:
------------------------------------------------------------
Parameters  : value       lower 90%   higher 90%
Photon index: -1.49564     ( -0.189272   0.186697 )
Norm@50keV  : 1.16832E-02    ( -0.00133545   0.00132233 )
------------------------------------------------------------
#Fit statistic : Chi-Squared =          61.02 using 59 PHA bins.
# Reduced chi-squared =          1.070 for     57 degrees of freedom
# Null hypothesis probability =   3.336298e-01

Photon flux (15-150 keV)    in 1 sec: 1.45686 ( -0.15888  0.15895 ) ph/cm2/s
Energy fluence (15-150 keV)             : 1.10928e-07 ( -1.39574e-08  1.41238e-08 ) ergs/cm2
Cutoff power-law model
Time interval is from    0.700 sec. to    1.700 sec.
Spectral model in the cutoff power-law:
------------------------------------------------------------
Parameters  : value       lower 90%   higher 90%
Photon index: -1.37992     ( -0.72615   0.68182 )
Epeak [keV] : 246.342      ( -255.185 -255.185 )
Norm@50keV  : 1.34492E-02    ( -0.00563135   0.0167295 )
------------------------------------------------------------
#Fit statistic : Chi-Squared =          60.92 using 59 PHA bins.
# Reduced chi-squared =          1.088 for     56 degrees of freedom
# Null hypothesis probability =   3.034442e-01

Photon flux (15-150 keV)    in 1 sec: 1.45125 ( -0.16148  0.16129 ) ph/cm2/s
Energy fluence (15-150 keV)             : 1.09845e-07 ( -1.51995e-08  1.48819e-08 ) ergs/cm2
Time-resolved spectra
Distribution
T90 vs. Hardness ratio plot
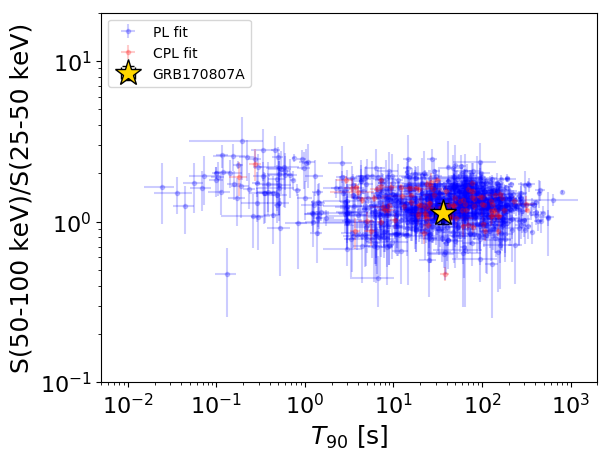
T90                                   = 36.324 sec.
Hardness ratio (energy fluence ratio) = 1.13600415296
S(15-50 keV) vs. S(50-150 keV) plot
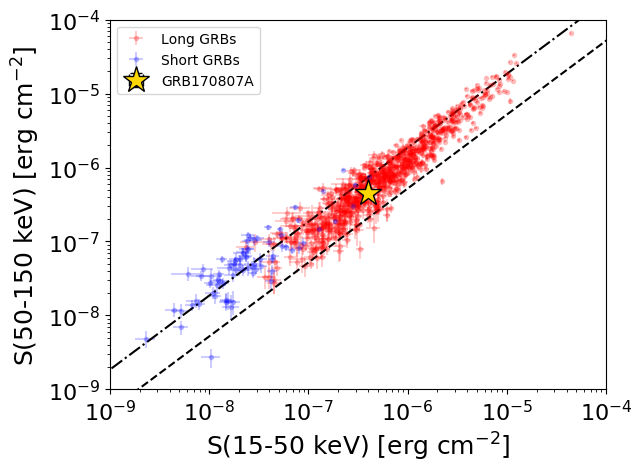
S(15-50 keV)  = 3.964173e-07
S(50-150 keV) = 4.468749e-07
The dash-dotted line and the dashed line traces the fluences calculated from the Band function with Epeak = 15 and 150 keV, respectively. Both lines assume a canonical values of alpha = -1 and beta = -2.5.
Mask shadow pattern
IMX = -1.137452022111278E-01, IMY = 2.277110940537140E-01
Spacecraft aspect plot
Bright source in the pre-burst/pre-slew/post-slew images
Pre-burst image of 15-350 keV band
Time interval of the image:
-213.907410 -0.436000

# RAcent  DECcent POSerr Theta    Phi  PeakCts   SNR AngSep     Name
#  [deg]    [deg]    ['] [deg]  [deg]                   [']
135.5430 -40.5565    0.6  17.8  145.6   3.3177  17.8    0.7	Vela X-1
170.3630 -60.4518   83.6  33.6   83.9   0.0605   0.1   10.4	Cen X-3
186.8204 -62.8803    5.5  40.4   76.5   1.6717   2.1    8.0	GX 301-2
152.4332 -58.3270    0.9  29.2   99.8   3.6848  12.8 ------	UNKNOWN
209.1529 -29.8116    2.4  49.0   25.7   2.8529   4.9 ------	UNKNOWN
 89.3656 -37.2334    2.8  52.3  163.6   3.5164   4.1 ------	UNKNOWN
105.5963 -41.3788    2.7  39.5  159.1   1.5988   4.4 ------	UNKNOWN
121.0629  -9.5597    2.3  35.2 -142.6   1.3931   5.0 ------	UNKNOWN
198.1126   9.8616    3.7  58.9  -24.4   4.5083   3.2 ------	UNKNOWN
158.2470   7.4919    3.1  37.0  -70.2   1.8803   3.7 ------	UNKNOWN
183.2309  11.6929    3.3  50.6  -39.3   3.0481   3.5 ------	UNKNOWN
Pre-slew background subtracted image of 15-350 keV band
Time interval of the image:
-0.436000 52.232000

# RAcent  DECcent POSerr Theta    Phi  PeakCts   SNR AngSep     Name
#  [deg]    [deg]    ['] [deg]  [deg]                   [']
135.5716 -40.5809    1.8  17.8  145.5  -0.5858  -6.5    2.5	Vela X-1
170.2789 -60.7953  296.0  33.9   84.3   0.0072   0.0   10.4	Cen X-3
186.7110 -62.7173    3.3  40.3   76.4   1.3116   3.5    3.5	GX 301-2
154.1844 -65.4942    2.0  36.4   98.7   1.1931   5.8 ------	UNKNOWN
143.4334 -17.3478    0.7  14.3 -116.5   1.4925  16.7 ------	UNKNOWN
Post-slew image of 15-350 keV band
Time interval of the image:
410.892600 962.457200

# RAcent  DECcent POSerr Theta    Phi  PeakCts   SNR AngSep     Name
#  [deg]    [deg]    ['] [deg]  [deg]                   [']
170.3158 -60.6230  260.1  53.6  166.2  -0.0781  -0.0    0.0	Cen X-3
186.5203 -62.7027    6.0  52.6  156.3   4.0665   1.9    5.5	GX 301-2
231.1090 -34.9538    2.0  39.9  103.9   8.2444   5.8 ------	UNKNOWN
241.5568  16.5492    3.3  52.3   30.0   7.1780   3.5 ------	UNKNOWN
228.9724  -3.2052    3.3  33.2   50.2   2.1302   3.5 ------	UNKNOWN
182.0392 -56.2373    3.0  47.0  161.5   4.2363   3.8 ------	UNKNOWN
184.9997 -42.1812    2.3  33.2  166.1   2.7531   5.0 ------	UNKNOWN
227.1448  40.3490    3.3  58.3   -2.1   8.3014   3.5 ------	UNKNOWN
195.1417  34.4860    3.8  45.0  -30.8   2.0316   3.1 ------	UNKNOWN
146.2155 -16.0878    3.3  49.0 -131.6   6.7067   3.5 ------	UNKNOWN