Analysis Summary
Notes:
- 1) No attempt has been made to eliminate the non-significant decimal places.
- 2) This batgrbproduct analysis is done using the HEASARC data.
- 3) This batgrbproduct analysis is using the flight position for the mask-weighting calculation.
======================================================================
                  BAT GRB EVENT DATA PROCESSING REPORT
    Process Script Ver: batgrbproduct v2.46
    Process Start Time: Mon Sep 11 18:50:37 EDT 2017
             Host Name: bat1
   Current Working Dir: /local/data/bat1/alien/Swift_3rdBATcatalog/event/batevent_reproc/trigger768939
======================================================================

  Trigger: 00768939      Segment: 000

  BAT Trigger Time: 525085930.624   [s; MET]
      Trigger Stop: 525085934.72   [s; MET]
               UTC: 2017-08-22T09:11:51.057700    [includes UTCF correction]
       Where From?: TDRSS position message

  BAT
    RA: 94.3820902752538   Dec: 55.0186424017826  [deg; J2000]

     Catalogged Source?: NO
     Point Source?:      YES
     GRB Indicated?:     YES    [ by BAT flight software ]
     Image S/N Ratio:    15.48
     Image Trigger?:     NO
     Rate S/N Ratio:     28.6705423736629  [ if not an image trigger ]
     Image S/N Ratio:    15.48

  Analysis Position:   [ source = BAT ]
    RA: 94.3820902752538   Dec: 55.0186424017826  [deg; J2000]

  Refined Position:   [ source = BAT pre-slew burst ]
    RA: 94.3747958377121   Dec: 54.9991722260662  [deg; J2000]
        { 06h 17m 30.0s , +54d 59' 57.0" }
         +/- 2.07411960337215 [arcmin] (estimated 90% radius based on SNR)
         +/- 0.71692905057524 [arcmin] (formal 1-sigma fit error)
    SNR: 10.7275036534455

  Angular difference between the analysis and refined position is 1.194867 arcmin

  Partial Coding Fraction: 0.1210938    [ including projection effects ]

  Duration
     T90: 64 +/- 16
        Measured from: -15.6240000128746
                   to: 48.3759999871254     [s; relative to TRIGTIME]
     T50: 32 +/- 16
        Measured from: 0.375999987125397
                   to: 32.3759999871254     [s; relative to TRIGTIME]


  Fluence
     Peak Flux  (peak 1 second)
        Measured from: 7.8759999871254
                   to: 8.8759999871254     [s; relative to TRIGTIME]
     Total Fluence
        Measured from: -15.6240000128746
                   to: 64.3759999871254     [s; relative to TRIGTIME]

             Band 1     Band 2     Band 3     Band 4
              15-25      25-50     50-100    100-350     keV
 Total     3.159279   4.047646   2.558933   0.385429
           0.172474   0.182155   0.154332   0.124743 [error]
 Peak      0.131422   0.189459   0.142840  -0.010452
           0.024036   0.025487   0.022650   0.014917 [error]

     [ fluence units of on-axis counts / fully illuminated detector ]

======================================================================


====== Table of the duration information =============================

        Value   tstart    tstop
T100   80.000  -15.624   64.376
T90    64.000  -15.624   48.376
T50    32.000    0.376   32.376
Peak    1.000    7.876    8.876


====== Spectral Analysis Summary =====================================

Model      : spectral model: simple power-law (PL) and cutoff power-law (CPL)
Ph_index   : photon index: E^{Ph_index}
Ph_90err   : 90% error of the photon index
Epeak      : Epeak in keV
Epeak_90err: 90% error of Epeak
Norm       : normalization at 50 keV in both the PL model and CPL model
Nomr_90err : 90% error of the normalization
chi2       : Chi-Squared
dof        : degree of freedo

=== Time-averaged spectral analysis ===
(Best model with acceptable fit: PL)

Model Ph_index Ph_90err_low Ph_90err_hi  Epeak  Epeak_90err_low  Epeak_90err_hi  Norm       Nomr_90err_low    Norm_90err_hi    chi2    dof
PL      -1.802    -0.094      0.093       -           -               -         8.70e-03     -4.90e-04          4.88e-04      64.290   57
CPL     -1.328    -0.359      0.392       68.926     -13.494        60.539      1.53e-02     -5.19e-03          8.82e-03      59.050   56


=== 1-s peak spectral analysis ===
(Best model with acceptable fit: PL)

Model Ph_index Ph_90err_low Ph_90err_hi  Epeak  Epeak_90err_low  Epeak_90err_hi  Norm       Nomr_90err_low    Norm_90err_hi    chi2    dof
PL      -1.707     -0.255     0.244       -           -               -         3.17e-02     -5.21e-03          5.14e-03      47.590   57
CPL     -0.906     -0.901     1.179       66.842     -17.354       -66.842      8.30e-02     -8.30e-02          2.46e-01      45.470   56


=== Fluence/Peak Flux Summary ===

              Model    Band1     Band2     Band3     Band4     Band5     Total
                       15-25     25-50    50-100    100-350    15-150    15-350    keV
Fluence         PL   1.18e-06  1.81e-06  2.07e-06  4.55e-06  6.41e-06  9.61e-06   erg/cm2
      90%_error_low -1.01e-07 -9.80e-08 -1.54e-07 -6.69e-07 -3.67e-07 -8.12e-07   erg/cm2
      90%_error_hi   1.04e-07  9.79e-08  1.54e-07  7.39e-07  3.68e-07  8.63e-07   erg/cm2
Peak flux       PL   1.59e+00  1.42e+00  8.70e-01  8.08e-01  4.23e+00  4.69e+00   ph/cm2/s
      90%_error_low -3.64e-01 -2.22e-01 -1.78e-01 -2.82e-01 -6.53e-01 -7.16e-01   ph/cm2/s
      90%_error_hi   3.83e-01  2.21e-01  1.77e-01  3.53e-01  6.54e-01  7.18e-01   ph/cm2/s

Fluence        CPL    N/A      N/A      N/A      N/A      N/A      N/A      erg/cm2
      90%_error_low -1.01e-07 -9.80e-08 -1.54e-07 -6.69e-07 -3.67e-07 -8.12e-07   erg/cm2
      90%_error_hi   1.04e-07  9.79e-08  1.54e-07  7.39e-07  3.68e-07  8.63e-07   erg/cm2
Peak flux      CPL   1.41e+00  1.55e+00  9.34e-01  3.72e-01  4.14e+00  4.26e+00   ph/cm2/s
      90%_error_low -4.29e-01 -2.71e-01 -2.04e-01 -2.35e-01 -6.63e-01 -7.20e-01   ph/cm2/s
      90%_error_hi   4.41e-01  2.84e-01  2.11e-01  5.69e-01  6.63e-01  8.05e-01   ph/cm2/s

======================================================================
Image
Pre-slew 15.0-350.0 keV image (Event data)
#   RAcent    DECcent   POSerr    Theta     Phi              Peak Cts       SNR   Name
   94.3748    54.9992   0.0180    41.8299   -61.5808        11.2824570     10.728 TRIG_00768939

Foreground time interval of the image:
-15.624  64.376 (delta_t =  80.000 [sec])
Background time interval of the image:
-239.624 -15.624 (delta_t = 224.000 [sec])
Light Curves
Note: The mask-weighted lightcurves have units of either count/det or counts/sec/det, where a det is 0.4 x 0.4 = 0.16 sq cm.
Full-time range; 1 s binning
Other quick-look light curves:
- 64 ms binning (zoomed)
- 16 ms binning (zoomed)
- 8 ms binning (zoomed)
- 2 ms binning (zoomed)
- SN=5 or 10 s binning (full-time range)
- Raw light curve
Spectra
- 64 ms binning (zoomed)
- 16 ms binning (zoomed)
- 8 ms binning (zoomed)
- 2 ms binning (zoomed)
- SN=5 or 10 s binning (full-time range)
- Raw light curve
Spectra
Notes:
- 1) The fitting includes the systematic errors.
- 2) When the burst includes telescope slew time periods, the fitting uses an average response file made from multiple 5-s response files through out the slew time plus single time preiod for the non-slew times, and weighted by the total counts in the corresponding time period using addrmf. An average response file is needed becuase a spectral fit using the pre-slew DRM will introduce some errors in both a spectral shape and a normalization if the PHA file contains a lot of the slew/post-slew time interval.
- 3) For fits to more complicated models (e.g. a power-law over a cutoff power-law), the BAT team has decided to require a chi-square improvement of more than 6 for each extra dof.
Time averaged spectrum fit using the average DRM
Power-law model
Time interval is from  -15.624 sec. to   64.376 sec.

Spectral model in power-law:
------------------------------------------------------------
Parameters  : value       lower 90%   higher 90%
Photon index: -1.80167     ( -0.0944541   0.0932117 )
Norm@50keV  : 8.70290E-03    ( -0.000490364   0.00048775 )
------------------------------------------------------------
#Fit statistic : Chi-Squared =          64.29 using 59 PHA bins.
# Reduced chi-squared =          1.128 for     57 degrees of freedom
# Null hypothesis probability =   2.364580e-01

Photon flux (15-150 keV)    in 80 sec: 1.20008 ( -0.06653  0.06667 ) ph/cm2/s
Energy fluence (15-150 keV)             : 6.41018e-06 ( -3.66795e-07  3.68424e-07 ) ergs/cm2
Cutoff power-law model
Time interval is from  -15.624 sec. to   64.376 sec.
Spectral model in the cutoff power-law:
------------------------------------------------------------
Parameters  : value       lower 90%   higher 90%
Photon index: -1.32792     ( -0.359271   0.39216 )
Epeak [keV] : 68.9261      ( -13.494 60.5394 )
Norm@50keV  : 1.52840E-02    ( -0.00519353   0.00882503 )
------------------------------------------------------------
#Fit statistic : Chi-Squared =          59.05 using 59 PHA bins.
# Reduced chi-squared =          1.055 for     56 degrees of freedom
# Null hypothesis probability =   3.645945e-01

Photon flux (15-150 keV)    in 80 sec: 1.17222 ( -0.0696  0.06969 ) ph/cm2/s
Energy fluence (15-150 keV)             : 0 ( 0  0 ) ergs/cm2
1-s peak spectrum fit
Power-law model
Time interval is from    7.876 sec. to    8.876 sec.

Spectral model in power-law:
------------------------------------------------------------
Parameters  : value       lower 90%   higher 90%
Photon index: -1.70731     ( -0.254703   0.243935 )
Norm@50keV  : 3.17388E-02    ( -0.0052145   0.005135 )
------------------------------------------------------------
#Fit statistic : Chi-Squared =          47.59 using 59 PHA bins.
# Reduced chi-squared =         0.8350 for     57 degrees of freedom
# Null hypothesis probability =   8.081899e-01

Photon flux (15-150 keV)    in 1 sec: 4.22627 ( -0.65283  0.65365 ) ph/cm2/s
Energy fluence (15-150 keV)             : 2.93738e-07 ( -4.97267e-08  5.02474e-08 ) ergs/cm2
Cutoff power-law model
Time interval is from    7.876 sec. to    8.876 sec.
Spectral model in the cutoff power-law:
------------------------------------------------------------
Parameters  : value       lower 90%   higher 90%
Photon index: -0.906174     ( -0.901436   1.17864 )
Epeak [keV] : 66.8422      ( -17.3541 -66.8429 )
Norm@50keV  : 8.29813E-02    ( -0.0829793   0.245991 )
------------------------------------------------------------
#Fit statistic : Chi-Squared =          45.47 using 59 PHA bins.
# Reduced chi-squared =         0.8120 for     56 degrees of freedom
# Null hypothesis probability =   8.415292e-01

Photon flux (15-150 keV)    in 1 sec: 4.14146 ( -0.66291  0.66263 ) ph/cm2/s
Energy fluence (15-150 keV)             : 2.83211e-07 ( -5.09641e-08  5.18239e-08 ) ergs/cm2
Time-resolved spectra

Distribution
T90 vs. Hardness ratio plot
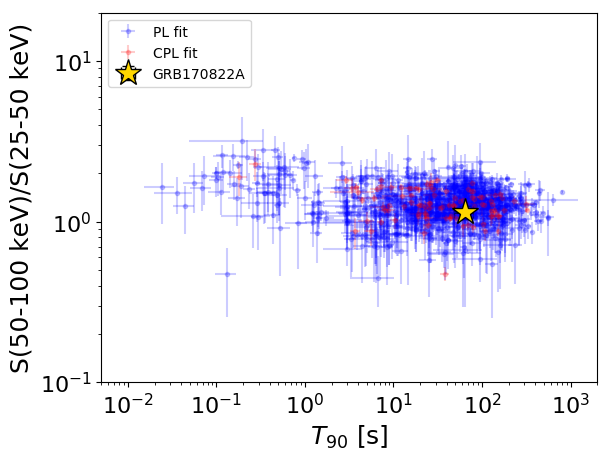
T90                                   = 64.0 sec.
Hardness ratio (energy fluence ratio) = 1.1474133344
S(15-50 keV) vs. S(50-150 keV) plot
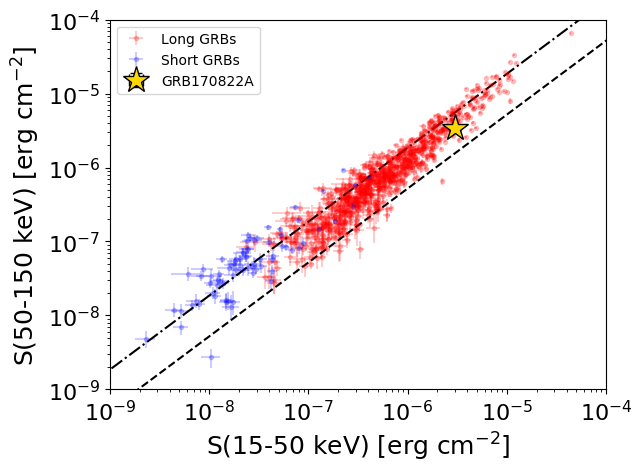
S(15-50 keV)  = 2.986942e-06
S(50-150 keV) = 3.42327e-06
The dash-dotted line and the dashed line traces the fluences calculated from the Band function with Epeak = 15 and 150 keV, respectively. Both lines assume a canonical values of alpha = -1 and beta = -2.5.
Mask shadow pattern
IMX = 4.259670919239378E-01, IMY = 7.871797057479685E-01
Spacecraft aspect plot
Bright source in the pre-burst/pre-slew/post-slew images
Pre-burst image of 15-350 keV band
Time interval of the image:
-239.624000 -15.624000

# RAcent  DECcent POSerr Theta    Phi  PeakCts   SNR AngSep     Name
#  [deg]    [deg]    ['] [deg]  [deg]                   [']
299.5933  35.2630    6.4  48.6  146.0   3.7028   1.8    3.7	Cyg X-1
308.3514  40.8532   10.6  40.1  142.1  -1.2362  -1.1   12.5	Cyg X-3
326.1956  38.4170    6.0  34.8  120.9   1.9467   1.9    5.8	Cyg X-2
334.0251  29.0317    2.5  40.6  104.7   7.9046   4.7 ------	UNKNOWN
318.2968  48.4913    2.5  29.8  140.5   2.8978   4.5 ------	UNKNOWN
 45.4749  42.7097    2.4  30.9   -5.9   2.4565   4.9 ------	UNKNOWN
235.4263  52.4448    4.6  57.3 -154.2  11.5510   2.5 ------	UNKNOWN
202.0300  67.3176    2.6  48.0 -129.0  13.5289   4.4 ------	UNKNOWN
Pre-slew background subtracted image of 15-350 keV band
Time interval of the image:
-15.624000 64.376000

# RAcent  DECcent POSerr Theta    Phi  PeakCts   SNR AngSep     Name
#  [deg]    [deg]    ['] [deg]  [deg]                   [']
299.6393  35.1659   81.9  48.7  145.9  -0.1012  -0.1    3.2	Cyg X-1
308.0781  40.8796    3.1  40.2  142.4   1.5558   3.7    4.6	Cyg X-3
325.9943  38.3832    8.2  34.9  121.1   0.5371   1.4    9.1	Cyg X-2
 34.0973  48.2356    2.7  21.9    2.4   0.8531   4.3 ------	UNKNOWN
271.2260  58.8212    3.4  41.3 -172.2   1.0916   3.4 ------	UNKNOWN
 94.3753  54.9991    1.1  41.8  -61.6  11.2592  10.7 ------	UNKNOWN
Post-slew image of 15-350 keV band
Time interval of the image:
152.276600 962.453300

# RAcent  DECcent POSerr Theta    Phi  PeakCts   SNR AngSep     Name
#  [deg]    [deg]    ['] [deg]  [deg]                   [']
 83.6250  22.0209    0.3  34.0   -2.9  31.5130  41.7    0.6	Crab
125.5562  78.6225    2.7  25.8  172.6   2.8759   4.3 ------	UNKNOWN
203.0186  62.2192    2.5  50.2 -165.9   8.1171   4.6 ------	UNKNOWN
101.3774  11.1158    3.7  44.3  -30.8   3.1638   3.1 ------	UNKNOWN
199.0849  50.6602    5.3  57.2 -154.1  11.9295   2.2 ------	UNKNOWN
196.2588  49.6828    3.1  56.7 -151.7  15.6562   3.7 ------	UNKNOWN
161.2056  40.3741    2.2  45.4 -121.1  13.9317   5.2 ------	UNKNOWN