Analysis Summary
Notes:
- 1) No attempt has been made to eliminate the non-significant decimal places.
- 2) This batgrbproduct analysis is done using the HEASARC data.
- 3) This batgrbproduct analysis is using the flight position for the mask-weighting calculation.
======================================================================
                  BAT GRB EVENT DATA PROCESSING REPORT
    Process Script Ver: batgrbproduct v2.46
    Process Start Time: Mon Sep 11 18:47:50 EDT 2017
             Host Name: bat1
   Current Working Dir: /local/data/bat1/alien/Swift_3rdBATcatalog/event/batevent_reproc/trigger769177
======================================================================

  Trigger: 00769177      Segment: 000

  BAT Trigger Time: 525219427.904   [s; MET]
      Trigger Stop: 525219428.416   [s; MET]
               UTC: 2017-08-23T22:16:48.329780    [includes UTCF correction]
       Where From?: TDRSS position message

  BAT
    RA: 188.719342821074   Dec: 35.5820017497756  [deg; J2000]

     Catalogged Source?: NO
     Point Source?:      YES
     GRB Indicated?:     YES    [ by BAT flight software ]
     Image S/N Ratio:    9.42
     Image Trigger?:     NO
     Rate S/N Ratio:     15.9687194226713  [ if not an image trigger ]
     Image S/N Ratio:    9.42

  Analysis Position:   [ source = BAT ]
    RA: 188.719342821074   Dec: 35.5820017497756  [deg; J2000]

  Refined Position:   [ source = BAT pre-slew burst ]
    RA: 188.713675521138   Dec: 35.5497619851502  [deg; J2000]
        { 12h 34m 51.3s , +35d 32' 59.1" }
         +/- 0.856311044758485 [arcmin] (estimated 90% radius based on SNR)
         +/- 0.313955083113349 [arcmin] (formal 1-sigma fit error)
    SNR: 37.9628692451347

  Angular difference between the analysis and refined position is 1.954062 arcmin

  Partial Coding Fraction: 0.796875    [ including projection effects ]

  Duration
     T90: 69.4079999923706 +/- 12.0317473731443
        Measured from: 1.69999998807907
                   to: 71.1079999804497     [s; relative to TRIGTIME]
     T50: 39.4399999976158 +/- 10.3080551328924
        Measured from: 11.1999999880791
                   to: 50.6399999856949     [s; relative to TRIGTIME]


  Fluence
     Peak Flux  (peak 1 second)
        Measured from: 21.3960000276566
                   to: 22.3960000276566     [s; relative to TRIGTIME]
     Total Fluence
        Measured from: -0.356000006198883
                   to: 87.3080000281334     [s; relative to TRIGTIME]

             Band 1     Band 2     Band 3     Band 4
              15-25      25-50     50-100    100-350     keV
 Total     1.799078   1.898359   0.946613   0.112151
           0.062501   0.064621   0.055453   0.048645 [error]
 Peak      0.124202   0.162259   0.118206   0.030018
           0.008668   0.009462   0.008337   0.006245 [error]

     [ fluence units of on-axis counts / fully illuminated detector ]

======================================================================


====== Table of the duration information =============================

        Value   tstart    tstop
T100   87.664   -0.356   87.308
T90    69.408    1.700   71.108
T50    39.440   11.200   50.640
Peak    1.000   21.396   22.396


====== Spectral Analysis Summary =====================================

Model      : spectral model: simple power-law (PL) and cutoff power-law (CPL)
Ph_index   : photon index: E^{Ph_index}
Ph_90err   : 90% error of the photon index
Epeak      : Epeak in keV
Epeak_90err: 90% error of Epeak
Norm       : normalization at 50 keV in both the PL model and CPL model
Nomr_90err : 90% error of the normalization
chi2       : Chi-Squared
dof        : degree of freedo

=== Time-averaged spectral analysis ===
(Best model with acceptable fit: PL)

Model Ph_index Ph_90err_low Ph_90err_hi  Epeak  Epeak_90err_low  Epeak_90err_hi  Norm       Nomr_90err_low    Norm_90err_hi    chi2    dof
PL      -2.065    -0.090      0.089       -           -               -         3.18e-03     -1.68e-04          1.67e-04      51.120   57
CPL     -1.708    -0.184      0.379       35.795      N/A           N/A         5.00e-03        N/A               N/A         48.000   56


=== 1-s peak spectral analysis ===
(Best model with acceptable fit: PL)

Model Ph_index Ph_90err_low Ph_90err_hi  Epeak  Epeak_90err_low  Epeak_90err_hi  Norm       Nomr_90err_low    Norm_90err_hi    chi2    dof
PL      -1.549     -0.113     0.112       -           -               -         2.89e-02     -1.92e-03          1.91e-03      41.010   57
CPL     -1.338     -0.272     0.464      155.111      N/A           N/A         3.71e-02        N/A               N/A         40.290   56


=== Fluence/Peak Flux Summary ===

              Model    Band1     Band2     Band3     Band4     Band5     Total
                       15-25     25-50    50-100    100-350    15-150    15-350    keV
Fluence         PL   6.07e-07  7.92e-07  7.58e-07  1.29e-06  2.58e-06  3.44e-06   erg/cm2
      90%_error_low -4.26e-08 -3.47e-08 -5.59e-08 -1.86e-07 -1.26e-07 -2.42e-07   erg/cm2
      90%_error_hi   4.35e-08  3.47e-08  5.64e-08  2.07e-07  1.27e-07  2.57e-07   erg/cm2
Peak flux       PL   1.25e+00  1.22e+00  8.33e-01  8.95e-01  3.66e+00  4.19e+00   ph/cm2/s
      90%_error_low -1.34e-01 -8.24e-02 -7.04e-02 -1.45e-01 -2.38e-01 -2.71e-01   ph/cm2/s
      90%_error_hi   1.38e-01  8.20e-02  7.00e-02  1.62e-01  2.38e-01  2.72e-01   ph/cm2/s

Fluence        CPL    N/A      N/A      N/A      N/A      N/A      N/A      erg/cm2
      90%_error_low -4.26e-08 -3.47e-08 -5.59e-08 -1.86e-07 -1.26e-07 -2.42e-07   erg/cm2
      90%_error_hi   4.35e-08  3.47e-08  5.64e-08  2.07e-07  1.27e-07  2.57e-07   erg/cm2
Peak flux      CPL   1.20e+00  1.25e+00  8.48e-01  6.91e-01  3.63e+00  3.99e+00   ph/cm2/s
      90%_error_low -1.60e-01 -9.63e-02 -7.62e-02 -2.75e-01 -2.46e-01 -3.82e-01   ph/cm2/s
      90%_error_hi   1.62e-01  9.90e-02  7.77e-02  2.51e-01  2.46e-01  3.78e-01   ph/cm2/s

======================================================================
Image
Pre-slew 15.0-350.0 keV image (Event data)
#   RAcent    DECcent   POSerr    Theta     Phi              Peak Cts       SNR   Name
  188.7137    35.5498   0.0051    24.1012  -138.0499         5.1628804     37.963 TRIG_00769177

Foreground time interval of the image:
 -0.356  87.308 (delta_t =  87.664 [sec])
Background time interval of the image:
-216.203  -0.356 (delta_t = 215.847 [sec])
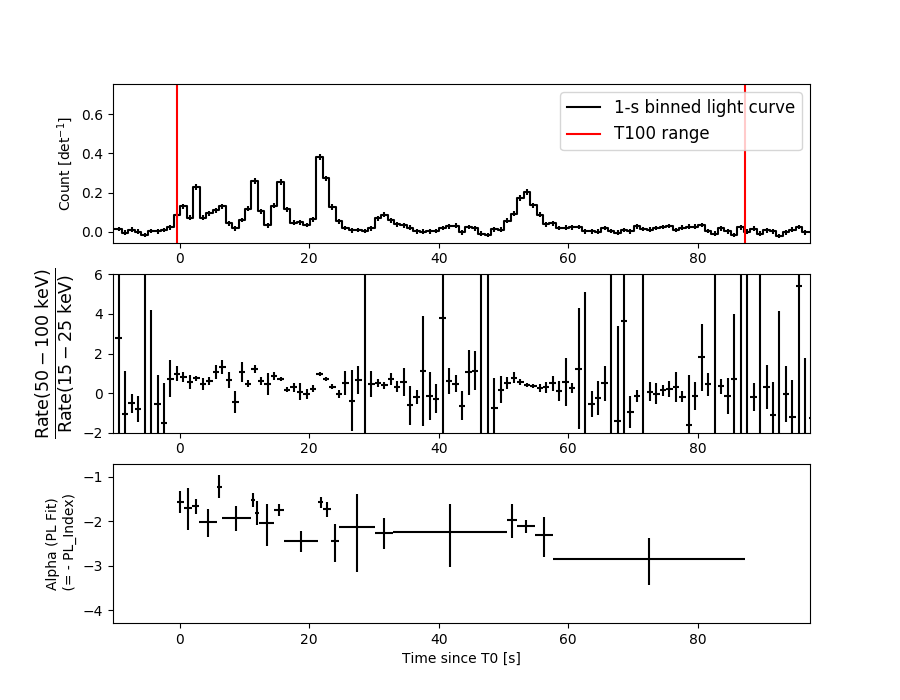
Light Curves
Note: The mask-weighted lightcurves have units of either count/det or counts/sec/det, where a det is 0.4 x 0.4 = 0.16 sq cm.
Full-time range; 1 s binning
Other quick-look light curves:
- 64 ms binning (zoomed)
- 16 ms binning (zoomed)
- 8 ms binning (zoomed)
- 2 ms binning (zoomed)
- SN=5 or 10 s binning (full-time range)
- Raw light curve
Spectra
- 64 ms binning (zoomed)
- 16 ms binning (zoomed)
- 8 ms binning (zoomed)
- 2 ms binning (zoomed)
- SN=5 or 10 s binning (full-time range)
- Raw light curve
Spectra
Notes:
- 1) The fitting includes the systematic errors.
- 2) When the burst includes telescope slew time periods, the fitting uses an average response file made from multiple 5-s response files through out the slew time plus single time preiod for the non-slew times, and weighted by the total counts in the corresponding time period using addrmf. An average response file is needed becuase a spectral fit using the pre-slew DRM will introduce some errors in both a spectral shape and a normalization if the PHA file contains a lot of the slew/post-slew time interval.
- 3) For fits to more complicated models (e.g. a power-law over a cutoff power-law), the BAT team has decided to require a chi-square improvement of more than 6 for each extra dof.
Time averaged spectrum fit using the average DRM
Power-law model
Time interval is from   -0.356 sec. to   87.308 sec.

Spectral model in power-law:
------------------------------------------------------------
Parameters  : value       lower 90%   higher 90%
Photon index: -2.06458     ( -0.0904139   0.088743 )
Norm@50keV  : 3.18265E-03    ( -0.000168233   0.000166647 )
------------------------------------------------------------
#Fit statistic : Chi-Squared =          51.12 using 59 PHA bins.
# Reduced chi-squared =         0.8968 for     57 degrees of freedom
# Null hypothesis probability =   6.942089e-01

Photon flux (15-150 keV)    in 87.66 sec: 0.492179 ( -0.022582  0.022638 ) ph/cm2/s
Energy fluence (15-150 keV)             : 2.58441e-06 ( -1.2596e-07  1.26915e-07 ) ergs/cm2
Cutoff power-law model
Time interval is from   -0.356 sec. to   87.308 sec.
Spectral model in the cutoff power-law:
------------------------------------------------------------
Parameters  : value       lower 90%   higher 90%
Photon index: -1.70824     ( -0.1838   0.378824 )
Epeak [keV] : 35.7952      (   )
Norm@50keV  : 4.99797E-03    (     )
------------------------------------------------------------
#Fit statistic : Chi-Squared =          48.00 using 59 PHA bins.
# Reduced chi-squared =         0.8572 for     56 degrees of freedom
# Null hypothesis probability =   7.676001e-01

Photon flux (15-150 keV)    in 87.66 sec: 0.480959 ( -0.024901  0.024946 ) ph/cm2/s
Energy fluence (15-150 keV)             : 0 ( 0  0 ) ergs/cm2
1-s peak spectrum fit
Power-law model

Time interval is from   21.396 sec. to   22.396 sec.

Spectral model in power-law:
------------------------------------------------------------
Parameters  : value       lower 90%   higher 90%
Photon index: -1.54919     ( -0.113165   0.111895 )
Norm@50keV  : 2.89049E-02    ( -0.00192124   0.00191163 )
------------------------------------------------------------
#Fit statistic : Chi-Squared =          41.01 using 59 PHA bins.
# Reduced chi-squared =         0.7194 for     57 degrees of freedom
# Null hypothesis probability =   9.454974e-01

Photon flux (15-150 keV)    in 1 sec: 3.65844 ( -0.23755  0.23775 ) ph/cm2/s
Energy fluence (15-150 keV)             : 2.72182e-07 ( -1.96537e-08  1.97959e-08 ) ergs/cm2
Cutoff power-law model
Time interval is from   21.396 sec. to   22.396 sec.
Spectral model in the cutoff power-law:
------------------------------------------------------------
Parameters  : value       lower 90%   higher 90%
Photon index: -1.33754     ( -0.272126   0.46403 )
Epeak [keV] : 155.111      (   )
Norm@50keV  : 3.71077E-02    (     )
------------------------------------------------------------
#Fit statistic : Chi-Squared =          40.29 using 59 PHA bins.
# Reduced chi-squared =         0.7194 for     56 degrees of freedom
# Null hypothesis probability =   9.437718e-01

Photon flux (15-150 keV)    in 1 sec: 3.62584 ( -0.24639  0.2462 ) ph/cm2/s
Energy fluence (15-150 keV)             : 2.67867e-07 ( -2.16659e-08  2.15406e-08 ) ergs/cm2
Time-resolved spectra
Distribution
T90 vs. Hardness ratio plot
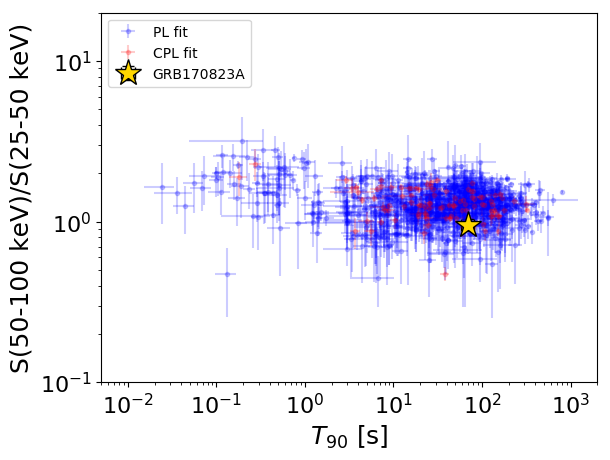
T90                                   = 69.408 sec.
Hardness ratio (energy fluence ratio) = 0.95626878206
S(15-50 keV) vs. S(50-150 keV) plot
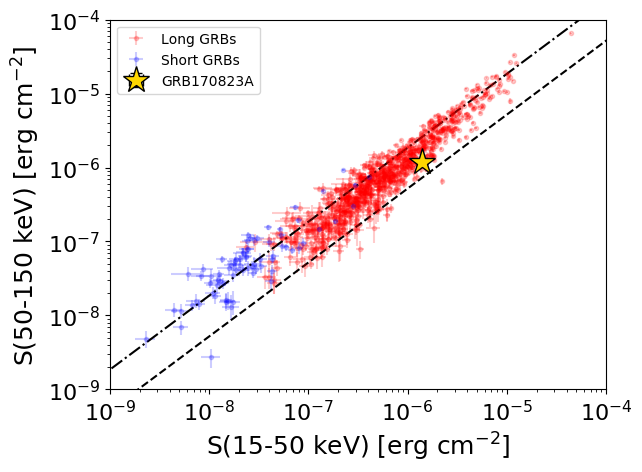
S(15-50 keV)  = 1.39923e-06
S(50-150 keV) = 1.1852305e-06
The dash-dotted line and the dashed line traces the fluences calculated from the Band function with Epeak = 15 and 150 keV, respectively. Both lines assume a canonical values of alpha = -1 and beta = -2.5.
Mask shadow pattern
IMX = -3.327040337404917E-01, IMY = 2.990436093631421E-01
Spacecraft aspect plot
Bright source in the pre-burst/pre-slew/post-slew images
Pre-burst image of 15-350 keV band
Time interval of the image:
-216.203400 -0.356000

# RAcent  DECcent POSerr Theta    Phi  PeakCts   SNR AngSep     Name
#  [deg]    [deg]    ['] [deg]  [deg]                   [']
220.6060  77.4962    3.2  25.0   92.4   0.9440   3.7 ------	UNKNOWN
168.6361  37.5705    2.9  20.6  -95.4   0.8560   4.0 ------	UNKNOWN
211.5667   8.0646    3.5  57.2 -154.1   4.7343   3.4 ------	UNKNOWN
Pre-slew background subtracted image of 15-350 keV band
Time interval of the image:
-0.356000 87.308000

# RAcent  DECcent POSerr Theta    Phi  PeakCts   SNR AngSep     Name
#  [deg]    [deg]    ['] [deg]  [deg]                   [']
245.6502  51.0880    2.0  39.9  138.7   1.7309   5.7 ------	UNKNOWN
217.2411  24.9276    1.8  44.5 -170.1   1.5070   6.3 ------	UNKNOWN
188.7137  35.5498    0.3  24.1 -138.0   5.1623  38.0 ------	UNKNOWN
201.1290  17.5666    2.5  44.7 -146.3   1.2651   4.6 ------	UNKNOWN
155.7333  29.2739    2.0  31.4  -76.2   1.2468   5.7 ------	UNKNOWN
Post-slew image of 15-350 keV band
Time interval of the image:
623.596590 962.163500

# RAcent  DECcent POSerr Theta    Phi  PeakCts   SNR AngSep     Name
#  [deg]    [deg]    ['] [deg]  [deg]                   [']
244.9913 -15.6482    0.3  41.9  155.8  35.0520  35.6    0.8	Sco X-1
254.3877  35.2642   15.8  15.6   32.9  -0.2686  -0.7    5.8	Her X-1
268.2858  -1.2978    0.0  38.7  113.6  -1.7692  -1.4   10.5	SW J1753.5-0127
211.1206  -5.7569    2.4  42.2 -151.4   3.1446   4.8 ------	UNKNOWN
195.7748   8.4963    2.9  45.3 -121.3   6.1522   4.0 ------	UNKNOWN