Analysis Summary
Notes:
- 1) No attempt has been made to eliminate the non-significant decimal places.
- 2) This batgrbproduct analysis is done using the HEASARC data.
- 3) This batgrbproduct analysis is using the flight position for the mask-weighting calculation.
======================================================================
                  BAT GRB EVENT DATA PROCESSING REPORT
    Process Script Ver: batgrbproduct v2.46
    Process Start Time: Thu Sep 28 17:56:00 EDT 2017
             Host Name: bat1
   Current Working Dir: /local/data/bat1/alien/Swift_3rdBATcatalog/event/batevent_reproc/trigger770528
======================================================================

  Trigger: 00770528      Segment: 000

  BAT Trigger Time: 526135766.848   [s; MET]
      Trigger Stop: 526135767.872   [s; MET]
               UTC: 2017-09-03T12:49:07.219440    [includes UTCF correction]
       Where From?: TDRSS position message

  BAT
    RA: 254.511712851535   Dec: 34.9835881466908  [deg; J2000]

     Catalogged Source?: NO
     Point Source?:      YES
     GRB Indicated?:     YES    [ by BAT flight software ]
     Image S/N Ratio:    9.84
     Image Trigger?:     NO
     Rate S/N Ratio:     17.7763888346312  [ if not an image trigger ]
     Image S/N Ratio:    9.84

  Analysis Position:   [ source = BAT ]
    RA: 254.511712851535   Dec: 34.9835881466908  [deg; J2000]

  Refined Position:   [ source = BAT pre-slew burst ]
    RA: 254.523170046904   Dec: 34.9822900582206  [deg; J2000]
        { 16h 58m 05.6s , +34d 58' 56.2" }
         +/- 1.22057722602866 [arcmin] (estimated 90% radius based on SNR)
         +/- 0.444986574520974 [arcmin] (formal 1-sigma fit error)
    SNR: 22.8798787864337

  Angular difference between the analysis and refined position is 0.568588 arcmin

  Partial Coding Fraction: 0.3007812    [ including projection effects ]

  Duration
     T90: 27.7239999771118 +/- 4.50650779531548
        Measured from: -5.26800000667572
                   to: 22.4559999704361     [s; relative to TRIGTIME]
     T50: 10.3559999465942 +/- 1.76041018375818
        Measured from: 1.00400000810623
                   to: 11.3599999547005     [s; relative to TRIGTIME]


  Fluence
     Peak Flux  (peak 1 second)
        Measured from: 0.579999983310699
                   to: 1.5799999833107     [s; relative to TRIGTIME]
     Total Fluence
        Measured from: -9.99599999189377
                   to: 25.7039999961853     [s; relative to TRIGTIME]

             Band 1     Band 2     Band 3     Band 4
              15-25      25-50     50-100    100-350     keV
 Total     1.230462   1.452451   0.838055   0.305940
           0.083683   0.081894   0.068563   0.055324 [error]
 Peak      0.126376   0.164330   0.102325   0.036224
           0.016225   0.017028   0.013970   0.010457 [error]

     [ fluence units of on-axis counts / fully illuminated detector ]

======================================================================


====== Table of the duration information =============================

        Value   tstart    tstop
T100   35.700   -9.996   25.704
T90    27.724   -5.268   22.456
T50    10.356    1.004   11.360
Peak    1.000    0.580    1.580


====== Spectral Analysis Summary =====================================

Model      : spectral model: simple power-law (PL) and cutoff power-law (CPL)
Ph_index   : photon index: E^{Ph_index}
Ph_90err   : 90% error of the photon index
Epeak      : Epeak in keV
Epeak_90err: 90% error of Epeak
Norm       : normalization at 50 keV in both the PL model and CPL model
Nomr_90err : 90% error of the normalization
chi2       : Chi-Squared
dof        : degree of freedo

=== Time-averaged spectral analysis ===
(Best model with acceptable fit: N/A)

Model Ph_index Ph_90err_low Ph_90err_hi  Epeak  Epeak_90err_low  Epeak_90err_hi  Norm       Nomr_90err_low    Norm_90err_hi    chi2    dof
PL      -1.951    -0.122      0.120       -           -               -         7.17e-03     -5.15e-04          5.09e-04      72.710   57
CPL     -2.011    -0.014      0.446        8.126      N/A           N/A         6.65e-03        N/A               N/A         72.640   56


=== 1-s peak spectral analysis ===
(Best model with acceptable fit: PL)

Model Ph_index Ph_90err_low Ph_90err_hi  Epeak  Epeak_90err_low  Epeak_90err_hi  Norm       Nomr_90err_low    Norm_90err_hi    chi2    dof
PL      -1.850     -0.207     0.202       -           -               -         2.78e-02     -3.56e-03          3.50e-03      67.430   57
CPL     -1.855     -0.704     0.715     9999.360      N/A           N/A         2.78e-02        N/A               N/A         67.430   56


=== Fluence/Peak Flux Summary ===

              Model    Band1     Band2     Band3     Band4     Band5     Total
                       15-25     25-50    50-100    100-350    15-150    15-350    keV
Fluence         PL   5.00e-07  6.99e-07  7.23e-07  1.37e-06  2.36e-06  3.29e-06   erg/cm2
      90%_error_low -5.18e-08 -4.54e-08 -7.03e-08 -2.59e-07 -1.64e-07 -3.28e-07   erg/cm2
      90%_error_hi   5.33e-08  4.54e-08  7.03e-08  2.96e-07  1.65e-07  3.53e-07   erg/cm2
Peak flux       PL   1.60e+00  1.31e+00  7.29e-01  5.95e-01  3.91e+00  4.24e+00   ph/cm2/s
      90%_error_low -2.93e-01 -1.57e-01 -1.19e-01 -1.72e-01 -4.71e-01 -4.93e-01   ph/cm2/s
      90%_error_hi   3.05e-01  1.56e-01  1.18e-01  2.08e-01  4.72e-01  4.93e-01   ph/cm2/s

Fluence        CPL   5.03e-07  6.97e-07  7.29e-07  1.35e-06  2.37e-06  3.29e-06   erg/cm2
      90%_error_low    N/A    -4.36e-08 -1.38e-07 -6.24e-07 -1.84e-07 -3.52e-07   erg/cm2
      90%_error_hi     N/A     4.83e-08  4.34e-08  1.90e-07  1.57e-07  3.37e-07   erg/cm2
Peak flux      CPL   1.60e+00  1.18e+00  5.99e-01  5.09e-01  3.58e+00  3.88e+00   ph/cm2/s
      90%_error_low -3.77e-01 -2.57e-01 -1.37e-01 -1.10e-01 -7.71e-01 -1.02e+00   ph/cm2/s
      90%_error_hi   3.48e-01  2.83e-01  1.27e-01  1.01e-01  7.97e-01  4.31e+00   ph/cm2/s

======================================================================
Image
Pre-slew 15.0-350.0 keV image (Event data)
#   RAcent    DECcent   POSerr    Theta     Phi              Peak Cts       SNR   Name
  254.5232    34.9823   0.0084    46.7038   -29.2684         3.8462961     22.880 TRIG_00770528

Foreground time interval of the image:
 -9.996  25.704 (delta_t =  35.700 [sec])
Background time interval of the image:
-239.848  -9.996 (delta_t = 229.852 [sec])
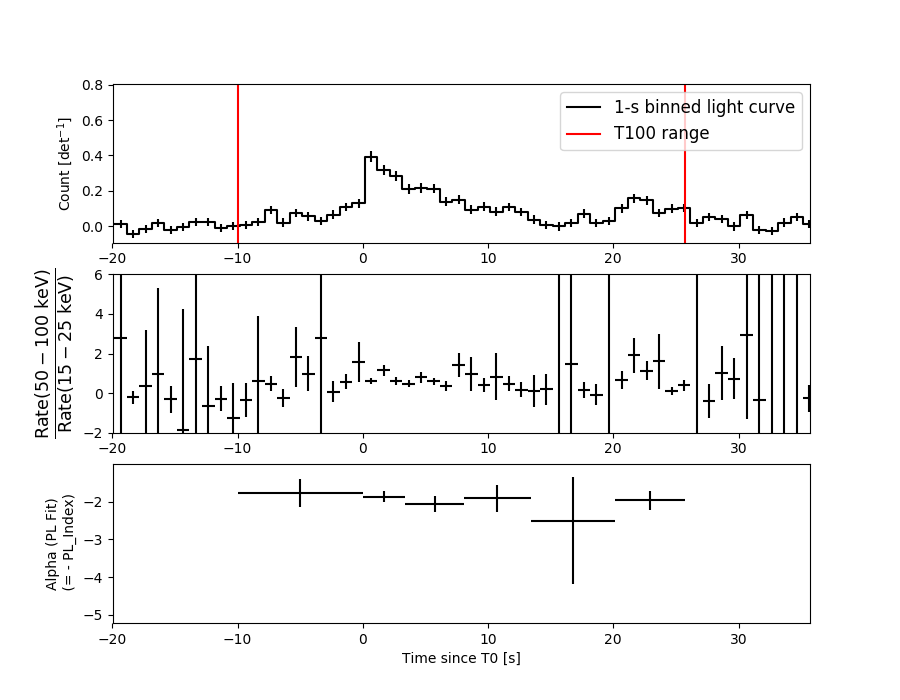
Light Curves
Note: The mask-weighted lightcurves have units of either count/det or counts/sec/det, where a det is 0.4 x 0.4 = 0.16 sq cm.
Full-time range; 1 s binning
Other quick-look light curves:
- 64 ms binning (zoomed)
- 16 ms binning (zoomed)
- 8 ms binning (zoomed)
- 2 ms binning (zoomed)
- SN=5 or 10 s binning (full-time range)
- Raw light curve
Spectra
- 64 ms binning (zoomed)
- 16 ms binning (zoomed)
- 8 ms binning (zoomed)
- 2 ms binning (zoomed)
- SN=5 or 10 s binning (full-time range)
- Raw light curve
Spectra
Notes:
- 1) The fitting includes the systematic errors.
- 2) When the burst includes telescope slew time periods, the fitting uses an average response file made from multiple 5-s response files through out the slew time plus single time preiod for the non-slew times, and weighted by the total counts in the corresponding time period using addrmf. An average response file is needed becuase a spectral fit using the pre-slew DRM will introduce some errors in both a spectral shape and a normalization if the PHA file contains a lot of the slew/post-slew time interval.
- 3) For fits to more complicated models (e.g. a power-law over a cutoff power-law), the BAT team has decided to require a chi-square improvement of more than 6 for each extra dof.
Time averaged spectrum fit using the average DRM
Power-law model
Time interval is from   -9.996 sec. to   25.704 sec.

Spectral model in power-law:
------------------------------------------------------------
Parameters  : value       lower 90%   higher 90%
Photon index: -1.95058     ( -0.122369   0.119787 )
Norm@50keV  : 7.16879E-03    ( -0.000514595   0.000508838 )
------------------------------------------------------------
#Fit statistic : Chi-Squared =          72.71 using 59 PHA bins.
# Reduced chi-squared =          1.276 for     57 degrees of freedom
# Null hypothesis probability =   7.843826e-02

Photon flux (15-150 keV)    in 35.7 sec: 1.05168 ( -0.071412  0.07168 ) ph/cm2/s
Energy fluence (15-150 keV)             : 2.35564e-06 ( -1.63849e-07  1.64757e-07 ) ergs/cm2
Cutoff power-law model
Time interval is from   -9.996 sec. to   25.704 sec.
Spectral model in the cutoff power-law:
------------------------------------------------------------
Parameters  : value       lower 90%   higher 90%
Photon index: -2.01065     ( -0.013823   0.446129 )
Epeak [keV] : 8.12603      (   )
Norm@50keV  : 6.65484E-03    (     )
------------------------------------------------------------
#Fit statistic : Chi-Squared =          72.64 using 59 PHA bins.
# Reduced chi-squared =          1.297 for     56 degrees of freedom
# Null hypothesis probability =   6.676483e-02

Photon flux (15-150 keV)    in 35.7 sec: 1.03062 ( -0.133493  0.10102 ) ph/cm2/s
Energy fluence (15-150 keV)             : 2.36946e-06 ( -1.83818e-07  1.57155e-07 ) ergs/cm2
1-s peak spectrum fit
Power-law model
Time interval is from    0.580 sec. to    1.580 sec.

Spectral model in power-law:
------------------------------------------------------------
Parameters  : value       lower 90%   higher 90%
Photon index: -1.84979     ( -0.207154   0.201656 )
Norm@50keV  : 2.78208E-02    ( -0.00355849   0.00349897 )
------------------------------------------------------------
#Fit statistic : Chi-Squared =          67.43 using 59 PHA bins.
# Reduced chi-squared =          1.183 for     57 degrees of freedom
# Null hypothesis probability =   1.625325e-01

Photon flux (15-150 keV)    in 1 sec: 3.91038 ( -0.47119  0.47223 ) ph/cm2/s
Energy fluence (15-150 keV)             : 2.55847e-07 ( -3.25669e-08  3.2782e-08 ) ergs/cm2
Cutoff power-law model
Time interval is from    0.580 sec. to    1.580 sec.
Spectral model in the cutoff power-law:
------------------------------------------------------------
Parameters  : value       lower 90%   higher 90%
Photon index: -1.85523     ( -0.705641   0.712774 )
Epeak [keV] : 9999.36      (   )
Norm@50keV  : 2.77527E-02    (     )
------------------------------------------------------------
#Fit statistic : Chi-Squared =          67.43 using 59 PHA bins.
# Reduced chi-squared =          1.204 for     56 degrees of freedom
# Null hypothesis probability =   1.409466e-01

Photon flux (15-150 keV)    in 1 sec: 3.58162 ( -0.77133  0.79692 ) ph/cm2/s
Energy fluence (15-150 keV)             : 2.56478e-07 ( -3.32853e-08  2.65699e-08 ) ergs/cm2
Time-resolved spectra
Distribution
T90 vs. Hardness ratio plot

T90                                   = N/A sec.
Hardness ratio (energy fluence ratio) = N/A
S(15-50 keV) vs. S(50-150 keV) plot
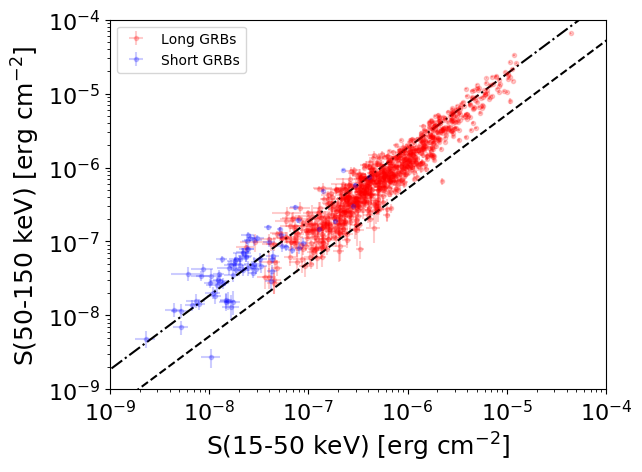
S(15-50 keV)  = N/A
S(50-150 keV) = N/A
The dash-dotted line and the dashed line traces the fluences calculated from the Band function with Epeak = 15 and 150 keV, respectively. Both lines assume a canonical values of alpha = -1 and beta = -2.5.
Mask shadow pattern
IMX = 9.258263296751151E-01, IMY = 5.188779791649856E-01
Spacecraft aspect plot
Bright source in the pre-burst/pre-slew/post-slew images
Pre-burst image of 15-350 keV band
Time interval of the image:
-239.848000 -9.996000

# RAcent  DECcent POSerr Theta    Phi  PeakCts   SNR AngSep     Name
#  [deg]    [deg]    ['] [deg]  [deg]                   [']
244.9889 -15.6555    1.4  36.3 -109.8   4.2700   8.2    1.1	Sco X-1
254.3920  35.3379    5.4  47.1  -29.1  -0.9778  -2.1    3.2	Her X-1
255.9831 -37.8427   21.0  39.7 -149.3   0.2048   0.5    0.2	4U 1700-377
256.4417 -36.4386   16.2  38.4 -148.3   0.2383   0.7    1.0	GX 349+2
262.8540 -24.7629   17.4  26.0 -141.5   0.1613   0.7    8.5	GX 1+4
264.8394 -44.4167    4.7  41.7 -163.3   0.8184   2.4    4.6	4U 1735-44
268.3844  -1.4431  235.3  12.4  -74.0   0.0114   0.0    1.1	SW J1753.5-0127
270.2696 -25.0106    2.3  22.3 -155.4   1.0705   4.9    4.2	GX 5-1
270.3234 -25.8476    6.0  23.0 -156.4   0.4159   1.9    6.4	GRS 1758-258
273.9570 -14.0578    3.2  11.1 -146.0   0.7713   3.6    3.1	GX 17+2
276.0808 -30.5219    0.0  25.9 -171.6   0.2890   1.2   12.3	H1820-303
285.1514 -24.7776    7.9  20.4  167.3   0.3149   1.5   10.6	HT1900.1-2455
288.8015  10.9563    1.1  18.0   28.1   2.2169  10.5    0.7	GRS 1915+105
299.6069  35.1925    1.2  44.0   22.9   4.1142   9.4    1.0	Cyg X-1
308.1104  40.9533   14.1  52.5   26.4   0.8617   0.8    0.0	Cyg X-3
263.0175 -33.8873    3.3  33.1 -153.1   0.9361   3.5    3.5	GX 354-0
266.5899   7.8399    3.5  18.7  -47.0   0.7433   3.3 ------	UNKNOWN
237.6865 -31.7089    2.8  48.0 -129.2   3.9312   4.1 ------	UNKNOWN
Pre-slew background subtracted image of 15-350 keV band
Time interval of the image:
-9.996000 25.704000

# RAcent  DECcent POSerr Theta    Phi  PeakCts   SNR AngSep     Name
#  [deg]    [deg]    ['] [deg]  [deg]                   [']
244.9678 -15.5669    3.0  36.3 -109.7  -0.6805  -3.8    4.5	Sco X-1
254.3053  35.1620    0.0  47.0  -29.3   0.0318   0.2   13.2	Her X-1
255.8217 -37.9552    0.0  39.8 -149.3  -0.2107  -1.7   10.3	4U 1700-377
256.5858 -36.5843   21.6  38.4 -148.6  -0.0673  -0.5   12.1	GX 349+2
263.0439 -24.6040   11.3  25.7 -141.6   0.0941   1.0    8.7	GX 1+4
264.6198 -44.3606    5.0  41.8 -163.1   0.2776   2.3    7.5	4U 1735-44
268.3372  -1.5992    6.0  12.4  -74.8  -0.1505  -1.9    9.0	SW J1753.5-0127
270.1495 -25.1018   32.2  22.4 -155.2   0.0292   0.4    7.4	GX 5-1
270.1608 -25.7830    6.3  23.0 -156.0   0.1491   1.8    8.0	GRS 1758-258
274.1598 -13.8910    0.0  10.8 -146.4   0.1760   2.3   12.5	GX 17+2
276.0728 -30.4174    8.8  25.8 -171.6   0.1029   1.3    8.2	H1820-303
285.1928 -25.0651    0.0  20.7  167.4   0.0981   1.3   12.2	HT1900.1-2455
288.7193  11.0329    5.8  18.0   27.7  -0.1558  -2.0    7.0	GRS 1915+105
299.5720  35.2253    9.2  44.1   22.9  -0.1993  -1.3    1.7	Cyg X-1
308.0006  40.9514    5.3  52.4   26.3  -0.8067  -2.2    5.0	Cyg X-3
262.9515 -33.7456    5.3  33.0 -152.9  -0.2109  -2.2    5.7	GX 354-0
320.1092 -36.6359    2.8  48.3  136.5   1.4129   4.2 ------	UNKNOWN
254.5305  34.9781    0.6  46.7  -29.3   3.8879  23.1 ------	UNKNOWN
241.4875  27.5046    2.1  49.5  -46.9   1.8738   5.4 ------	UNKNOWN
Post-slew image of 15-350 keV band
Time interval of the image:
171.852610 962.248700

# RAcent  DECcent POSerr Theta    Phi  PeakCts   SNR AngSep     Name
#  [deg]    [deg]    ['] [deg]  [deg]                   [']
299.6166  35.2076    2.1  48.7  154.1  11.4289   5.5    1.3	Cyg X-1
308.0681  40.9823    2.5  40.2  150.7   6.3439   4.7    2.6	Cyg X-3
326.1872  38.3316   38.2  34.9  129.0   0.3495   0.3    0.9	Cyg X-2
 60.5139  21.6167    3.3  55.4    0.6   7.1431   3.5 ------	UNKNOWN
268.6834  45.4097    3.4  53.1 -173.4   6.0110   3.3 ------	UNKNOWN
 98.3637  56.5070    2.9  42.1  -57.6   8.6661   3.9 ------	UNKNOWN
106.4099  58.1563    3.3  43.6  -64.0  11.0438   3.5 ------	UNKNOWN