Analysis Summary
Notes:
- 1) No attempt has been made to eliminate the non-significant decimal places.
- 2) This batgrbproduct analysis is done using the HEASARC data.
- 3) This batgrbproduct analysis is using the flight position for the mask-weighting calculation.
======================================================================
BAT GRB EVENT DATA PROCESSING REPORT
Process Script Ver: batgrbproduct v2.46
Process Start Time: Thu Sep 28 17:39:39 EDT 2017
Host Name: bat1
Current Working Dir: /local/data/bat1/alien/Swift_3rdBATcatalog/event/batevent_reproc/trigger770981
======================================================================
Trigger: 00770981 Segment: 000
BAT Trigger Time: 526375597.248 [s; MET]
Trigger Stop: 526375598.272 [s; MET]
UTC: 2017-09-06T07:26:17.605220 [includes UTCF correction]
Where From?: TDRSS position message
BAT
RA: 128.703619534125 Dec: 70.7817005714058 [deg; J2000]
Catalogged Source?: NO
Point Source?: YES
GRB Indicated?: YES [ by BAT flight software ]
Image S/N Ratio: 11.09
Image Trigger?: NO
Rate S/N Ratio: 21.1187120819429 [ if not an image trigger ]
Image S/N Ratio: 11.09
Analysis Position: [ source = BAT ]
RA: 128.703619534125 Dec: 70.7817005714058 [deg; J2000]
Refined Position: [ source = BAT pre-slew burst ]
RA: 128.669502283292 Dec: 70.804276145787 [deg; J2000]
{ 08h 34m 40.7s , +70d 48' 15.4" }
+/- 0.751874977030309 [arcmin] (estimated 90% radius based on SNR)
+/- 0.215075986987955 [arcmin] (formal 1-sigma fit error)
SNR: 45.7144177058612
Angular difference between the analysis and refined position is 1.512707 arcmin
Partial Coding Fraction: 0.328125 [ including projection effects ]
Duration
T90: 45.0759999752045 +/- 4.80024419382997
Measured from: -25.7840000391006
to: 19.2919999361038 [s; relative to TRIGTIME]
T50: 12.6159999370575 +/- 0.9888012956279
Measured from: -3.28000003099442
to: 9.33599990606308 [s; relative to TRIGTIME]
Fluence
Peak Flux (peak 1 second)
Measured from: 6.17599999904633
to: 7.17599999904633 [s; relative to TRIGTIME]
Total Fluence
Measured from: -35.2080000042915
to: 41.3279999494553 [s; relative to TRIGTIME]
Band 1 Band 2 Band 3 Band 4
15-25 25-50 50-100 100-350 keV
Total 3.639321 5.061694 3.903203 0.866434
0.109002 0.116378 0.102086 0.079517 [error]
Peak 0.143948 0.287148 0.324975 0.096604
0.016096 0.018423 0.018808 0.013174 [error]
[ fluence units of on-axis counts / fully illuminated detector ]
======================================================================
====== Table of the duration information =============================
Value tstart tstop
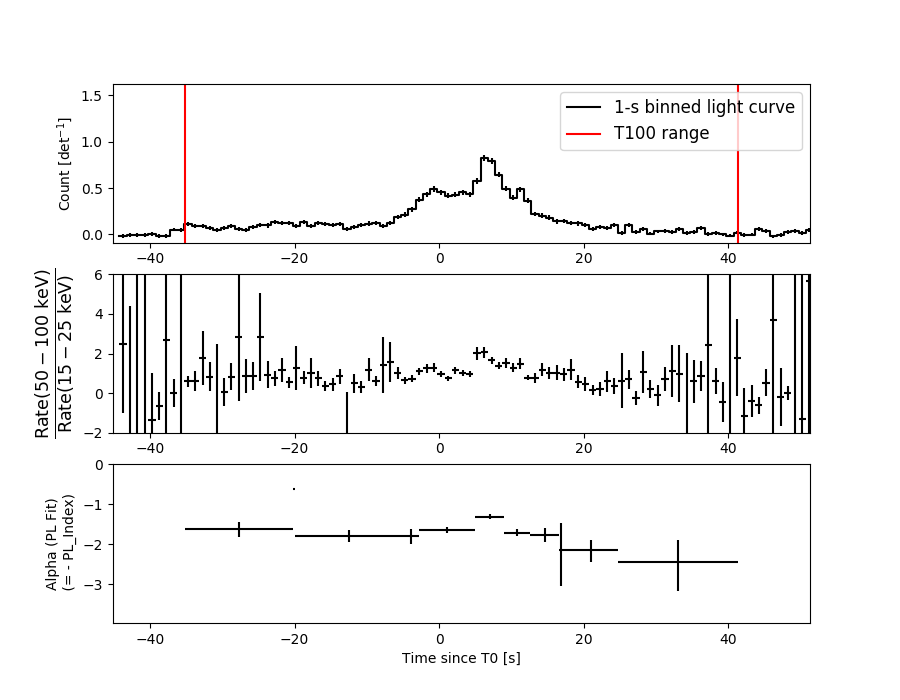
T100 76.536 -35.208 41.328
T90 45.076 -25.784 19.292
T50 12.616 -3.280 9.336
Peak 1.000 6.176 7.176
====== Spectral Analysis Summary =====================================
Model : spectral model: simple power-law (PL) and cutoff power-law (CPL)
Ph_index : photon index: E^{Ph_index}
Ph_90err : 90% error of the photon index
Epeak : Epeak in keV
Epeak_90err: 90% error of Epeak
Norm : normalization at 50 keV in both the PL model and CPL model
Nomr_90err : 90% error of the normalization
chi2 : Chi-Squared
dof : degree of freedo
=== Time-averaged spectral analysis ===
(Best model with acceptable fit: CPL)
Model Ph_index Ph_90err_low Ph_90err_hi Epeak Epeak_90err_low Epeak_90err_hi Norm Nomr_90err_low Norm_90err_hi chi2 dof
PL -1.669 -0.052 0.052 - - - 1.26e-02 -3.58e-04 3.58e-04 58.460 57
CPL -1.277 -0.215 0.225 101.244 -18.425 54.615 1.91e-02 -3.80e-03 5.01e-03 48.440 56
=== 1-s peak spectral analysis ===
(Best model with acceptable fit: CPL)
Model Ph_index Ph_90err_low Ph_90err_hi Epeak Epeak_90err_low Epeak_90err_hi Norm Nomr_90err_low Norm_90err_hi chi2 dof
PL -1.160 -0.105 0.106 - - - 6.19e-02 -4.08e-03 4.08e-03 63.000 57
CPL -0.358 -0.460 0.516 118.837 -25.544 78.942 1.41e-01 -5.16e-02 9.20e-02 53.460 56
=== Fluence/Peak Flux Summary ===
Model Band1 Band2 Band3 Band4 Band5 Total
15-25 25-50 50-100 100-350 15-150 15-350 keV
Fluence PL 1.45e-06 2.40e-06 3.02e-06 7.57e-06 8.99e-06 1.44e-05 erg/cm2
90%_error_low -7.83e-08 -7.72e-08 -1.06e-07 -5.75e-07 -2.61e-07 -6.40e-07 erg/cm2
90%_error_hi 8.00e-08 7.70e-08 1.05e-07 6.04e-07 2.61e-07 6.62e-07 erg/cm2
Peak flux PL 4.19e-04 4.24e-03 4.65e-02 4.95e+00 2.07e-01 3.76e+00 ph/cm2/s
90%_error_low -2.80e-05 N/A N/A -2.21e-01 N/A N/A ph/cm2/s
90%_error_hi 6.05e-05 N/A N/A 6.76e-01 N/A N/A ph/cm2/s
Fluence CPL 1.32e-06 2.46e-06 3.13e-06 4.73e-06 8.79e-06 1.16e-05 erg/cm2
90%_error_low -1.01e-07 -8.46e-08 -1.22e-07 -1.00e-06 -2.84e-07 -1.04e-06 erg/cm2
90%_error_hi 1.04e-07 8.51e-08 1.23e-07 1.34e-06 2.83e-07 1.35e-06 erg/cm2
Peak flux CPL 1.49e+00 2.37e+00 2.25e+00 1.66e+00 7.05e+00 7.77e+00 ph/cm2/s
90%_error_low -2.84e-01 -2.03e-01 -1.91e-01 -4.77e-01 -5.07e-01 -7.11e-01 ph/cm2/s
90%_error_hi 2.97e-01 2.05e-01 1.95e-01 7.03e-01 5.08e-01 8.38e-01 ph/cm2/s
======================================================================
Image
Pre-slew 15.0-350.0 keV image (Event data)
#   RAcent    DECcent   POSerr    Theta     Phi              Peak Cts       SNR   Name
  128.6695    70.8043   0.0042    45.3602   -30.6633        13.7827072     45.714 TRIG_00770981

Foreground time interval of the image:
-35.208  41.328 (delta_t =  76.536 [sec])
Background time interval of the image:
-239.248 -35.208 (delta_t = 204.040 [sec])
Light Curves
Note: The mask-weighted lightcurves have units of either count/det or counts/sec/det, where a det is 0.4 x 0.4 = 0.16 sq cm.
Full-time range; 1 s binning
Other quick-look light curves:
- 64 ms binning (zoomed)
- 16 ms binning (zoomed)
- 8 ms binning (zoomed)
- 2 ms binning (zoomed)
- SN=5 or 10 s binning (full-time range)
- Raw light curve
Spectra
- 64 ms binning (zoomed)
- 16 ms binning (zoomed)
- 8 ms binning (zoomed)
- 2 ms binning (zoomed)
- SN=5 or 10 s binning (full-time range)
- Raw light curve
Spectra
Notes:
- 1) The fitting includes the systematic errors.
- 2) When the burst includes telescope slew time periods, the fitting uses an average response file made from multiple 5-s response files through out the slew time plus single time preiod for the non-slew times, and weighted by the total counts in the corresponding time period using addrmf. An average response file is needed becuase a spectral fit using the pre-slew DRM will introduce some errors in both a spectral shape and a normalization if the PHA file contains a lot of the slew/post-slew time interval.
- 3) For fits to more complicated models (e.g. a power-law over a cutoff power-law), the BAT team has decided to require a chi-square improvement of more than 6 for each extra dof.
Time averaged spectrum fit using the average DRM
Power-law model
Time interval is from  -35.208 sec. to   41.328 sec.

Spectral model in power-law:
------------------------------------------------------------
Parameters  : value       lower 90%   higher 90%
Photon index: -1.66934     ( -0.051889   0.0517362 )
Norm@50keV  : 1.26452E-02    ( -0.000358263   0.000358212 )
------------------------------------------------------------
#Fit statistic : Chi-Squared =          58.46 using 59 PHA bins.
# Reduced chi-squared =          1.026 for     57 degrees of freedom
# Null hypothesis probability =   4.213783e-01

Photon flux (15-150 keV)    in 76.54 sec: 1.66191 ( -0.05345  0.05365 ) ph/cm2/s
Energy fluence (15-150 keV)             : 8.98603e-06 ( -2.60965e-07  2.61136e-07 ) ergs/cm2
Cutoff power-law model
Time interval is from  -35.208 sec. to   41.328 sec.
Spectral model in the cutoff power-law:
------------------------------------------------------------
Parameters  : value       lower 90%   higher 90%
Photon index: -1.27732     ( -0.214759   0.22513 )
Epeak [keV] : 101.244      ( -18.4256 54.6152 )
Norm@50keV  : 1.91453E-02    ( -0.00380462   0.00501101 )
------------------------------------------------------------
#Fit statistic : Chi-Squared =          48.44 using 59 PHA bins.
# Reduced chi-squared =         0.8649 for     56 degrees of freedom
# Null hypothesis probability =   7.536400e-01

Photon flux (15-150 keV)    in 76.54 sec: 1.61335 ( -0.05867  0.05902 ) ph/cm2/s
Energy fluence (15-150 keV)             : 8.78901e-06 ( -2.83735e-07  2.82684e-07 ) ergs/cm2
1-s peak spectrum fit
Power-law model
Time interval is from    6.176 sec. to    7.176 sec.

Spectral model in power-law:
------------------------------------------------------------
Parameters  : value       lower 90%   higher 90%
Photon index: -1.16034     ( -0.105368   0.106408 )
Norm@50keV  : 6.18777E-02    ( -0.00408334   0.0040795 )
------------------------------------------------------------
#Fit statistic : Chi-Squared =          63.00 using 59 PHA bins.
# Reduced chi-squared =          1.105 for     57 degrees of freedom
# Null hypothesis probability =   2.723710e-01

Photon flux (15-150 keV)    in 1 sec: 0.206518 (    ) ph/cm2/s
Energy fluence (15-150 keV)             : 6.35097e-07 ( -4.39847e-08  4.41066e-08 ) ergs/cm2
Cutoff power-law model
Time interval is from    6.176 sec. to    7.176 sec.
Spectral model in the cutoff power-law:
------------------------------------------------------------
Parameters  : value       lower 90%   higher 90%
Photon index: -0.358233     ( -0.459799   0.515808 )
Epeak [keV] : 118.837      ( -25.5438 78.9416 )
Norm@50keV  : 0.140621    ( -0.0516324   0.0919689 )
------------------------------------------------------------
#Fit statistic : Chi-Squared =          53.46 using 59 PHA bins.
# Reduced chi-squared =         0.9547 for     56 degrees of freedom
# Null hypothesis probability =   5.715000e-01

Photon flux (15-150 keV)    in 1 sec: 7.04655 ( -0.50669  0.50757 ) ph/cm2/s
Energy fluence (15-150 keV)             : 6.2273e-07 ( -4.57643e-08  4.56139e-08 ) ergs/cm2
Time-resolved spectra
Distribution
T90 vs. Hardness ratio plot
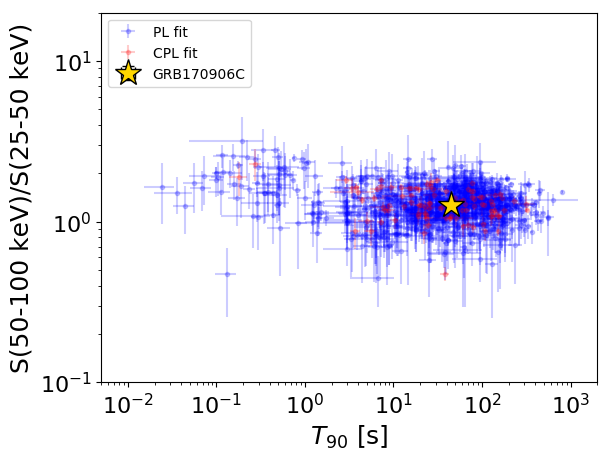
T90                                   = 45.076 sec.
Hardness ratio (energy fluence ratio) = 1.27133460256
S(15-50 keV) vs. S(50-150 keV) plot
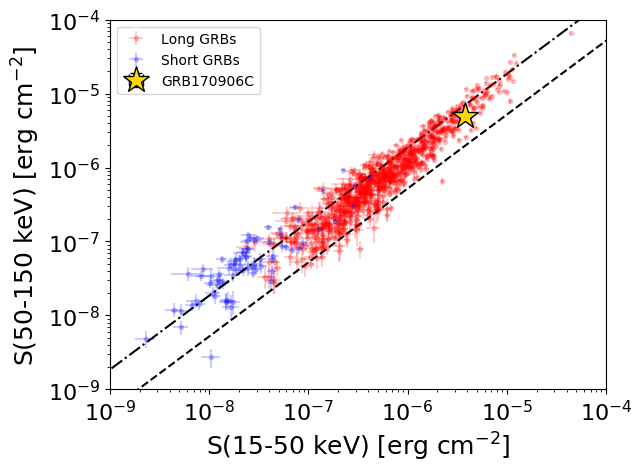
S(15-50 keV)  = 3.777212e-06
S(50-150 keV) = 5.011664e-06
The dash-dotted line and the dashed line traces the fluences calculated from the Band function with Epeak = 15 and 150 keV, respectively. Both lines assume a canonical values of alpha = -1 and beta = -2.5.
Mask shadow pattern
IMX = 8.710630366018427E-01, IMY = 5.164456075814051E-01
Spacecraft aspect plot
Bright source in the pre-burst/pre-slew/post-slew images
Pre-burst image of 15-350 keV band
Time interval of the image:
-239.248000 -35.208000

# RAcent  DECcent POSerr Theta    Phi  PeakCts   SNR AngSep     Name
#  [deg]    [deg]    ['] [deg]  [deg]                   [']
254.4698  35.3272    2.4  22.4  165.1   0.9219   4.8    1.1	Her X-1
299.5224  35.0938    4.2  39.1   96.1   2.0312   2.8    7.3	Cyg X-1
308.1799  40.9780    2.7  39.3   81.8   3.2110   4.3    3.5	Cyg X-3
221.5535   5.7530    2.5  56.7 -151.8   5.7325   4.7 ------	UNKNOWN
Pre-slew background subtracted image of 15-350 keV band
Time interval of the image:
-35.208000 41.328000

# RAcent  DECcent POSerr Theta    Phi  PeakCts   SNR AngSep     Name
#  [deg]    [deg]    ['] [deg]  [deg]                   [']
254.3937  35.5020    4.5  22.2  165.2  -0.4084  -2.6   10.1	Her X-1
299.6085  35.2255    9.4  39.0   95.9  -0.6214  -1.2    1.7	Cyg X-1
308.1596  40.7907    4.3  39.4   82.1  -1.3126  -2.7   10.0	Cyg X-3
259.0263   5.2927    3.5  52.7  162.4   1.8205   3.3 ------	UNKNOWN
338.9313  69.5454    2.4  37.1   27.7   1.0129   4.9 ------	UNKNOWN
250.3813   1.8227    2.7  55.8  173.2   2.8158   4.2 ------	UNKNOWN
235.1430   2.5728    2.5  56.4 -168.5   2.8026   4.6 ------	UNKNOWN
128.6695  70.8043    0.3  45.4  -30.7  13.7818  45.7 ------	UNKNOWN
117.9956  66.5739    2.3  51.0  -29.6   2.3563   5.1 ------	UNKNOWN
Post-slew image of 15-350 keV band
Time interval of the image:
391.852590 839.438700
840.752000 962.867400

# RAcent  DECcent POSerr Theta    Phi  PeakCts   SNR AngSep     Name
#  [deg]    [deg]    ['] [deg]  [deg]                   [']
268.3451  -1.3277   13.1  43.3  -57.9  -1.3640  -0.9    7.6	SW J1753.5-0127
273.9882 -14.1343    8.2  36.2  -76.8   1.5888   1.4    6.0	GX 17+2
276.0250 -30.3248   37.9  37.9 -103.9   0.3295   0.3    5.8	H1820-303
285.0360 -24.9205   42.1  28.4 -101.0  -0.1641  -0.3    0.0	HT1900.1-2455
288.8015  10.9204    1.3  30.9  -23.7   4.3730   8.8    1.5	GRS 1915+105
299.6062  35.2099    2.9  47.1    9.9   3.1219   4.0    0.9	Cyg X-1
308.2264  40.9854    4.6  51.7   19.9   4.5647   2.5    5.6	Cyg X-3
266.0122  -0.4798    3.0  45.8  -57.6   8.6500   3.9 ------	UNKNOWN