Analysis Summary
Notes:
- 1) No attempt has been made to eliminate the non-significant decimal places.
- 2) This batgrbproduct analysis is done using the HEASARC data.
- 3) This batgrbproduct analysis is using the flight position for the mask-weighting calculation.
======================================================================
                  BAT GRB EVENT DATA PROCESSING REPORT
    Process Script Ver: batgrbproduct v2.46
    Process Start Time: Thu Sep 28 17:34:36 EDT 2017
             Host Name: bat1
   Current Working Dir: /local/data/bat1/alien/Swift_3rdBATcatalog/event/batevent_reproc/trigger772006
======================================================================

  Trigger: 00772006      Segment: 000

  BAT Trigger Time: 526872876.608   [s; MET]
      Trigger Stop: 526872880.704   [s; MET]
               UTC: 2017-09-12T01:34:16.935740    [includes UTCF correction]
       Where From?: TDRSS position message

  BAT
    RA: 167.372184088217   Dec: -54.3596433863869  [deg; J2000]

     Catalogged Source?: NO
     Point Source?:      YES
     GRB Indicated?:     YES    [ by BAT flight software ]
     Image S/N Ratio:    10.13
     Image Trigger?:     NO
     Rate S/N Ratio:     13.7477270848675  [ if not an image trigger ]
     Image S/N Ratio:    10.13

  Analysis Position:   [ source = BAT ]
    RA: 167.372184088217   Dec: -54.3596433863869  [deg; J2000]

  Refined Position:   [ source = BAT pre-slew burst ]
    RA: 167.38540773673   Dec: -54.3436488012755  [deg; J2000]
        { 11h 09m 32.5s , -54d 20' 37.1" }
         +/- 2.02751875572444 [arcmin] (estimated 90% radius based on SNR)
         +/- 1.03514925446332 [arcmin] (formal 1-sigma fit error)
    SNR: 11.0814635506224

  Angular difference between the analysis and refined position is 1.065270 arcmin

  Partial Coding Fraction: 0.3476562    [ including projection effects ]

  Duration
     T90: 21.1840000152588 +/- 5.43548050044814
        Measured from: -0.120000004768372
                   to: 21.0640000104904     [s; relative to TRIGTIME]
     T50: 8.89600002765656 +/- 3.83533050225048
        Measured from: 2.12000000476837
                   to: 11.0160000324249     [s; relative to TRIGTIME]


  Fluence
     Peak Flux  (peak 1 second)
        Measured from: 2.48400002717972
                   to: 3.48400002717972     [s; relative to TRIGTIME]
     Total Fluence
        Measured from: -1.20800000429153
                   to: 26.3120000362396     [s; relative to TRIGTIME]

             Band 1     Band 2     Band 3     Band 4
              15-25      25-50     50-100    100-350     keV
 Total     0.698288   0.691404   0.416102   0.086586
           0.078741   0.072286   0.058080   0.050948 [error]
 Peak      0.096947   0.076263   0.037659   0.014350
           0.015877   0.014470   0.011682   0.010129 [error]

     [ fluence units of on-axis counts / fully illuminated detector ]

======================================================================


====== Table of the duration information =============================

        Value   tstart    tstop
T100   27.520   -1.208   26.312
T90    21.184   -0.120   21.064
T50     8.896    2.120   11.016
Peak    1.000    2.484    3.484


====== Spectral Analysis Summary =====================================

Model      : spectral model: simple power-law (PL) and cutoff power-law (CPL)
Ph_index   : photon index: E^{Ph_index}
Ph_90err   : 90% error of the photon index
Epeak      : Epeak in keV
Epeak_90err: 90% error of Epeak
Norm       : normalization at 50 keV in both the PL model and CPL model
Nomr_90err : 90% error of the normalization
chi2       : Chi-Squared
dof        : degree of freedo

=== Time-averaged spectral analysis ===
(Best model with acceptable fit: PL)

Model Ph_index Ph_90err_low Ph_90err_hi  Epeak  Epeak_90err_low  Epeak_90err_hi  Norm       Nomr_90err_low    Norm_90err_hi    chi2    dof
PL      -2.010    -0.218      0.208       -           -               -         4.35e-03     -5.72e-04          5.58e-04      40.320   57
CPL     -1.986    -0.107      0.875       26.994     -24.757       -26.994      4.49e-03        N/A               N/A         40.320   56


=== 1-s peak spectral analysis ===
(Best model with acceptable fit: PL)

Model Ph_index Ph_90err_low Ph_90err_hi  Epeak  Epeak_90err_low  Epeak_90err_hi  Norm       Nomr_90err_low    Norm_90err_hi    chi2    dof
PL      -2.253     -0.449     0.393       -           -               -         1.19e-02     -3.35e-03          3.14e-03      45.500   57
CPL     -2.489     -0.263     1.546      189.912      N/A           N/A         8.95e-03        N/A               N/A         45.350   56


=== Fluence/Peak Flux Summary ===

              Model    Band1     Band2     Band3     Band4     Band5     Total
                       15-25     25-50    50-100    100-350    15-150    15-350    keV
Fluence         PL   2.47e-07  3.34e-07  3.32e-07  5.94e-07  1.11e-06  1.51e-06   erg/cm2
      90%_error_low -4.20e-08 -3.70e-08 -5.91e-08 -1.91e-07 -1.36e-07 -2.57e-07   erg/cm2
      90%_error_hi   4.36e-08  3.69e-08  5.94e-08  2.44e-07  1.38e-07  2.93e-07   erg/cm2
Peak flux       PL   1.01e+00  6.57e-01  2.75e-01  1.58e-01  2.03e+00  2.10e+00   ph/cm2/s
      90%_error_low -2.86e-01 -1.31e-01 -9.86e-02 -8.71e-02 -4.06e-01 -4.16e-01   ph/cm2/s
      90%_error_hi   3.03e-01  1.31e-01  1.02e-01  1.35e-01  4.08e-01  4.16e-01   ph/cm2/s

Fluence        CPL   2.47e-07  3.35e-07  3.32e-07  5.68e-07  1.10e-06  1.48e-06   erg/cm2
      90%_error_low    N/A       N/A       N/A    -4.15e-07    N/A    -4.57e-07   erg/cm2
      90%_error_hi     N/A       N/A       N/A     5.89e-07    N/A     3.39e-07   erg/cm2
Peak flux      CPL   9.76e-01  6.73e-01  2.79e-01    N/A    1.99e+00  2.05e+00   ph/cm2/s
      90%_error_low -2.54e-01 -1.33e-01     N/A   -8.71e-02 -3.96e-01     N/A     ph/cm2/s
      90%_error_hi   2.67e-01  1.34e-01     N/A    1.35e-01  3.98e-01     N/A     ph/cm2/s

======================================================================
Image
Pre-slew 15.0-350.0 keV image (Event data)
#   RAcent    DECcent   POSerr    Theta     Phi              Peak Cts       SNR   Name
  167.3854   -54.3436   0.0173    40.6395  -139.7028         1.7896122     11.081 TRIG_00772006

Foreground time interval of the image:
 -1.208  26.312 (delta_t =  27.520 [sec])
Background time interval of the image:
-77.907  -1.208 (delta_t =  76.699 [sec])
Light Curves
Note: The mask-weighted lightcurves have units of either count/det or counts/sec/det, where a det is 0.4 x 0.4 = 0.16 sq cm.
Full-time range; 1 s binning
Other quick-look light curves:
- 64 ms binning (zoomed)
- 16 ms binning (zoomed)
- 8 ms binning (zoomed)
- 2 ms binning (zoomed)
- SN=5 or 10 s binning (full-time range)
- Raw light curve
Spectra
- 64 ms binning (zoomed)
- 16 ms binning (zoomed)
- 8 ms binning (zoomed)
- 2 ms binning (zoomed)
- SN=5 or 10 s binning (full-time range)
- Raw light curve
Spectra
Notes:
- 1) The fitting includes the systematic errors.
- 2) When the burst includes telescope slew time periods, the fitting uses an average response file made from multiple 5-s response files through out the slew time plus single time preiod for the non-slew times, and weighted by the total counts in the corresponding time period using addrmf. An average response file is needed becuase a spectral fit using the pre-slew DRM will introduce some errors in both a spectral shape and a normalization if the PHA file contains a lot of the slew/post-slew time interval.
- 3) For fits to more complicated models (e.g. a power-law over a cutoff power-law), the BAT team has decided to require a chi-square improvement of more than 6 for each extra dof.
Time averaged spectrum fit using the average DRM
Power-law model
Time interval is from   -1.208 sec. to   26.312 sec.

Spectral model in power-law:
------------------------------------------------------------
Parameters  : value       lower 90%   higher 90%
Photon index: -2.0096     ( -0.217587   0.208216 )
Norm@50keV  : 4.35423E-03    ( -0.000572253   0.00055815 )
------------------------------------------------------------
#Fit statistic : Chi-Squared =          40.32 using 59 PHA bins.
# Reduced chi-squared =         0.7075 for     57 degrees of freedom
# Null hypothesis probability =   9.537863e-01

Photon flux (15-150 keV)    in 27.52 sec: 0.656082 ( -0.075132  0.075411 ) ph/cm2/s
Energy fluence (15-150 keV)             : 1.10581e-06 ( -1.35992e-07  1.3753e-07 ) ergs/cm2
Cutoff power-law model

Time interval is from   -1.208 sec. to   26.312 sec.
Spectral model in the cutoff power-law:
------------------------------------------------------------
Parameters  : value       lower 90%   higher 90%
Photon index: -1.98578     ( -0.107244   0.875378 )
Epeak [keV] : 26.9937      ( -24.7657 -27.0027 )
Norm@50keV  : 4.48744E-03    (     )
------------------------------------------------------------
#Fit statistic : Chi-Squared =          40.32 using 59 PHA bins.
# Reduced chi-squared =         0.7200 for     56 degrees of freedom
# Null hypothesis probability =   9.433133e-01

Photon flux (15-150 keV)    in 27.52 sec: 0.655345 ( -0.078908  0.073835 ) ph/cm2/s
Energy fluence (15-150 keV)             : 1.10354e-06 ( 0  0 ) ergs/cm2
1-s peak spectrum fit
Power-law model
Time interval is from    2.484 sec. to    3.484 sec.

Spectral model in power-law:
------------------------------------------------------------
Parameters  : value       lower 90%   higher 90%
Photon index: -2.25334     ( -0.449191   0.393492 )
Norm@50keV  : 1.18941E-02    ( -0.00334767   0.00314462 )
------------------------------------------------------------
#Fit statistic : Chi-Squared =          45.50 using 59 PHA bins.
# Reduced chi-squared =         0.7983 for     57 degrees of freedom
# Null hypothesis probability =   8.633860e-01

Photon flux (15-150 keV)    in 1 sec: 2.02622 ( -0.40635  0.40765 ) ph/cm2/s
Energy fluence (15-150 keV)             : 1.12766e-07 ( -2.56456e-08  2.63445e-08 ) ergs/cm2
Cutoff power-law model
Time interval is from    2.484 sec. to    3.484 sec.
Spectral model in the cutoff power-law:
------------------------------------------------------------
Parameters  : value       lower 90%   higher 90%
Photon index: -2.48865     ( -0.254834   1.55376 )
Epeak [keV] : 189.912      (   )
Norm@50keV  : 8.94737E-03    (     )
------------------------------------------------------------
#Fit statistic : Chi-Squared =          45.34 using 59 PHA bins.
# Reduced chi-squared =         0.8097 for     56 degrees of freedom
# Null hypothesis probability =   8.449202e-01

Photon flux (15-150 keV)    in 1 sec: 1.99450 ( -0.3957  0.39777 ) ph/cm2/s
Energy fluence (15-150 keV)             : 0 ( 0  0 ) ergs/cm2
Time-resolved spectra

Distribution
T90 vs. Hardness ratio plot
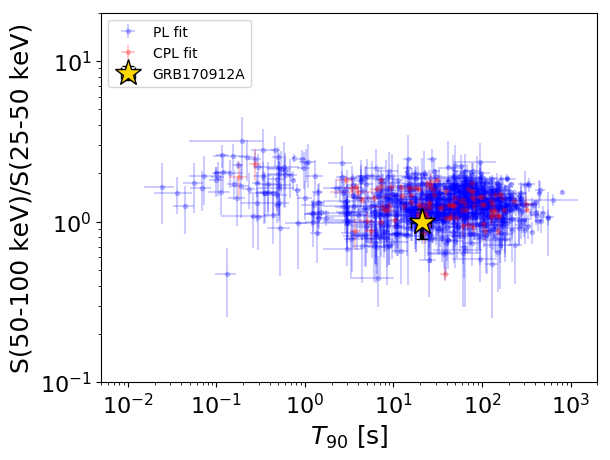
T90                                   = 21.184 sec.
Hardness ratio (energy fluence ratio) = 0.993413005569
S(15-50 keV) vs. S(50-150 keV) plot
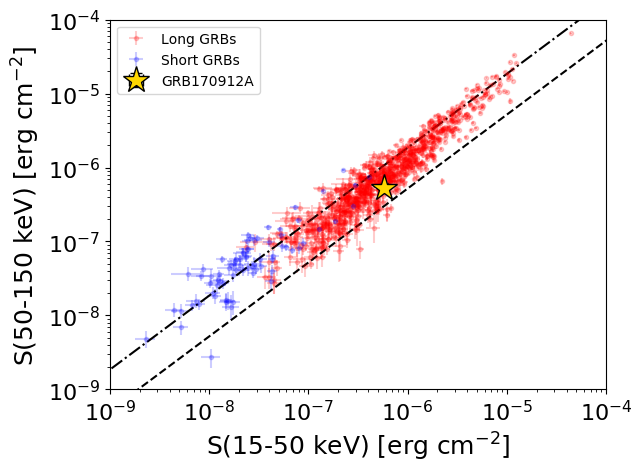
S(15-50 keV)  = 5.812599e-07
S(50-150 keV) = 5.245621e-07
The dash-dotted line and the dashed line traces the fluences calculated from the Band function with Epeak = 15 and 150 keV, respectively. Both lines assume a canonical values of alpha = -1 and beta = -2.5.
Mask shadow pattern
IMX = -6.546266131044436E-01, IMY = 5.551078567736205E-01
Spacecraft aspect plot
Bright source in the pre-burst/pre-slew/post-slew images
Pre-burst image of 15-350 keV band
Time interval of the image:
-77.907400 -1.208000

# RAcent  DECcent POSerr Theta    Phi  PeakCts   SNR AngSep     Name
#  [deg]    [deg]    ['] [deg]  [deg]                   [']
170.2125 -60.5619    3.4  37.6 -148.6   0.8023   3.4    4.8	Cen X-3
186.6347 -62.7489    3.2  29.8 -152.2   0.6159   3.6    1.4	GX 301-2
244.9894 -15.6343    0.5  33.6    4.7   4.0770  22.4    0.7	Sco X-1
256.1211 -37.8704    2.9  19.0   51.3   0.6345   3.9    6.6	4U 1700-377
256.3022 -36.4354    7.1  20.1   48.4   0.2673   1.6    6.5	GX 349+2
262.9958 -24.7324    5.3  32.6   40.1   0.4759   2.2    1.1	GX 1+4
264.7178 -44.5932   15.8  21.4   77.7   0.1370   0.7    8.7	4U 1735-44
270.4244 -25.2065    3.6  36.5   49.8   0.8730   3.2   10.8	GX 5-1
270.1312 -25.6959    3.3  36.0   50.0   0.9383   3.5    9.7	GRS 1758-258
273.9123 -13.9010    5.7  47.4   43.0  -1.1243  -2.0    9.8	GX 17+2
275.8491 -30.2464    4.4  36.4   61.5   0.8824   2.6    8.2	H1820-303
263.0288 -33.7518    4.8  26.0   52.7   0.4456   2.4    5.4	GX 354-0
312.5510 -62.9198    2.0  43.8  125.0   3.4875   5.8 ------	UNKNOWN
233.8387 -57.2242    0.3   9.3  165.4   4.6424  34.0 ------	UNKNOWN
195.9670 -60.0142    2.8  24.9 -148.0   0.6434   4.2 ------	UNKNOWN
133.8450 -58.7083    2.7  55.0 -156.2   2.9518   4.3 ------	UNKNOWN
Pre-slew background subtracted image of 15-350 keV band
Time interval of the image:
-1.208000 26.312000

# RAcent  DECcent POSerr Theta    Phi  PeakCts   SNR AngSep     Name
#  [deg]    [deg]    ['] [deg]  [deg]                   [']
170.4459 -60.6914  209.2  37.4 -148.8   0.0070   0.1    5.6	Cen X-3
186.8658 -62.8665   38.4  29.7 -152.5  -0.0291  -0.3    8.1	GX 301-2
245.1085 -15.5920   45.9  33.6    4.8   0.0249   0.3    8.0	Sco X-1
255.9466 -37.9886    7.0  18.8   51.4   0.1464   1.7    8.9	4U 1700-377
256.2734 -36.5648    4.9  20.0   48.6   0.2175   2.4   11.6	GX 349+2
263.1124 -24.8737    4.4  32.6   40.4  -0.3103  -2.6    9.5	GX 1+4
264.6069 -44.3203    5.8  21.4   76.9   0.2026   2.0    9.7	4U 1735-44
270.4745 -25.2083    4.9  36.6   49.9  -0.3866  -2.3   12.9	GX 5-1
270.1805 -25.8803    0.0  35.9   50.3   0.1650   1.0   10.5	GRS 1758-258
274.1368 -14.0171    6.8  47.5   43.4  -0.5715  -1.7    7.7	GX 17+2
275.8365 -30.4327    6.2  36.3   61.7   0.3259   1.9    6.0	H1820-303
263.1273 -33.6909    3.3  26.1   52.7  -0.3610  -3.5   11.0	GX 354-0
237.8222  10.9159    2.4  59.0  -10.4   2.3773   4.8 ------	UNKNOWN
167.3854 -54.3437    1.0  40.6 -139.7   1.7895  11.1 ------	UNKNOWN
Post-slew image of 15-350 keV band
Time interval of the image:
102.692600 962.455000

# RAcent  DECcent POSerr Theta    Phi  PeakCts   SNR AngSep     Name
#  [deg]    [deg]    ['] [deg]  [deg]                   [']
135.5076 -40.6254    2.6  25.2 -163.4   3.6050   4.5    4.3	Vela X-1
170.4014 -60.6547    1.8   6.5   73.6   4.8882   6.3    3.2	Cen X-3
186.6983 -62.7804    0.7  13.0   44.6  12.5218  15.7    1.3	GX 301-2
233.8316 -57.2191    0.3  35.9   29.0  48.2446  41.6 ------	UNKNOWN
200.0574 -61.4331    3.5  18.5   32.3   2.3691   3.3 ------	UNKNOWN
113.7126 -22.9231    3.2  50.6 -167.0   8.6147   3.6 ------	UNKNOWN