Analysis Summary
Notes:
- 1) No attempt has been made to eliminate the non-significant decimal places.
- 2) This batgrbproduct analysis is done using the HEASARC data.
- 3) This batgrbproduct analysis is using the flight position for the mask-weighting calculation.
======================================================================
                  BAT GRB EVENT DATA PROCESSING REPORT
    Process Script Ver: batgrbproduct v2.46
    Process Start Time: Thu Sep 28 17:31:07 EDT 2017
             Host Name: bat1
   Current Working Dir: /local/data/bat1/alien/Swift_3rdBATcatalog/event/batevent_reproc/trigger772052
======================================================================

  Trigger: 00772052      Segment: 000

  BAT Trigger Time: 526890846.512   [s; MET]
      Trigger Stop: 526890846.576   [s; MET]
               UTC: 2017-09-12T06:33:46.838680    [includes UTCF correction]
       Where From?: (*SHORT BURST*) TDRSS scaled map message

  BAT
    RA: 215.466285762874   Dec: -62.0301303055386  [deg; J2000]

     Catalogged Source?: NO
     Point Source?:      YES
     GRB Indicated?:     YES    [ by BAT flight software ]
     Image S/N Ratio:    9.99
     Image Trigger?:     NO
     Rate S/N Ratio:     20.7364413533277  [ if not an image trigger ]
     Image S/N Ratio:    9.99

  Analysis Position:   [ source = BAT ]
    RA: 215.466285762874   Dec: -62.0301303055386  [deg; J2000]

  Refined Position:   [ source = BAT pre-slew burst ]
    RA: 215.465623475167   Dec: -61.9980189469316  [deg; J2000]
        { 14h 21m 51.7s , -61d 59' 52.9" }
         +/- 0.625097762430102 [arcmin] (estimated 90% radius based on SNR)
         +/- 0.187969354250651 [arcmin] (formal 1-sigma fit error)
    SNR: 59.5142981937293

  Angular difference between the analysis and refined position is 1.926772 arcmin

  Partial Coding Fraction: 1.03125    [ including projection effects ]

  Duration
     T90: 17.8840000033379 +/- 7.83311223762219
        Measured from: 0.00399994850158691
                   to: 17.8879999518394     [s; relative to TRIGTIME]
     T50: 7.59199994802475 +/- 0.318044033198825
        Measured from: 1.39999997615814
                   to: 8.99199992418289     [s; relative to TRIGTIME]


  Fluence
     Peak Flux  (peak 1 second)
        Measured from: -0.0720000267028809
                   to: 0.927999973297119     [s; relative to TRIGTIME]
     Total Fluence
        Measured from: -1.57600003480911
                   to: 38.7479999661446     [s; relative to TRIGTIME]

             Band 1     Band 2     Band 3     Band 4
              15-25      25-50     50-100    100-350     keV
 Total     1.605513   1.805950   0.961381   0.228126
           0.051359   0.048127   0.037836   0.029953 [error]
 Peak      0.229248   0.295522   0.150556   0.015850
           0.010809   0.010943   0.008451   0.005348 [error]

     [ fluence units of on-axis counts / fully illuminated detector ]

======================================================================


====== Table of the duration information =============================

        Value   tstart    tstop
T100   40.324   -1.576   38.748
T90    17.884    0.004   17.888
T50     7.592    1.400    8.992
Peak    1.000   -0.072    0.928


====== Spectral Analysis Summary =====================================

Model      : spectral model: simple power-law (PL) and cutoff power-law (CPL)
Ph_index   : photon index: E^{Ph_index}
Ph_90err   : 90% error of the photon index
Epeak      : Epeak in keV
Epeak_90err: 90% error of Epeak
Norm       : normalization at 50 keV in both the PL model and CPL model
Nomr_90err : 90% error of the normalization
chi2       : Chi-Squared
dof        : degree of freedo

=== Time-averaged spectral analysis ===
(Best model with acceptable fit: PL)

Model Ph_index Ph_90err_low Ph_90err_hi  Epeak  Epeak_90err_low  Epeak_90err_hi  Norm       Nomr_90err_low    Norm_90err_hi    chi2    dof
PL      -1.886    -0.070      0.069       -           -               -         6.49e-03     -2.41e-04          2.40e-04      44.630   57
CPL     -1.718    -0.218      0.279       81.472     -27.793       -81.472      7.89e-03     -1.21e-03          2.97e-03      43.460   56


=== 1-s peak spectral analysis ===
(Best model with acceptable fit: PL)

Model Ph_index Ph_90err_low Ph_90err_hi  Epeak  Epeak_90err_low  Epeak_90err_hi  Norm       Nomr_90err_low    Norm_90err_hi    chi2    dof
PL      -1.858     -0.083     0.082       -           -               -         4.06e-02     -2.06e-03          2.05e-03      65.550   57
CPL     -1.108     -0.356     0.392       55.300      -6.787        11.827      1.02e-01     -3.53e-02          6.20e-02      51.280   56


=== Fluence/Peak Flux Summary ===

              Model    Band1     Band2     Band3     Band4     Band5     Total
                       15-25     25-50    50-100    100-350    15-150    15-350    keV
Fluence         PL   4.80e-07  6.98e-07  7.56e-07  1.53e-06  2.40e-06  3.46e-06   erg/cm2
      90%_error_low -3.02e-08 -2.55e-08 -3.84e-08 -1.63e-07 -8.88e-08 -1.92e-07   erg/cm2
      90%_error_hi   3.09e-08  2.55e-08  3.84e-08  1.76e-07  8.90e-08  2.02e-07   erg/cm2
Peak flux       PL   2.36e+00  1.92e+00  1.06e+00  8.60e-01  5.72e+00  6.20e+00   ph/cm2/s
      90%_error_low -1.77e-01 -9.25e-02 -6.91e-02 -1.06e-01 -2.79e-01 -2.89e-01   ph/cm2/s
      90%_error_hi   1.81e-01  9.23e-02  6.91e-02  1.15e-01  2.79e-01  2.89e-01   ph/cm2/s

Fluence        CPL   4.66e-07  7.08e-07  7.59e-07  1.17e-06  2.37e-06  3.11e-06   erg/cm2
      90%_error_low -3.71e-08 -2.94e-08 -3.95e-08 -3.83e-07 -1.06e-07 -4.02e-07   erg/cm2
      90%_error_hi   3.77e-08  2.97e-08  3.97e-08  4.03e-07  1.06e-07  4.38e-07   erg/cm2
Peak flux      CPL   2.10e+00  2.06e+00  1.09e+00  3.83e-01  5.52e+00  5.64e+00   ph/cm2/s
      90%_error_low -2.09e-01 -1.15e-01 -7.76e-02 -1.21e-01 -2.92e-01 -3.24e-01   ph/cm2/s
      90%_error_hi   2.13e-01  1.17e-01  7.77e-02  1.70e-01  2.93e-01  3.36e-01   ph/cm2/s

======================================================================
Image
Pre-slew 15.0-350.0 keV image (Event data)
#   RAcent    DECcent   POSerr    Theta     Phi              Peak Cts       SNR   Name
  215.4656   -61.9980   0.0033    10.3665  -152.7237         3.5479780     59.514 TRIG_00772052

Foreground time interval of the image:
 -1.576   9.189 (delta_t =  10.765 [sec])
Background time interval of the image:
-239.512  -1.576 (delta_t = 237.936 [sec])
Light Curves
Note: The mask-weighted lightcurves have units of either count/det or counts/sec/det, where a det is 0.4 x 0.4 = 0.16 sq cm.
Full-time range; 1 s binning
Other quick-look light curves:
- 64 ms binning (zoomed)
- 16 ms binning (zoomed)
- 8 ms binning (zoomed)
- 2 ms binning (zoomed)
- SN=5 or 10 s binning (full-time range)
- Raw light curve
Spectra
- 64 ms binning (zoomed)
- 16 ms binning (zoomed)
- 8 ms binning (zoomed)
- 2 ms binning (zoomed)
- SN=5 or 10 s binning (full-time range)
- Raw light curve
Spectra
Notes:
- 1) The fitting includes the systematic errors.
- 2) When the burst includes telescope slew time periods, the fitting uses an average response file made from multiple 5-s response files through out the slew time plus single time preiod for the non-slew times, and weighted by the total counts in the corresponding time period using addrmf. An average response file is needed becuase a spectral fit using the pre-slew DRM will introduce some errors in both a spectral shape and a normalization if the PHA file contains a lot of the slew/post-slew time interval.
- 3) For fits to more complicated models (e.g. a power-law over a cutoff power-law), the BAT team has decided to require a chi-square improvement of more than 6 for each extra dof.
Time averaged spectrum fit using the average DRM
Power-law model
Time interval is from   -1.576 sec. to   38.748 sec.

Spectral model in power-law:
------------------------------------------------------------
Parameters  : value       lower 90%   higher 90%
Photon index: -1.88591     ( -0.0699184   0.0693883 )
Norm@50keV  : 6.48621E-03    ( -0.000240726   0.000239799 )
------------------------------------------------------------
#Fit statistic : Chi-Squared =          44.63 using 59 PHA bins.
# Reduced chi-squared =         0.7830 for     57 degrees of freedom
# Null hypothesis probability =   8.831806e-01

Photon flux (15-150 keV)    in 40.32 sec: 0.925379 ( -0.035597  0.035745 ) ph/cm2/s
Energy fluence (15-150 keV)             : 2.40459e-06 ( -8.87907e-08  8.90334e-08 ) ergs/cm2
Cutoff power-law model
Time interval is from   -1.576 sec. to   38.748 sec.
Spectral model in the cutoff power-law:
------------------------------------------------------------
Parameters  : value       lower 90%   higher 90%
Photon index: -1.71839     ( -0.218245   0.279093 )
Epeak [keV] : 81.4725      ( -27.793 -81.4728 )
Norm@50keV  : 7.89073E-03    ( -0.00120879   0.00296759 )
------------------------------------------------------------
#Fit statistic : Chi-Squared =          43.46 using 59 PHA bins.
# Reduced chi-squared =         0.7761 for     56 degrees of freedom
# Null hypothesis probability =   8.892752e-01

Photon flux (15-150 keV)    in 40.32 sec: 0.913507 ( -0.039894  0.040035 ) ph/cm2/s
Energy fluence (15-150 keV)             : 2.3668e-06 ( -1.06369e-07  1.06013e-07 ) ergs/cm2
1-s peak spectrum fit
Power-law model
Time interval is from   -0.072 sec. to    0.928 sec.

Spectral model in power-law:
------------------------------------------------------------
Parameters  : value       lower 90%   higher 90%
Photon index: -1.85775     ( -0.0831752   0.0820439 )
Norm@50keV  : 4.05706E-02    ( -0.00206184   0.00205071 )
------------------------------------------------------------
#Fit statistic : Chi-Squared =          65.55 using 59 PHA bins.
# Reduced chi-squared =          1.150 for     57 degrees of freedom
# Null hypothesis probability =   2.044584e-01

Photon flux (15-150 keV)    in 1 sec: 5.72100 ( -0.27852  0.27897 ) ph/cm2/s
Energy fluence (15-150 keV)             : 3.7307e-07 ( -1.8983e-08  1.90599e-08 ) ergs/cm2
Cutoff power-law model
Time interval is from   -0.072 sec. to    0.928 sec.
Spectral model in the cutoff power-law:
------------------------------------------------------------
Parameters  : value       lower 90%   higher 90%
Photon index: -1.10798     ( -0.355639   0.391607 )
Epeak [keV] : 55.3003      ( -6.78662 11.8265 )
Norm@50keV  : 0.101635    ( -0.0353103   0.0619633 )
------------------------------------------------------------
#Fit statistic : Chi-Squared =          51.28 using 59 PHA bins.
# Reduced chi-squared =         0.9158 for     56 degrees of freedom
# Null hypothesis probability =   6.537143e-01

Photon flux (15-150 keV)    in 1 sec: 5.52117 ( -0.29245  0.29282 ) ph/cm2/s
Energy fluence (15-150 keV)             : 0 ( 0  0 ) ergs/cm2
Time-resolved spectra
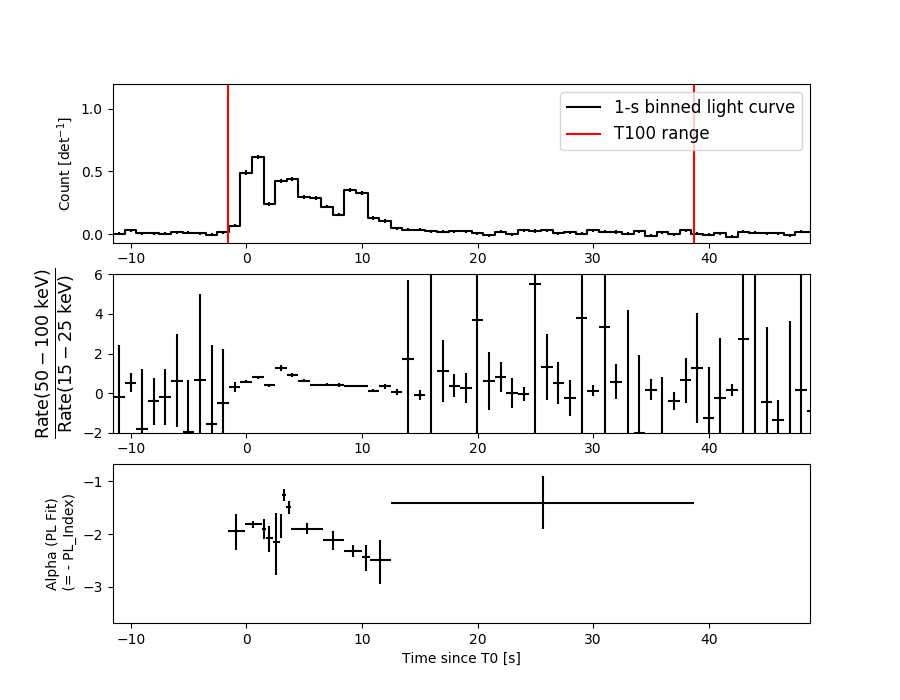
Distribution
T90 vs. Hardness ratio plot
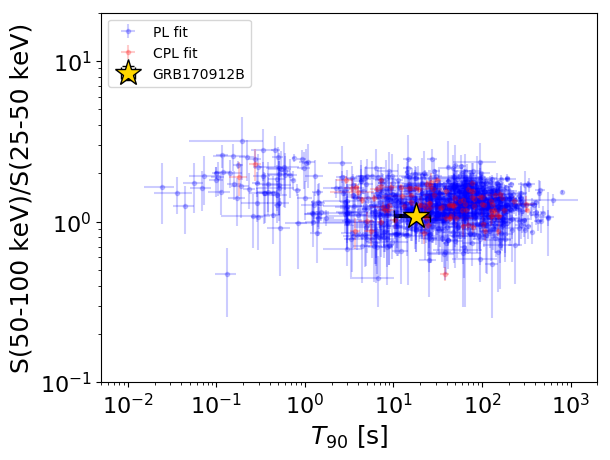
T90                                   = 17.884 sec.
Hardness ratio (energy fluence ratio) = 1.08233071226
S(15-50 keV) vs. S(50-150 keV) plot
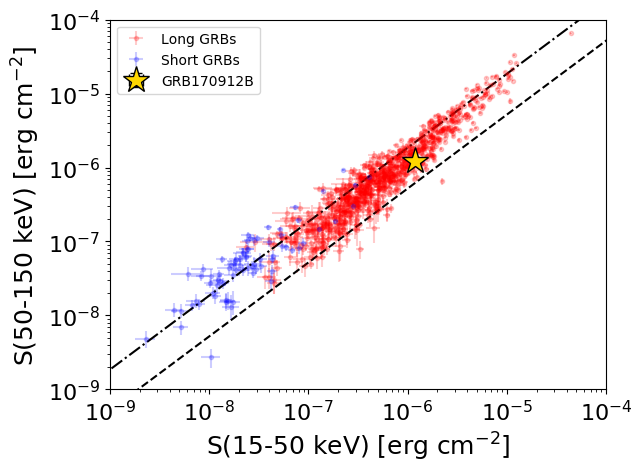
S(15-50 keV)  = 1.1784786e-06
S(50-150 keV) = 1.2261049e-06
The dash-dotted line and the dashed line traces the fluences calculated from the Band function with Epeak = 15 and 150 keV, respectively. Both lines assume a canonical values of alpha = -1 and beta = -2.5.
Mask shadow pattern
IMX = -1.625895900288786E-01, IMY = 8.383375414603572E-02
Spacecraft aspect plot
Bright source in the pre-burst/pre-slew/post-slew images
Pre-burst image of 15-350 keV band
Time interval of the image:
-239.512000 -1.576000

# RAcent  DECcent POSerr Theta    Phi  PeakCts   SNR AngSep     Name
#  [deg]    [deg]    ['] [deg]  [deg]                   [']
170.2341 -60.6646    3.2  31.7 -151.1   1.4225   3.7    3.5	Cen X-3
186.6747 -62.7880    0.9  23.6 -151.0   4.2720  13.2    1.2	GX 301-2
245.0058 -15.6421    0.7  42.4  -11.7   7.1706  16.4    1.5	Sco X-1
255.9863 -37.8443   79.0  24.3   18.8   0.0469   0.1    0.0	4U 1700-377
256.5097 -36.4219    4.9  25.7   18.0   0.7478   2.4    3.6	GX 349+2
263.1378 -24.7624   21.9  38.7   17.6   0.2466   0.5    7.1	GX 1+4
264.6651 -44.2988    3.6  23.1   41.6   1.0885   3.2    9.7	4U 1735-44
270.1773 -25.0057    7.7  41.4   26.6  -0.8406  -1.5    7.3	GX 5-1
270.1734 -25.8201   13.7  40.7   27.2  -0.4513  -0.8    8.4	GRS 1758-258
274.0810 -14.0260   14.6  52.8   24.2  -1.1963  -0.8    4.4	GX 17+2
275.9734 -30.3474   13.5  39.6   37.7   0.5007   0.9    2.8	H1820-303
285.0356 -25.0110    7.5  48.5   42.9  -2.1371  -1.6    5.4	HT1900.1-2455
262.9512 -33.9317    3.9  30.5   25.0   1.0948   3.0    6.1	GX 354-0
294.3245 -40.2662    2.2  41.7   65.2   6.0153   5.3 ------	UNKNOWN
283.7024 -21.9951    2.6  50.4   39.3   6.2291   4.3 ------	UNKNOWN
259.6745  -7.4787    2.7  53.7    4.7   3.8178   4.3 ------	UNKNOWN
233.8573 -57.2291    0.2   0.0   56.6  14.5209  50.0 ------	UNKNOWN
247.9811 -23.6878    2.6  35.1   -4.8   1.6843   4.4 ------	UNKNOWN
Pre-slew background subtracted image of 15-350 keV band
Time interval of the image:
-1.576000 9.188640

# RAcent  DECcent POSerr Theta    Phi  PeakCts   SNR AngSep     Name
#  [deg]    [deg]    ['] [deg]  [deg]                   [']
170.6204 -60.7020    9.8  31.5 -151.0  -0.0879  -1.2   10.1	Cen X-3
186.5265 -62.7142    4.6  23.7 -150.9   0.1553   2.5    4.9	GX 301-2
245.0271 -15.8108    0.0  42.3  -11.6   0.2821   3.0   10.6	Sco X-1
255.8349 -37.7238    9.4  24.3   18.4  -0.0795  -1.2   10.2	4U 1700-377
256.5860 -36.5321    4.7  25.7   18.2   0.1613   2.4    9.8	GX 349+2
262.8801 -24.6840    5.9  38.7   17.2   0.1868   1.9    7.9	GX 1+4
264.5563 -44.3258    4.1  23.0   41.5   0.1975   2.8   10.9	4U 1735-44
270.4167 -25.0615   15.3  41.4   27.0  -0.0816  -0.8    7.3	GX 5-1
270.2979 -25.7639    6.1  40.8   27.4  -0.2113  -1.9    1.3	GRS 1758-258
273.9144 -14.1243   39.9  52.7   24.0   0.0880   0.3    7.5	GX 17+2
276.0840 -30.3969    4.2  39.6   37.9  -0.3414  -2.7    8.4	H1820-303
285.1626 -25.0491    9.8  48.5   43.0  -0.3646  -1.2   10.3	HT1900.1-2455
262.8264 -33.8720    5.3  30.5   24.8   0.1743   2.2    8.4	GX 354-0
344.1671 -72.5916    2.4  41.8  127.3   0.9953   4.9 ------	UNKNOWN
200.0024 -72.7511    2.3  20.5 -179.8   0.3112   5.0 ------	UNKNOWN
215.4656 -61.9980    0.2  10.4 -152.7   3.5478  59.5 ------	UNKNOWN
234.5220  -8.8691    1.7  48.4  -26.8   0.8592   6.7 ------	UNKNOWN
136.5334 -48.5102    2.7  54.2 -153.7   1.1320   4.3 ------	UNKNOWN
Post-slew image of 15-350 keV band
Time interval of the image:
39.188620 962.558000

# RAcent  DECcent POSerr Theta    Phi  PeakCts   SNR AngSep     Name
#  [deg]    [deg]    ['] [deg]  [deg]                   [']
135.6098 -40.5672    6.1  50.4 -146.8   5.7024   1.9    3.8	Vela X-1
170.4158 -60.6624    2.2  21.2 -149.3   4.8729   5.3    3.8	Cen X-3
186.6792 -62.7805    0.8  13.3 -148.7  13.1402  15.1    0.9	GX 301-2
245.0264 -15.6449    1.0  50.9   -5.0  20.9569  11.3    2.7	Sco X-1
256.1452 -37.8717    5.4  34.6   22.1   2.7756   2.1    7.7	4U 1700-377
256.4191 -36.4530    4.3  35.9   21.1   3.6342   2.7    2.0	GX 349+2
263.0851 -24.7894  133.3  48.9   20.1  -0.1970  -0.1    4.9	GX 1+4
264.8244 -44.3150    6.6  33.3   38.4   2.3403   1.7    8.8	4U 1735-44
270.3558 -24.9497    3.4  51.9   27.7  11.6893   3.3    8.7	GX 5-1
270.1531 -25.6198   15.0  51.2   27.9  -2.6558  -0.8   11.0	GRS 1758-258
276.0176 -30.4502    4.6  49.7   36.9   9.2433   2.5    6.9	H1820-303
263.0528 -33.8536    8.3  41.0   26.4   2.0813   1.4    3.4	GX 354-0
255.2128 -41.6661    1.4  31.1   25.0   9.6787   8.5 ------	UNKNOWN
233.8439 -57.2362    0.2  10.4   28.1  55.8723  68.9 ------	UNKNOWN
175.1497 -62.8132    3.0  18.4 -153.1   3.2279   3.8 ------	UNKNOWN
126.7146 -37.7473    3.2  56.7 -151.8  20.1142   3.6 ------	UNKNOWN
204.9639 -20.5518    3.4  42.1  -57.5   9.9519   3.3 ------	UNKNOWN
138.0355 -36.3483    4.1  52.7 -141.7  18.7522   2.8 ------	UNKNOWN
170.1787 -32.1319    2.5  41.5 -108.1  19.4969   4.6 ------	UNKNOWN