Analysis Summary
Notes:
- 1) No attempt has been made to eliminate the non-significant decimal places.
- 2) This batgrbproduct analysis is done using the HEASARC data.
- 3) This batgrbproduct analysis is using the flight position for the mask-weighting calculation.
======================================================================
BAT GRB EVENT DATA PROCESSING REPORT
Process Script Ver: batgrbproduct v2.46
Process Start Time: Fri Oct 20 14:34:01 EDT 2017
Host Name: bat1
Current Working Dir: /local/data/bat1/alien/Swift_3rdBATcatalog/event/batevent_reproc/trigger773509
======================================================================
Trigger: 00773509 Segment: 000
BAT Trigger Time: 527696948.224 [s; MET]
Trigger Stop: 527696952.32 [s; MET]
UTC: 2017-09-21T14:28:48.502900 [includes UTCF correction]
Where From?: TDRSS position message
BAT
RA: 26.8495479369481 Dec: 30.8742207954133 [deg; J2000]
Catalogged Source?: NO
Point Source?: YES
GRB Indicated?: YES [ by BAT flight software ]
Image S/N Ratio: 10.2
Image Trigger?: NO
Rate S/N Ratio: 16.8819430161341 [ if not an image trigger ]
Image S/N Ratio: 10.2
Analysis Position: [ source = BAT ]
RA: 26.8495479369481 Dec: 30.8742207954133 [deg; J2000]
Refined Position: [ source = BAT pre-slew burst ]
RA: 26.8406911730994 Dec: 30.8796537098092 [deg; J2000]
{ 01h 47m 21.8s , +30d 52' 46.8" }
+/- 1.8530781230834 [arcmin] (estimated 90% radius based on SNR)
+/- 0.805485407365669 [arcmin] (formal 1-sigma fit error)
SNR: 12.6012333217451
Angular difference between the analysis and refined position is 0.560605 arcmin
Partial Coding Fraction: 0.8671875 [ including projection effects ]
Duration
T90: 28.8000000119209 +/- 5.92553253459488
Measured from: -18.2960000038147
to: 10.5040000081062 [s; relative to TRIGTIME]
T50: 7.74400001764297 +/- 5.94959091543058
Measured from: -1.84799998998642
to: 5.89600002765656 [s; relative to TRIGTIME]
Fluence
Peak Flux (peak 1 second)
Measured from: 2.74000000953674
to: 3.74000000953674 [s; relative to TRIGTIME]
Total Fluence
Measured from: -21.8159999847412
to: 13 [s; relative to TRIGTIME]
Band 1 Band 2 Band 3 Band 4
15-25 25-50 50-100 100-350 keV
Total 0.357408 0.539242 0.235640 0.043104
0.041420 0.042598 0.037101 0.032268 [error]
Peak 0.038391 0.030822 0.029113 0.010913
0.007219 0.007705 0.006851 0.005700 [error]
[ fluence units of on-axis counts / fully illuminated detector ]
======================================================================
====== Table of the duration information =============================
Value tstart tstop
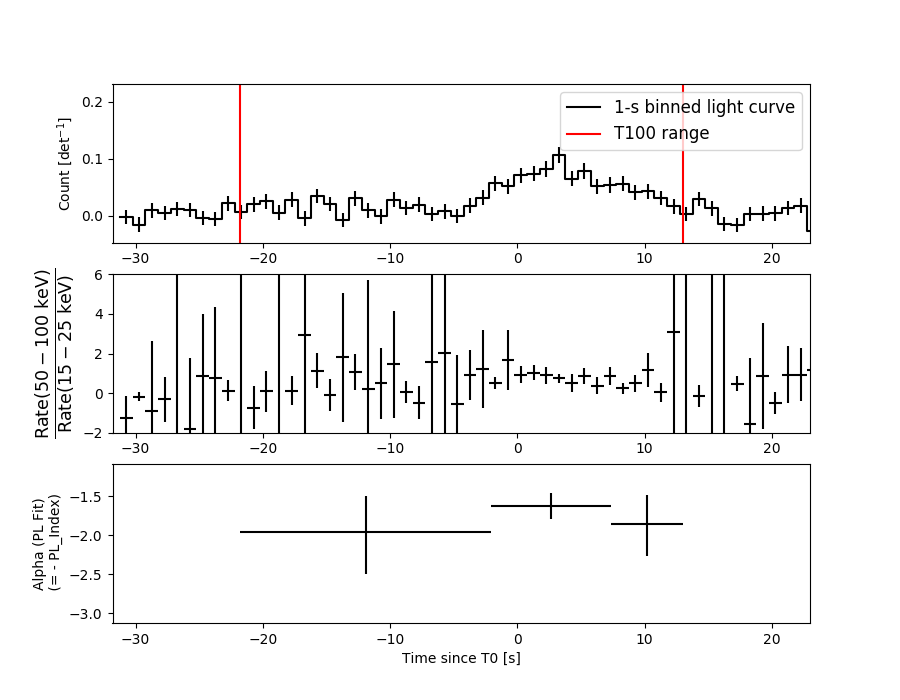
T100 34.816 -21.816 13.000
T90 28.800 -18.296 10.504
T50 7.744 -1.848 5.896
Peak 1.000 2.740 3.740
====== Spectral Analysis Summary =====================================
Model : spectral model: simple power-law (PL) and cutoff power-law (CPL)
Ph_index : photon index: E^{Ph_index}
Ph_90err : 90% error of the photon index
Epeak : Epeak in keV
Epeak_90err: 90% error of Epeak
Norm : normalization at 50 keV in both the PL model and CPL model
Nomr_90err : 90% error of the normalization
chi2 : Chi-Squared
dof : degree of freedo
=== Time-averaged spectral analysis ===
(Best model with acceptable fit: PL)
Model Ph_index Ph_90err_low Ph_90err_hi Epeak Epeak_90err_low Epeak_90err_hi Norm Nomr_90err_low Norm_90err_hi chi2 dof
PL -1.759 -0.176 0.170 - - - 2.08e-03 -2.44e-04 2.41e-04 58.760 57
CPL -0.067 -0.926 1.183 48.528 -6.701 8.226 1.89e-02 -1.89e-02 7.06e-02 47.220 56
=== 1-s peak spectral analysis ===
(Best model with acceptable fit: PL)
Model Ph_index Ph_90err_low Ph_90err_hi Epeak Epeak_90err_low Epeak_90err_hi Norm Nomr_90err_low Norm_90err_hi chi2 dof
PL -1.659 -0.454 0.418 - - - 5.98e-03 -1.61e-03 1.50e-03 67.290 57
CPL -1.668 -1.344 0.897 9999.290 N/A N/A 5.97e-03 N/A N/A 67.290 56
=== Fluence/Peak Flux Summary ===
Model Band1 Band2 Band3 Band4 Band5 Total
15-25 25-50 50-100 100-350 15-150 15-350 keV
Fluence PL 1.18e-07 1.85e-07 2.19e-07 5.01e-07 6.67e-07 1.02e-06 erg/cm2
90%_error_low -1.69e-08 -1.87e-08 -3.39e-08 -1.39e-07 -8.03e-08 -1.78e-07 erg/cm2
90%_error_hi 1.74e-08 1.87e-08 3.43e-08 1.70e-07 8.17e-08 2.03e-07 erg/cm2
Peak flux PL 2.87e-01 2.63e-01 1.66e-01 1.61e-01 7.83e-01 8.78e-01 ph/cm2/s
90%_error_low -9.71e-02 -5.82e-02 -5.78e-02 -8.94e-02 -1.72e-01 -2.02e-01 ph/cm2/s
90%_error_hi 1.03e-01 5.81e-02 5.71e-02 1.38e-01 1.72e-01 2.06e-01 ph/cm2/s
Fluence CPL 9.99e-08 2.23e-07 2.05e-07 5.78e-08 5.75e-07 5.86e-07 erg/cm2
90%_error_low -2.01e-08 -2.74e-08 -4.64e-08 -4.02e-08 -8.09e-08 -8.95e-08 erg/cm2
90%_error_hi 2.01e-08 2.85e-08 4.35e-08 1.05e-07 8.90e-08 1.30e-07 erg/cm2
Peak flux CPL 2.74e-01 2.04e-01 1.05e-01 9.25e-02 6.21e-01 6.76e-01 ph/cm2/s
90%_error_low N/A -8.77e-02 -4.04e-02 -3.87e-02 -2.65e-01 -2.78e-01 ph/cm2/s
90%_error_hi N/A 8.34e-02 2.43e-02 3.07e-02 1.82e-01 2.65e-01 ph/cm2/s
======================================================================
Image
Pre-slew 15.0-350.0 keV image (Event data)
#   RAcent    DECcent   POSerr    Theta     Phi              Peak Cts       SNR   Name
   26.8407    30.8797   0.0153    14.0080    86.4636         1.0985798     12.601 TRIG_00773509

Foreground time interval of the image:
-21.816  13.000 (delta_t =  34.816 [sec])
Background time interval of the image:
-239.224 -21.816 (delta_t = 217.408 [sec])
Light Curves
Note: The mask-weighted lightcurves have units of either count/det or counts/sec/det, where a det is 0.4 x 0.4 = 0.16 sq cm.
Full-time range; 1 s binning
Other quick-look light curves:
- 64 ms binning (zoomed)
- 16 ms binning (zoomed)
- 8 ms binning (zoomed)
- 2 ms binning (zoomed)
- SN=5 or 10 s binning (full-time range)
- Raw light curve
Spectra
- 64 ms binning (zoomed)
- 16 ms binning (zoomed)
- 8 ms binning (zoomed)
- 2 ms binning (zoomed)
- SN=5 or 10 s binning (full-time range)
- Raw light curve
Spectra
Notes:
- 1) The fitting includes the systematic errors.
- 2) When the burst includes telescope slew time periods, the fitting uses an average response file made from multiple 5-s response files through out the slew time plus single time preiod for the non-slew times, and weighted by the total counts in the corresponding time period using addrmf. An average response file is needed becuase a spectral fit using the pre-slew DRM will introduce some errors in both a spectral shape and a normalization if the PHA file contains a lot of the slew/post-slew time interval.
- 3) For fits to more complicated models (e.g. a power-law over a cutoff power-law), the BAT team has decided to require a chi-square improvement of more than 6 for each extra dof.
Time averaged spectrum fit using the average DRM
Power-law model
Time interval is from  -21.816 sec. to   13.000 sec.

Spectral model in power-law:
------------------------------------------------------------
Parameters  : value       lower 90%   higher 90%
Photon index: -1.75914     ( -0.175926   0.169665 )
Norm@50keV  : 2.07772E-03    ( -0.000244199   0.000240883 )
------------------------------------------------------------
#Fit statistic : Chi-Squared =          58.76 using 59 PHA bins.
# Reduced chi-squared =          1.031 for     57 degrees of freedom
# Null hypothesis probability =   4.107819e-01

Photon flux (15-150 keV)    in 34.82 sec: 0.281908 ( -0.028606  0.028614 ) ph/cm2/s
Energy fluence (15-150 keV)             : 6.67357e-07 ( -8.02611e-08  8.17417e-08 ) ergs/cm2
Cutoff power-law model
Time interval is from  -21.816 sec. to   13.000 sec.
Spectral model in the cutoff power-law:
------------------------------------------------------------
Parameters  : value       lower 90%   higher 90%
Photon index: -0.0665121     ( -0.926106   1.18272 )
Epeak [keV] : 48.5278      ( -6.70072 8.22668 )
Norm@50keV  : 1.88750E-02    ( -0.0188772   0.0706181 )
------------------------------------------------------------
#Fit statistic : Chi-Squared =          47.22 using 59 PHA bins.
# Reduced chi-squared =         0.8432 for     56 degrees of freedom
# Null hypothesis probability =   7.920156e-01

Photon flux (15-150 keV)    in 34.82 sec: 0.266217 ( -0.029455  0.029566 ) ph/cm2/s
Energy fluence (15-150 keV)             : 5.74857e-07 ( -8.09008e-08  8.89602e-08 ) ergs/cm2
1-s peak spectrum fit
Power-law model
Time interval is from    2.740 sec. to    3.740 sec.

Spectral model in power-law:
------------------------------------------------------------
Parameters  : value       lower 90%   higher 90%
Photon index: -1.65938     ( -0.453788   0.417728 )
Norm@50keV  : 5.98108E-03    ( -0.00160672   0.00150309 )
------------------------------------------------------------
#Fit statistic : Chi-Squared =          67.29 using 59 PHA bins.
# Reduced chi-squared =          1.181 for     57 degrees of freedom
# Null hypothesis probability =   1.653594e-01

Photon flux (15-150 keV)    in 1 sec: 0.783444 ( -0.172347  0.172354 ) ph/cm2/s
Energy fluence (15-150 keV)             : 5.55815e-08 ( -1.52829e-08  1.58106e-08 ) ergs/cm2
Cutoff power-law model
Time interval is from    2.740 sec. to    3.740 sec.
Spectral model in the cutoff power-law:
------------------------------------------------------------
Parameters  : value       lower 90%   higher 90%
Photon index: -2.24371     ( -0.767739   1.4725 )
Epeak [keV] : 90.6312      (   )
Norm@50keV  : 3.02449E-03    (     )
------------------------------------------------------------
#Fit statistic : Chi-Squared =          67.17 using 59 PHA bins.
# Reduced chi-squared =          1.200 for     56 degrees of freedom
# Null hypothesis probability =   1.457616e-01

Photon flux (15-150 keV)    in 1 sec: 0.621499 ( -0.26491  0.182075 ) ph/cm2/s
Energy fluence (15-150 keV)             : 3.88562e-08 ( -1.57792e-08  9.73974e-09 ) ergs/cm2
Time-resolved spectra
Distribution
T90 vs. Hardness ratio plot
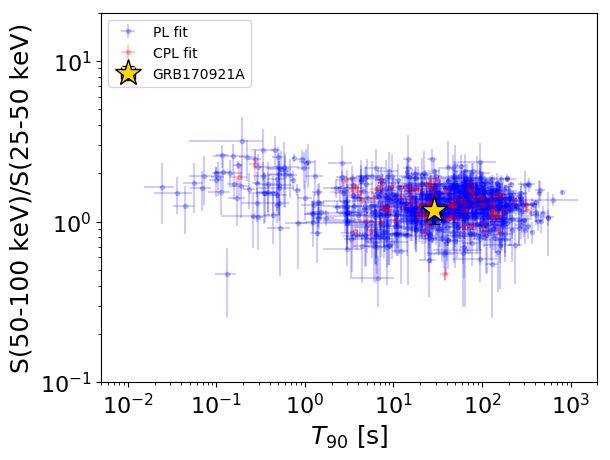
T90                                   = 28.8 sec.
Hardness ratio (energy fluence ratio) = 1.18184368685
S(15-50 keV) vs. S(50-150 keV) plot
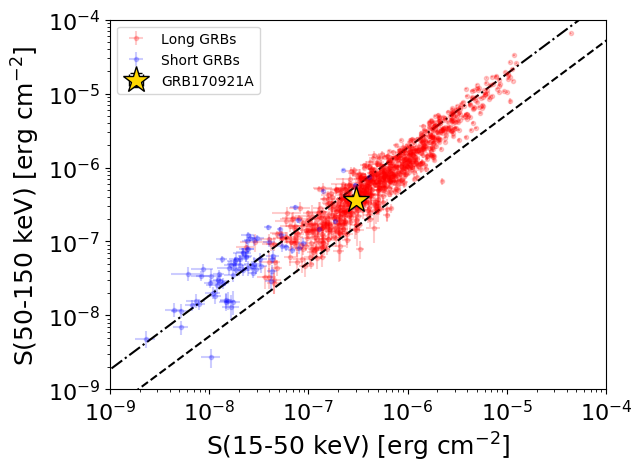
S(15-50 keV)  = 3.028617e-07
S(50-150 keV) = 3.645038e-07
The dash-dotted line and the dashed line traces the fluences calculated from the Band function with Epeak = 15 and 150 keV, respectively. Both lines assume a canonical values of alpha = -1 and beta = -2.5.
Mask shadow pattern
IMX = 1.538833695729371E-02, IMY = -2.490014657164326E-01
Spacecraft aspect plot
Bright source in the pre-burst/pre-slew/post-slew images
Pre-burst image of 15-350 keV band
Time interval of the image:
-239.224000 -21.816000

# RAcent  DECcent POSerr Theta    Phi  PeakCts   SNR AngSep     Name
#  [deg]    [deg]    ['] [deg]  [deg]                   [']
 83.6175  21.9941    0.6  44.8  -24.2   8.3999  20.6    1.5	Crab
325.9375  38.4099    0.0  51.5  163.7   3.1532   3.4   12.2	Cyg X-2
 64.6359  -3.8586    2.5  53.7   16.7   4.6732   4.6 ------	UNKNOWN
 72.6056  -1.4005    2.5  55.4    6.7   5.0672   4.7 ------	UNKNOWN
Pre-slew background subtracted image of 15-350 keV band
Time interval of the image:
-21.816000 13.000000

# RAcent  DECcent POSerr Theta    Phi  PeakCts   SNR AngSep     Name
#  [deg]    [deg]    ['] [deg]  [deg]                   [']
 83.6491  22.1945    6.0  44.7  -24.4   0.2748   1.9   10.8	Crab
326.1750  38.3138  134.5  51.4  163.5   0.0276   0.1    0.5	Cyg X-2
 46.0415   6.5880    2.6  37.6   36.5   0.5916   4.5 ------	UNKNOWN
 26.8407  30.8796    0.9  14.0   86.5   1.0983  12.6 ------	UNKNOWN
 92.1097  12.5773    2.2  57.1  -22.0   1.9253   5.2 ------	UNKNOWN
Post-slew image of 15-350 keV band
Time interval of the image:
81.076600 962.796400

# RAcent  DECcent POSerr Theta    Phi  PeakCts   SNR AngSep     Name
#  [deg]    [deg]    ['] [deg]  [deg]                   [']
326.3497  38.1678    0.0  49.5  160.6  -3.0032  -1.4   12.5	Cyg X-2
321.2868  37.4888    3.7  53.6  160.8  11.4237   3.2 ------	UNKNOWN