Analysis Summary
Notes:
- 1) No attempt has been made to eliminate the non-significant decimal places.
- 2) This batgrbproduct analysis is done using the HEASARC data.
- 3) This batgrbproduct analysis is using the flight position for the mask-weighting calculation.
======================================================================
BAT GRB EVENT DATA PROCESSING REPORT
Process Script Ver: batgrbproduct v2.46
Process Start Time: Fri Oct 20 14:27:44 EDT 2017
Host Name: bat1
Current Working Dir: /local/data/bat1/alien/Swift_3rdBATcatalog/event/batevent_reproc/trigger776347
======================================================================
Trigger: 00776347 Segment: 000
BAT Trigger Time: 528796552 [s; MET]
Trigger Stop: 528796640 [s; MET]
UTC: 2017-10-04T07:55:32.213440 [includes UTCF correction]
Where From?: TDRSS position message
BAT
RA: 139.161615042698 Dec: 52.6799760162536 [deg; J2000]
Catalogged Source?: NO
Point Source?: YES
GRB Indicated?: YES [ by BAT flight software ]
Image S/N Ratio: 15.15
Image Trigger?: YES
Rate S/N Ratio: 0 [ if not an image trigger ]
Image S/N Ratio: 15.15
Analysis Position: [ source = BAT ]
RA: 139.161615042698 Dec: 52.6799760162536 [deg; J2000]
Refined Position: [ source = BAT pre-slew burst ]
RA: 139.146324049161 Dec: 52.6850512156684 [deg; J2000]
{ 09h 16m 35.1s , +52d 41' 06.2" }
+/- 1.27284867325174 [arcmin] (estimated 90% radius based on SNR)
+/- 0.391004819460118 [arcmin] (formal 1-sigma fit error)
SNR: 21.5495037724106
Angular difference between the analysis and refined position is 0.634096 arcmin
Partial Coding Fraction: 0.421875 [ including projection effects ]
Duration
T90: 105.539999961853 +/- 14.3064433213744
Measured from: 15.3439999818802
to: 120.883999943733 [s; relative to TRIGTIME]
T50: 44.8079999685287 +/- 7.64174015467547
Measured from: 31.0199999809265
to: 75.8279999494553 [s; relative to TRIGTIME]
Fluence
Peak Flux (peak 1 second)
Measured from: 48.339999973774
to: 49.339999973774 [s; relative to TRIGTIME]
Total Fluence
Measured from: 10.5879999995232
to: 136.976000010967 [s; relative to TRIGTIME]
Band 1 Band 2 Band 3 Band 4
15-25 25-50 50-100 100-350 keV
Total 1.419394 1.634962 1.247011 0.342993
0.100499 0.105177 0.092404 0.081000 [error]
Peak 0.041803 0.038029 0.020514 0.006670
0.009940 0.009933 0.008353 0.007582 [error]
[ fluence units of on-axis counts / fully illuminated detector ]
======================================================================
====== Table of the duration information =============================
Value tstart tstop
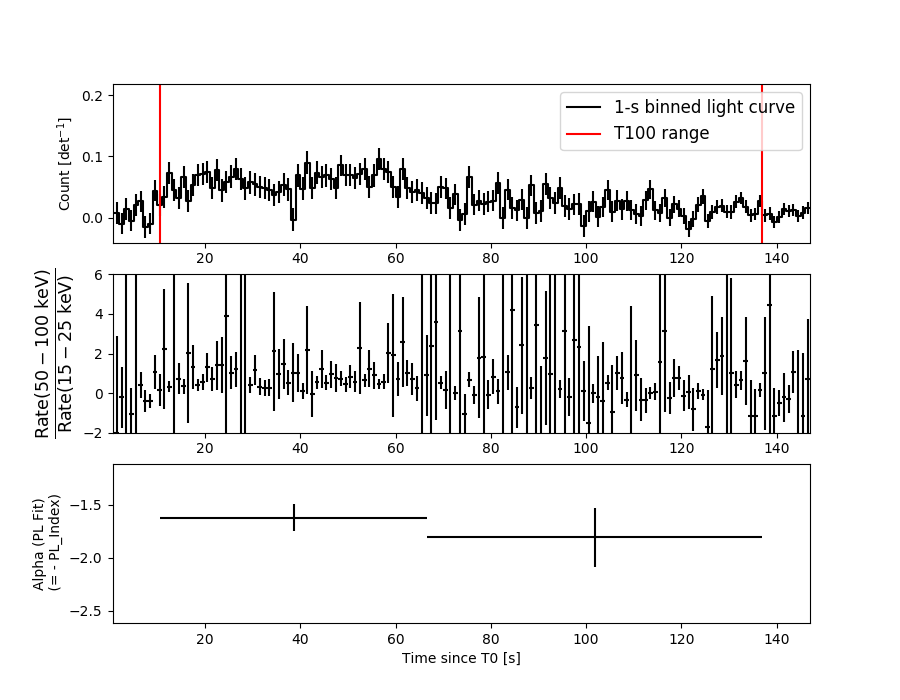
T100 126.388 10.588 136.976
T90 105.540 15.344 120.884
T50 44.808 31.020 75.828
Peak 1.000 48.340 49.340
====== Spectral Analysis Summary =====================================
Model : spectral model: simple power-law (PL) and cutoff power-law (CPL)
Ph_index : photon index: E^{Ph_index}
Ph_90err : 90% error of the photon index
Epeak : Epeak in keV
Epeak_90err: 90% error of Epeak
Norm : normalization at 50 keV in both the PL model and CPL model
Nomr_90err : 90% error of the normalization
chi2 : Chi-Squared
dof : degree of freedo
=== Time-averaged spectral analysis ===
(Best model with acceptable fit: PL)
Model Ph_index Ph_90err_low Ph_90err_hi Epeak Epeak_90err_low Epeak_90err_hi Norm Nomr_90err_low Norm_90err_hi chi2 dof
PL -1.674 -0.127 0.125 - - - 2.49e-03 -1.76e-04 1.75e-04 54.000 57
CPL -1.655 -0.896 0.381 874.367 -874.356 -874.367 2.55e-03 -2.30e-04 1.15e-04 54.050 56
=== 1-s peak spectral analysis ===
(Best model with acceptable fit: PL)
Model Ph_index Ph_90err_low Ph_90err_hi Epeak Epeak_90err_low Epeak_90err_hi Norm Nomr_90err_low Norm_90err_hi chi2 dof
PL -1.879 -0.612 0.545 - - - 6.49e-03 -2.24e-03 2.04e-03 51.050 57
CPL -1.899 -0.870 1.178 9999.360 N/A N/A 6.45e-03 N/A N/A 51.050 56
=== Fluence/Peak Flux Summary ===
Model Band1 Band2 Band3 Band4 Band5 Total
15-25 25-50 50-100 100-350 15-150 15-350 keV
Fluence PL 4.73e-07 7.82e-07 9.80e-07 2.44e-06 2.92e-06 4.68e-06 erg/cm2
90%_error_low -5.52e-08 -5.55e-08 -9.21e-08 -4.61e-07 -2.16e-07 -5.38e-07 erg/cm2
90%_error_hi 5.73e-08 5.53e-08 9.15e-08 5.28e-07 2.17e-07 5.89e-07 erg/cm2
Peak flux PL 3.85e-01 3.10e-01 1.69e-01 1.34e-01 9.24e-01 9.97e-01 ph/cm2/s
90%_error_low -1.67e-01 -8.80e-02 -7.40e-02 -8.85e-02 -2.63e-01 -2.78e-01 ph/cm2/s
90%_error_hi 1.83e-01 8.70e-02 7.21e-02 1.53e-01 2.63e-01 2.78e-01 ph/cm2/s
Fluence CPL 4.73e-07 7.76e-07 9.75e-07 2.65e-06 2.93e-06 4.70e-06 erg/cm2
90%_error_low N/A N/A -1.14e-07 -1.30e-06 -2.85e-07 -1.12e-06 erg/cm2
90%_error_hi N/A N/A 1.24e-07 -1.24e-07 2.56e-07 2.72e-07 erg/cm2
Peak flux CPL 3.68e-01 2.42e-01 1.07e-01 7.80e-02 7.50e-01 7.97e-01 ph/cm2/s
90%_error_low N/A -1.35e-01 -1.07e-01 -7.80e-02 N/A N/A ph/cm2/s
90%_error_hi N/A 1.49e-01 2.23e-01 8.89e-02 N/A N/A ph/cm2/s
======================================================================
Image
Pre-slew 15.0-350.0 keV image (Event data)
#   RAcent    DECcent   POSerr    Theta     Phi              Peak Cts       SNR   Name
  139.1463    52.6851   0.0089    44.6436    -6.0914         4.4875660     21.550 TRIG_00776347

Foreground time interval of the image:
 10.588  96.301 (delta_t =  85.713 [sec])
Background time interval of the image:
-651.699 -634.660 (delta_t =  17.040 [sec])
-239.000  10.588 (delta_t = 249.588 [sec])
Light Curves
Note: The mask-weighted lightcurves have units of either count/det or counts/sec/det, where a det is 0.4 x 0.4 = 0.16 sq cm.
Full-time range; 1 s binning
Other quick-look light curves:
- 64 ms binning (zoomed)
- 16 ms binning (zoomed)
- 8 ms binning (zoomed)
- 2 ms binning (zoomed)
- SN=5 or 10 s binning (full-time range)
- Raw light curve
Spectra
- 64 ms binning (zoomed)
- 16 ms binning (zoomed)
- 8 ms binning (zoomed)
- 2 ms binning (zoomed)
- SN=5 or 10 s binning (full-time range)
- Raw light curve
Spectra
Notes:
- 1) The fitting includes the systematic errors.
- 2) When the burst includes telescope slew time periods, the fitting uses an average response file made from multiple 5-s response files through out the slew time plus single time preiod for the non-slew times, and weighted by the total counts in the corresponding time period using addrmf. An average response file is needed becuase a spectral fit using the pre-slew DRM will introduce some errors in both a spectral shape and a normalization if the PHA file contains a lot of the slew/post-slew time interval.
- 3) For fits to more complicated models (e.g. a power-law over a cutoff power-law), the BAT team has decided to require a chi-square improvement of more than 6 for each extra dof.
Time averaged spectrum fit using the average DRM
Power-law model
Time interval is from   10.588 sec. to  136.976 sec.

Spectral model in power-law:
------------------------------------------------------------
Parameters  : value       lower 90%   higher 90%
Photon index: -1.67435     ( -0.1265   0.12484 )
Norm@50keV  : 2.48858E-03    ( -0.00017563   0.000174595 )
------------------------------------------------------------
#Fit statistic : Chi-Squared =          54.00 using 59 PHA bins.
# Reduced chi-squared =         0.9473 for     57 degrees of freedom
# Null hypothesis probability =   5.885010e-01

Photon flux (15-150 keV)    in 126.4 sec: 0.327618 ( -0.023278  0.023362 ) ph/cm2/s
Energy fluence (15-150 keV)             : 2.91916e-06 ( -2.16214e-07  2.17428e-07 ) ergs/cm2
Cutoff power-law model

Time interval is from   10.588 sec. to  136.976 sec.
Spectral model in the cutoff power-law:
------------------------------------------------------------
Parameters  : value       lower 90%   higher 90%
Photon index: -1.67273     ( -0.895285   0.381322 )
Epeak [keV] : 1.00000E+04      ( -9999.99 -10000 )
Norm@50keV  : 2.49347E-03    ( -0.000176551   0.000168206 )
------------------------------------------------------------
#Fit statistic : Chi-Squared =          54.00 using 59 PHA bins.
# Reduced chi-squared =         0.9643 for     56 degrees of freedom
# Null hypothesis probability =   5.509492e-01

Photon flux (15-150 keV)    in 126.4 sec: 0.329116 ( -0.031209  0.027836 ) ph/cm2/s
Energy fluence (15-150 keV)             : 2.9331e-06 ( -2.85287e-07  2.55773e-07 ) ergs/cm2
1-s peak spectrum fit
Power-law model

Time interval is from   48.340 sec. to   49.340 sec.

Spectral model in power-law:
------------------------------------------------------------
Parameters  : value       lower 90%   higher 90%
Photon index: -1.87893     ( -0.611689   0.544812 )
Norm@50keV  : 6.49293E-03    ( -0.00223906   0.00204274 )
------------------------------------------------------------
#Fit statistic : Chi-Squared =          51.05 using 59 PHA bins.
# Reduced chi-squared =         0.8956 for     57 degrees of freedom
# Null hypothesis probability =   6.967361e-01

Photon flux (15-150 keV)    in 1 sec: 0.923638 ( -0.262607  0.263412 ) ph/cm2/s
Energy fluence (15-150 keV)             : 5.9698e-08 ( -1.90705e-08  1.95266e-08 ) ergs/cm2
Cutoff power-law model
Time interval is from   48.340 sec. to   49.340 sec.
Spectral model in the cutoff power-law:
------------------------------------------------------------
Parameters  : value       lower 90%   higher 90%
Photon index: -2.56675     ( -0.202254   1.84623 )
Epeak [keV] : 198.187      (   )
Norm@50keV  : 2.96312E-03    (     )
------------------------------------------------------------
#Fit statistic : Chi-Squared =          50.71 using 59 PHA bins.
# Reduced chi-squared =         0.9056 for     56 degrees of freedom
# Null hypothesis probability =   6.745867e-01

Photon flux (15-150 keV)    in 1 sec: 0.749869 (    ) ph/cm2/s
Energy fluence (15-150 keV)             : 5.46701e-08 ( -2.9954e-08  1.9507e-08 ) ergs/cm2
Time-resolved spectra
Distribution
T90 vs. Hardness ratio plot
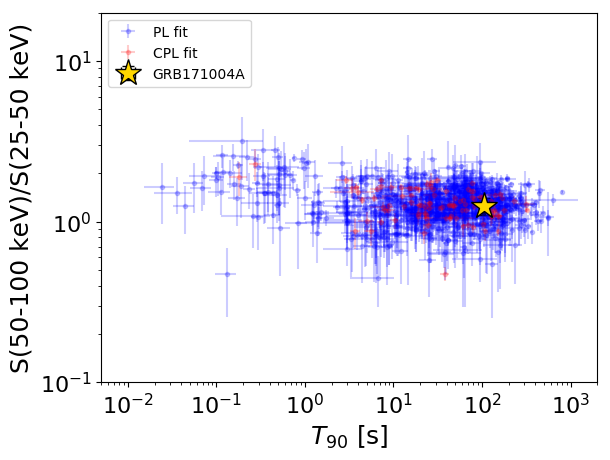
T90                                   = 105.54 sec.
Hardness ratio (energy fluence ratio) = 1.25325661995
S(15-50 keV) vs. S(50-150 keV) plot
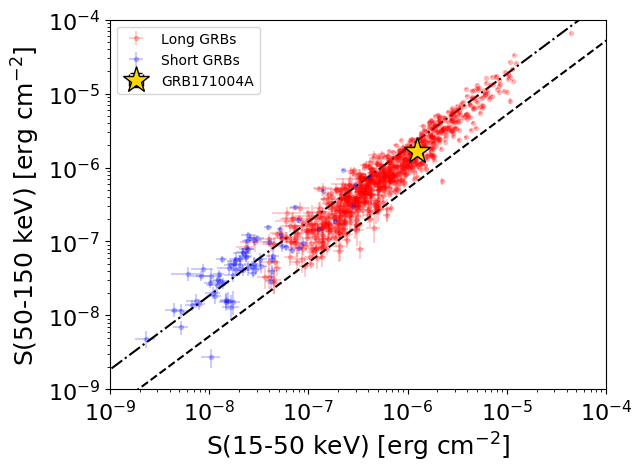
S(15-50 keV)  = 1.2549434e-06
S(50-150 keV) = 1.6641877e-06
The dash-dotted line and the dashed line traces the fluences calculated from the Band function with Epeak = 15 and 150 keV, respectively. Both lines assume a canonical values of alpha = -1 and beta = -2.5.
Mask shadow pattern
IMX = 9.820587002473435E-01, IMY = 1.048028123701253E-01
Spacecraft aspect plot
Bright source in the pre-burst/pre-slew/post-slew images
Pre-burst image of 15-350 keV band
Time interval of the image:
-651.699390 -634.659800
-239.000000 10.588000

# RAcent  DECcent POSerr Theta    Phi  PeakCts   SNR AngSep     Name
#  [deg]    [deg]    ['] [deg]  [deg]                   [']
254.6711  35.2666    0.0  31.4  164.9  -0.0863  -0.3   11.4	Her X-1
282.4138  46.6084    2.6  39.8  126.2   2.6233   4.5 ------	UNKNOWN
270.7280  77.6797    2.2  29.3   72.0   1.8109   5.1 ------	UNKNOWN
137.9266  32.5429    2.9  58.9  -24.4   5.8121   4.0 ------	UNKNOWN
185.8189  21.2712    3.2  41.4  -78.2   3.3275   3.6 ------	UNKNOWN
213.7333   9.3484    2.3  45.3 -121.2   4.2525   4.9 ------	UNKNOWN
Pre-slew background subtracted image of 15-350 keV band
Time interval of the image:
10.588000 96.300600

# RAcent  DECcent POSerr Theta    Phi  PeakCts   SNR AngSep     Name
#  [deg]    [deg]    ['] [deg]  [deg]                   [']
254.5364  35.2919   10.6  31.3  165.0   0.1582   1.1    4.9	Her X-1
269.7883  16.7007    2.2  54.3  165.4   2.6422   5.2 ------	UNKNOWN
139.1463  52.6851    0.5  44.6   -6.1   4.4882  21.6 ------	UNKNOWN
201.7734  30.8226    2.5  26.6  -94.1   0.7043   4.6 ------	UNKNOWN
Post-slew image of 15-350 keV band
Time interval of the image:
163.700600 237.300580

# RAcent  DECcent POSerr Theta    Phi  PeakCts   SNR AngSep     Name
#  [deg]    [deg]    ['] [deg]  [deg]                   [']
211.9394  73.6878    3.2  35.6  172.7   0.4360   3.6 ------	UNKNOWN
226.8292  41.7959    2.3  56.8 -151.9   2.5902   4.9 ------	UNKNOWN