Analysis Summary
Notes:
- 1) No attempt has been made to eliminate the non-significant decimal places.
- 2) This batgrbproduct analysis is done using the HEASARC data.
- 3) This batgrbproduct analysis is using the flight position for the mask-weighting calculation.
======================================================================
BAT GRB EVENT DATA PROCESSING REPORT
Process Script Ver: batgrbproduct v2.46
Process Start Time: Thu Oct 19 18:44:10 EDT 2017
Host Name: bat1
Current Working Dir: /local/data/bat1/alien/Swift_3rdBATcatalog/event/batevent_reproc/trigger777215
======================================================================
Trigger: 00777215 Segment: 000
BAT Trigger Time: 529070278.08 [s; MET]
Trigger Stop: 529070280.128 [s; MET]
UTC: 2017-10-07T11:57:38.277120 [includes UTCF correction]
Where From?: TDRSS position message
BAT
RA: 135.543621795884 Dec: 42.8493348720254 [deg; J2000]
Catalogged Source?: NO
Point Source?: YES
GRB Indicated?: YES [ by BAT flight software ]
Image S/N Ratio: 8.18
Image Trigger?: NO
Rate S/N Ratio: 13.6747943311773 [ if not an image trigger ]
Image S/N Ratio: 8.18
Analysis Position: [ source = BAT ]
RA: 135.543621795884 Dec: 42.8493348720254 [deg; J2000]
Refined Position: [ source = BAT pre-slew burst ]
RA: 135.544 Dec: 42.8493 [deg; J2000]
{ 09h 02m 10.6s , +42d 50' 57.5" }
+/- 2.32874993422 [arcmin] (estimated 90% radius based on SNR)
SNR: 9.09314204559
Angular difference between the analysis and refined position is 0.016768 arcmin
Partial Coding Fraction: 1.03125 [ including projection effects ]
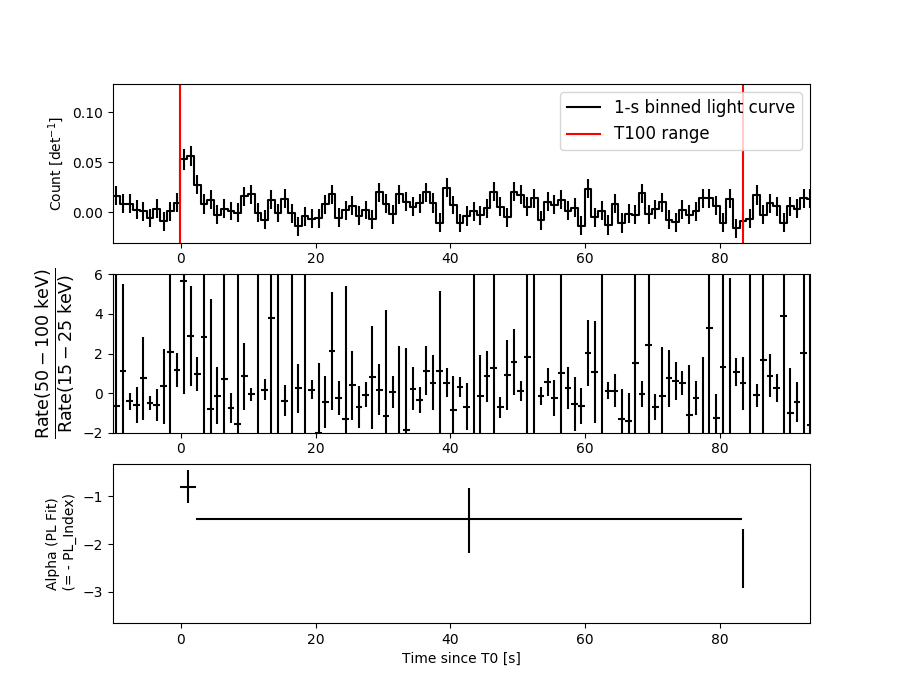
Duration
T90: 68.4239999651909 +/- 19.3288518403932
Measured from: 0.480000019073486
to: 68.9039999842644 [s; relative to TRIGTIME]
T50: 46.1679999232292 +/- 28.6269932006757
Measured from: 1.95200002193451
to: 48.1199999451637 [s; relative to TRIGTIME]
Fluence
Peak Flux (peak 1 second)
Measured from: 0.452000021934509
to: 1.45200002193451 [s; relative to TRIGTIME]
Total Fluence
Measured from: -0.155999958515167
to: 83.3479999899864 [s; relative to TRIGTIME]
Band 1 Band 2 Band 3 Band 4
15-25 25-50 50-100 100-350 keV
Total 0.101361 0.197096 0.100734 0.028823
0.045752 0.047675 0.042276 0.038092 [error]
Peak 0.011085 0.026117 0.026586 0.011561
0.005169 0.005470 0.005128 0.004523 [error]
[ fluence units of on-axis counts / fully illuminated detector ]
======================================================================
====== Table of the duration information =============================
Value tstart tstop
T100 83.504 -0.156 83.348
T90 68.424 0.480 68.904
T50 46.168 1.952 48.120
Peak 1.000 0.452 1.452
====== Spectral Analysis Summary =====================================
Model : spectral model: simple power-law (PL) and cutoff power-law (CPL)
Ph_index : photon index: E^{Ph_index}
Ph_90err : 90% error of the photon index
Epeak : Epeak in keV
Epeak_90err: 90% error of Epeak
Norm : normalization at 50 keV in both the PL model and CPL model
Nomr_90err : 90% error of the normalization
chi2 : Chi-Squared
dof : degree of freedo
=== Time-averaged spectral analysis ===
(Best model with acceptable fit: N/A)
Model Ph_index Ph_90err_low Ph_90err_hi Epeak Epeak_90err_low Epeak_90err_hi Norm Nomr_90err_low Norm_90err_hi chi2 dof
PL -1.351 -0.481 0.486 - - - 3.24e-04 -1.06e-04 1.05e-04 79.250 57
CPL 1.672 -2.052 -1.672 56.473 -14.314 27.756 1.19e-02 -1.19e-02 2.19e+02 73.720 56
=== 1-s peak spectral analysis ===
(Best model with acceptable fit: PL)
Model Ph_index Ph_90err_low Ph_90err_hi Epeak Epeak_90err_low Epeak_90err_hi Norm Nomr_90err_low Norm_90err_hi chi2 dof
PL -0.927 -0.368 0.397 - - - 4.79e-03 -1.05e-03 1.04e-03 65.790 57
CPL -0.291 -0.967 2.260 148.928 -148.928 -148.928 9.39e-03 -5.48e-03 7.69e-02 65.320 56
=== Fluence/Peak Flux Summary ===
Model Band1 Band2 Band3 Band4 Band5 Total
15-25 25-50 50-100 100-350 15-150 15-350 keV
Fluence PL 3.00e-08 6.05e-08 9.50e-08 3.30e-07 2.64e-07 5.15e-07 erg/cm2
90%_error_low -1.38e-08 -2.02e-08 -3.69e-08 -1.98e-07 -9.27e-08 -2.41e-07 erg/cm2
90%_error_hi 1.56e-08 2.01e-08 3.77e-08 3.36e-07 9.66e-08 3.57e-07 erg/cm2
Peak flux PL 1.14e-01 1.62e-01 1.70e-01 3.31e-01 5.50e-01 7.77e-01 ph/cm2/s
90%_error_low -4.70e-02 -4.48e-02 -3.96e-02 -1.40e-01 -1.20e-01 -1.82e-01 ph/cm2/s
90%_error_hi 5.48e-02 4.35e-02 3.91e-02 2.00e-01 1.20e-01 2.01e-01 ph/cm2/s
Fluence CPL 1.57e-08 8.65e-08 9.38e-08 8.91e-09 2.05e-07 2.05e-07 erg/cm2
90%_error_low -1.38e-08 -2.96e-08 -5.01e-08 N/A -7.23e-08 -7.27e-08 erg/cm2
90%_error_hi 1.92e-08 3.12e-08 5.26e-08 N/A 9.36e-08 1.17e-07 erg/cm2
Peak flux CPL 9.80e-02 1.68e-01 1.82e-01 1.74e-01 5.36e-01 6.23e-01 ph/cm2/s
90%_error_low -5.83e-02 -4.90e-02 -4.70e-02 -1.74e-01 -1.27e-01 -1.97e-01 ph/cm2/s
90%_error_hi 6.58e-02 5.12e-02 5.03e-02 2.08e-01 1.26e-01 2.53e-01 ph/cm2/s
======================================================================
Image
Light Curves
Note: The mask-weighted lightcurves have units of either count/det or counts/sec/det, where a det is 0.4 x 0.4 = 0.16 sq cm.
Full-time range; 1 s binning
Other quick-look light curves:
- 64 ms binning (zoomed)
- 16 ms binning (zoomed)
- 8 ms binning (zoomed)
- 2 ms binning (zoomed)
- SN=5 or 10 s binning (full-time range)
- Raw light curve
Spectra
- 64 ms binning (zoomed)
- 16 ms binning (zoomed)
- 8 ms binning (zoomed)
- 2 ms binning (zoomed)
- SN=5 or 10 s binning (full-time range)
- Raw light curve
Spectra
Notes:
- 1) The fitting includes the systematic errors.
- 2) When the burst includes telescope slew time periods, the fitting uses an average response file made from multiple 5-s response files through out the slew time plus single time preiod for the non-slew times, and weighted by the total counts in the corresponding time period using addrmf. An average response file is needed becuase a spectral fit using the pre-slew DRM will introduce some errors in both a spectral shape and a normalization if the PHA file contains a lot of the slew/post-slew time interval.
- 3) For fits to more complicated models (e.g. a power-law over a cutoff power-law), the BAT team has decided to require a chi-square improvement of more than 6 for each extra dof.
Time averaged spectrum fit using the average DRM
Power-law model
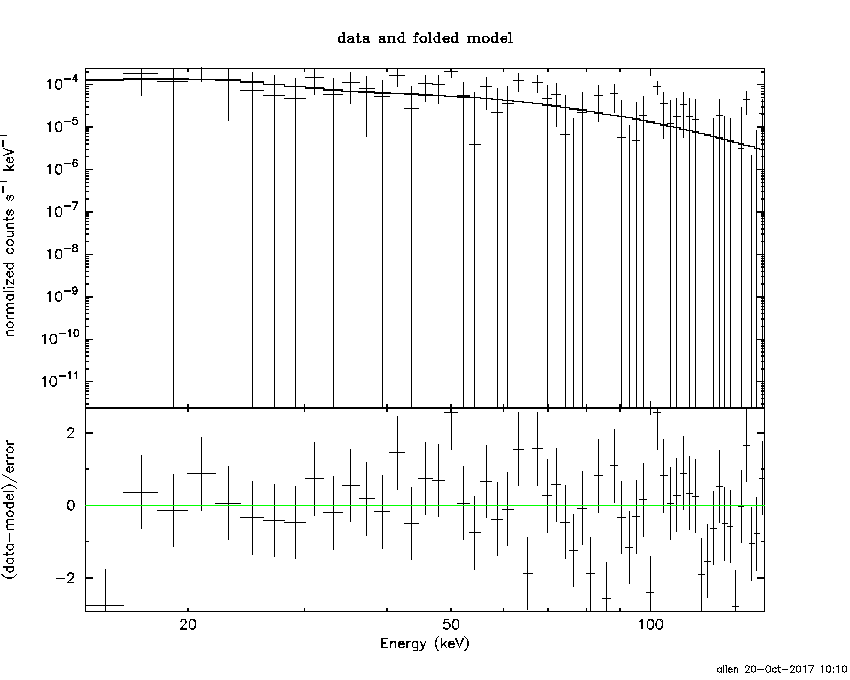
Time interval is from   -0.156 sec. to   83.348 sec.

Spectral model in power-law:
------------------------------------------------------------
Parameters  : value       lower 90%   higher 90%
Photon index: -1.35148     ( -0.485282   0.481681 )
Norm@50keV  : 3.24044E-04    ( -0.000105834   0.000105353 )
------------------------------------------------------------
#Fit statistic : Chi-Squared =          79.25 using 59 PHA bins.
# Reduced chi-squared =          1.390 for     57 degrees of freedom
# Null hypothesis probability =   2.731207e-02

Photon flux (15-150 keV)    in 83.5 sec: 3.90401E-02 ( -0.0125265  0.0126071 ) ph/cm2/s
Energy fluence (15-150 keV)             : 2.64476e-07 ( -9.27184e-08  9.66396e-08 ) ergs/cm2
Cutoff power-law model
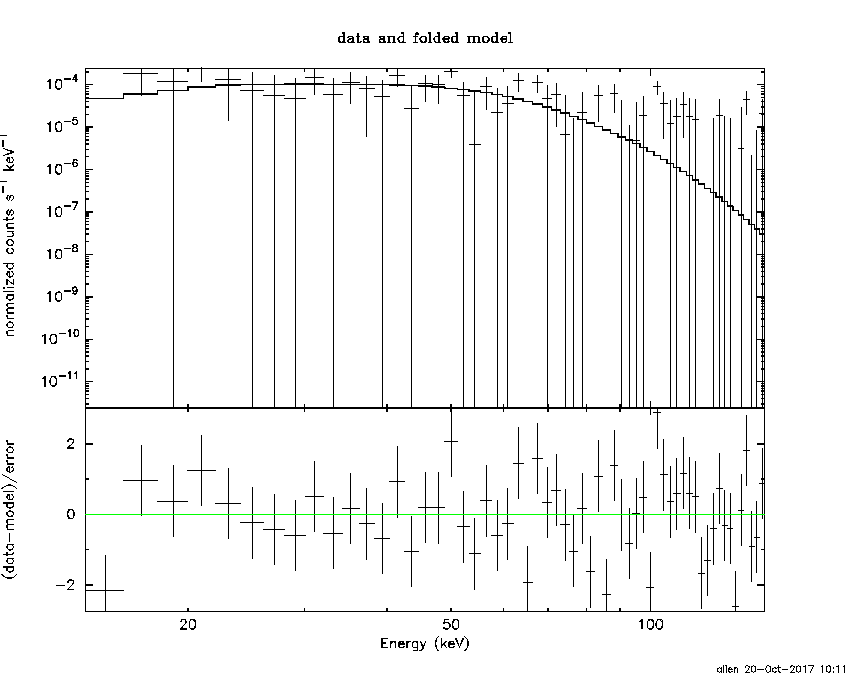
Time interval is from   -0.156 sec. to   83.348 sec.
Spectral model in the cutoff power-law:
------------------------------------------------------------
Parameters  : value       lower 90%   higher 90%
Photon index: 3.25996     ( -3.89855   -3.51879 )
Epeak [keV] : 52.7195      ( -10.2908 31.7793 )
Norm@50keV  : 8.02692E-02    ( -0.0772621   219.17 )
------------------------------------------------------------
#Fit statistic : Chi-Squared =          73.27 using 59 PHA bins.
# Reduced chi-squared =          1.308 for     56 degrees of freedom
# Null hypothesis probability =   6.053977e-02

Photon flux (15-150 keV)    in 83.5 sec: 3.45320E-02 ( -0.0125957  0.0128289 ) ph/cm2/s
Energy fluence (15-150 keV)             : 2.04558e-07 ( -7.23111e-08  9.36478e-08 ) ergs/cm2
1-s peak spectrum fit
Power-law model
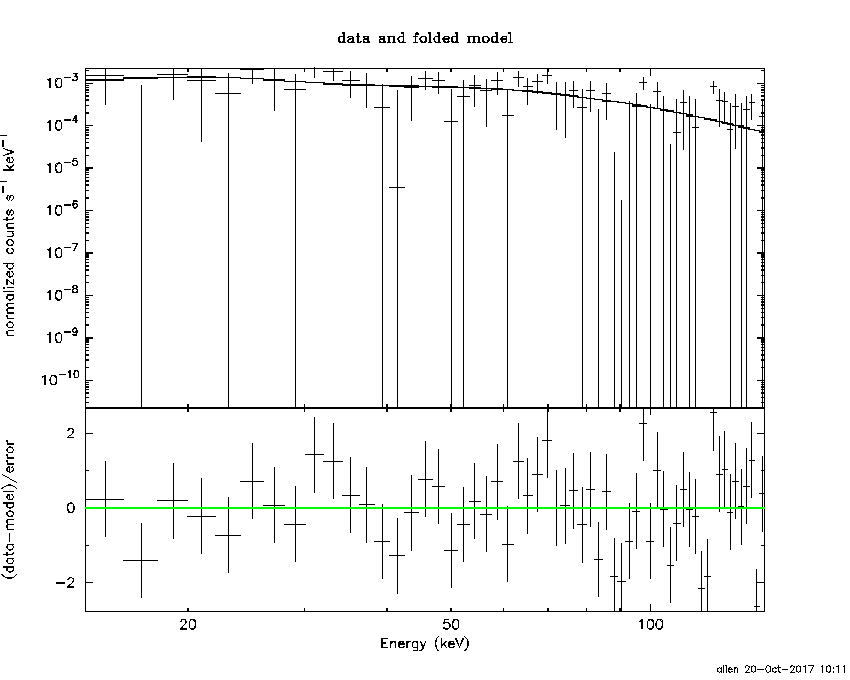
Time interval is from    0.452 sec. to    1.452 sec.

Spectral model in power-law:
------------------------------------------------------------
Parameters  : value       lower 90%   higher 90%
Photon index: -0.926946     ( -0.367905   0.397051 )
Norm@50keV  : 4.79374E-03    ( -0.00104575   0.001037 )
------------------------------------------------------------
#Fit statistic : Chi-Squared =          65.79 using 59 PHA bins.
# Reduced chi-squared =          1.154 for     57 degrees of freedom
# Null hypothesis probability =   1.987962e-01

Photon flux (15-150 keV)    in 1 sec: 0.550424 ( -0.11999  0.120498 ) ph/cm2/s
Energy fluence (15-150 keV)             : 5.32513e-08 ( -1.24062e-08  1.25948e-08 ) ergs/cm2
Cutoff power-law model
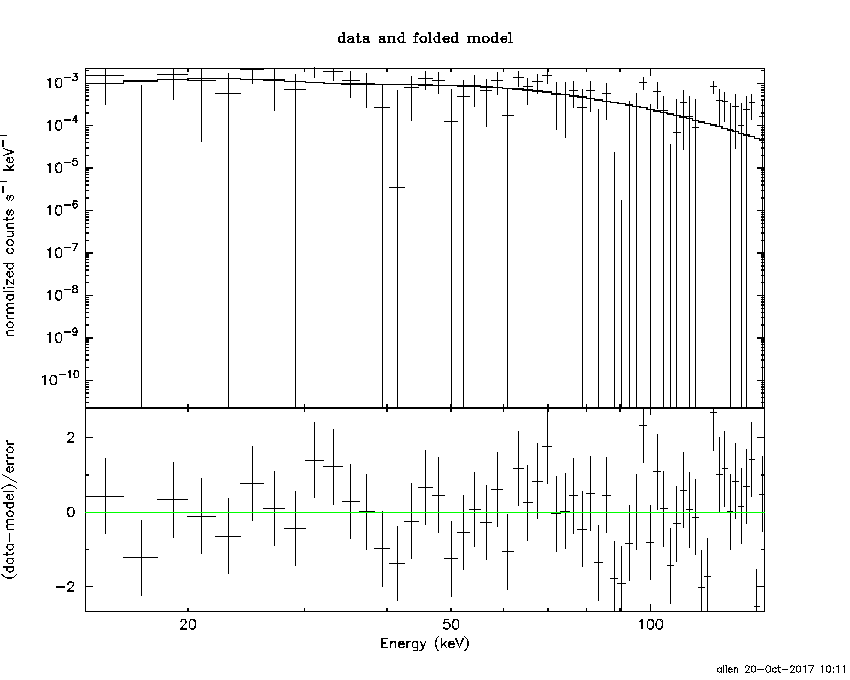
Time interval is from    0.452 sec. to    1.452 sec.
Spectral model in the cutoff power-law:
------------------------------------------------------------
Parameters  : value       lower 90%   higher 90%
Photon index: -0.290651     ( -0.966731   2.26028 )
Epeak [keV] : 148.928      ( -148.954 -148.954 )
Norm@50keV  : 9.38672E-03    ( -0.00547917   0.0769161 )
------------------------------------------------------------
#Fit statistic : Chi-Squared =          65.32 using 59 PHA bins.
# Reduced chi-squared =          1.166 for     56 degrees of freedom
# Null hypothesis probability =   1.845628e-01

Photon flux (15-150 keV)    in 1 sec: 0.535788 ( -0.127259  0.125835 ) ph/cm2/s
Energy fluence (15-150 keV)             : 5.09988e-08 ( -1.40806e-08  1.37706e-08 ) ergs/cm2
Time-resolved spectra
Distribution
T90 vs. Hardness ratio plot
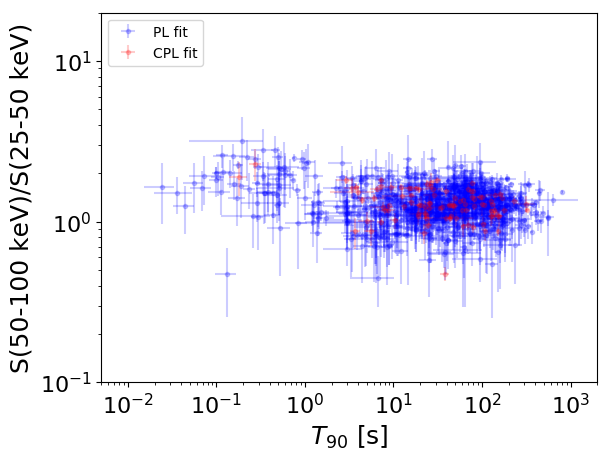
T90                                   = N/A sec.
Hardness ratio (energy fluence ratio) = N/A
S(15-50 keV) vs. S(50-150 keV) plot
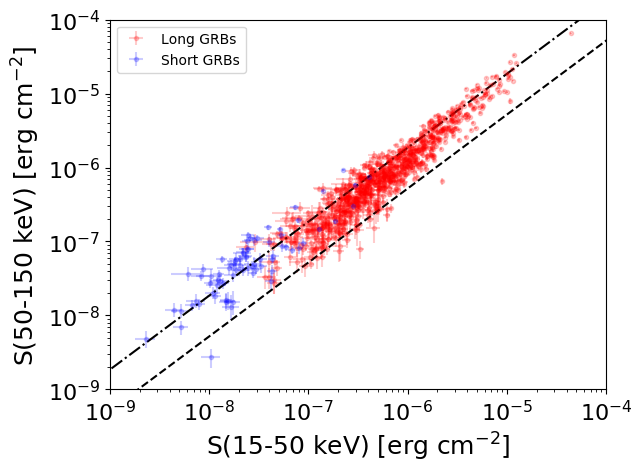
S(15-50 keV)  = N/A
S(50-150 keV) = N/A
The dash-dotted line and the dashed line traces the fluences calculated from the Band function with Epeak = 15 and 150 keV, respectively. Both lines assume a canonical values of alpha = -1 and beta = -2.5.
Mask shadow pattern
IMX = 1.756683852061149E-01, IMY = 2.862029514155098E-02
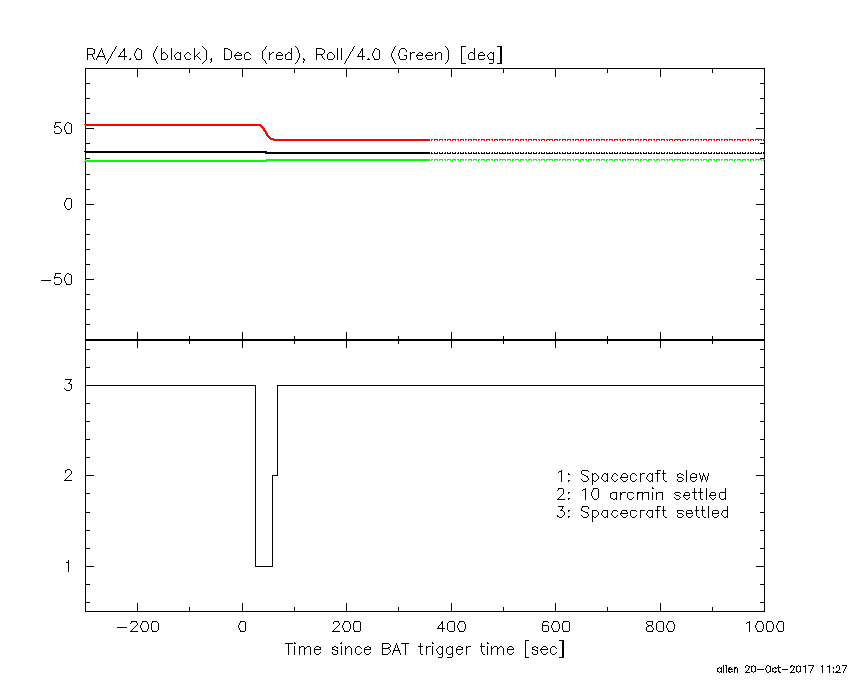
Spacecraft aspect plot
Bright source in the pre-burst/pre-slew/post-slew images
Pre-burst image of 15-350 keV band
Time interval of the image:
-239.080000 -0.156000

# RAcent  DECcent POSerr Theta    Phi  PeakCts   SNR AngSep     Name
#  [deg]    [deg]    ['] [deg]  [deg]                   [']
 99.6957  28.7271    2.4  37.6   41.9   1.6797   4.7 ------	UNKNOWN
110.9178   1.9867    3.1  55.9   10.7   4.0334   3.7 ------	UNKNOWN
278.6078  66.5603    2.5  56.8  173.9   5.2825   4.6 ------	UNKNOWN
125.2458  48.7833    2.4   9.6   47.1   0.8648   4.8 ------	UNKNOWN
222.4781  53.5155    2.5  47.0 -150.3   2.1715   4.7 ------	UNKNOWN
150.9208   3.1208    3.0  50.6  -39.4   3.3309   3.9 ------	UNKNOWN
Pre-slew background subtracted image of 15-350 keV band
Time interval of the image:
-0.156000 26.420600

# RAcent  DECcent POSerr Theta    Phi  PeakCts   SNR AngSep     Name
#  [deg]    [deg]    ['] [deg]  [deg]                   [']
Post-slew image of 15-350 keV band
Time interval of the image:
57.820610 963.038900
1833.920000 2000.000000

# RAcent  DECcent POSerr Theta    Phi  PeakCts   SNR AngSep     Name
#  [deg]    [deg]    ['] [deg]  [deg]                   [']
110.6163   9.4892    3.1  39.8   13.4   3.3594   3.7 ------	UNKNOWN
117.7987  17.0442    3.2  29.9    8.7   2.2865   3.7 ------	UNKNOWN
210.5680  64.2392    2.6  46.0 -171.4   5.6770   4.3 ------	UNKNOWN
187.2502  29.5535    2.9  43.1 -116.7  10.5512   3.9 ------	UNKNOWN
152.4612  -3.0090    2.5  48.3  -50.0  14.6864   4.7 ------	UNKNOWN