Analysis Summary
Notes:
- 1) No attempt has been made to eliminate the non-significant decimal places.
- 2) This batgrbproduct analysis is done using the HEASARC data.
- 3) This batgrbproduct analysis is using the flight position for the mask-weighting calculation.
==========================================================================
BAT GROUND-DETECTED GRB DATA PROCESSING REPORT
Process Script Ver: batgrbproduct v2.46
Process Start Time: Wed Oct 11 13:10:39 EDT 2017
Host Name: bat1
Current Working Dir: /local/data/bat1/alien/Swift_3rdBATcatalog/event/ground_detect_bursts/scripts
======================================================================
Trigger: 00778019 Segment: 000
BAT Trigger Time: 529361984.0
UTC: 2017-10-10T20:59:24.168 [includes UTCF correction]
Where From?: Ground analysis (best_duration.txt)
NOTE: BAT trigger time for ground-detected burst is the T100 start time.
Analysis Position: [ source = GCN ]
RA: 34.1224 Dec: -54.4044 [deg; J2000]
Refined Position: [ source = BAT pre-slew image ]
RA: 34.123266452 Dec: -54.4101842469 [deg; J2000]
{ 02h 16m 29.6s , -54d -24' -36.7" }
+/- 1.58230542526 [arcmin] (estimated 90% radius based on SNR)
SNR: 15.7933676234
Angular difference between the analysis and refined position is 0.348371 arcmin
Partial Coding Fraction: 0.7109375 [ including projection effects ]
Duration
T90: 30.4000000357628 +/- 1.6
Measured from: 0
to: 30.4 [s; relative to TRIGTIME]
T50: 17.6000000238419 +/- 1.6
Measured from: 6.4
to: 24 [s; relative to TRIGTIME]
====== Table of the duration information =============================
Value tstart tstop
T100 32.000 0.000 32.000
T90 30.400 0.000 30.400
T50 17.600 6.400 24.000
Peak 1.000 0.300 1.300
====== Spectral Analysis Summary =====================================
Model : spectral model: simple power-law (PL) and cutoff power-law (CPL)
Ph_index : photon index: E^{Ph_index}
Ph_90err : 90% error of the photon index
Epeak : Epeak in keV
Epeak_90err: 90% error of Epeak
Norm : normalization at 50 keV in both the PL model and CPL model
Nomr_90err : 90% error of the normalization
chi2 : Chi-Squared
dof : degree of freedo
=== Time-averaged spectral analysis ===
(Best model with acceptable fit: PL)
Model Ph_index Ph_90err_low Ph_90err_hi Epeak Epeak_90err_low Epeak_90err_hi Norm Nomr_90err_low Norm_90err_hi chi2 dof
PL -1.405 -0.176 0.175 - - - 4.02e-03 -4.18e-04 4.16e-04 52.390 57
CPL -0.618 -0.758 0.932 88.237 -24.233 549.016 9.97e-03 N/A N/A 49.240 56
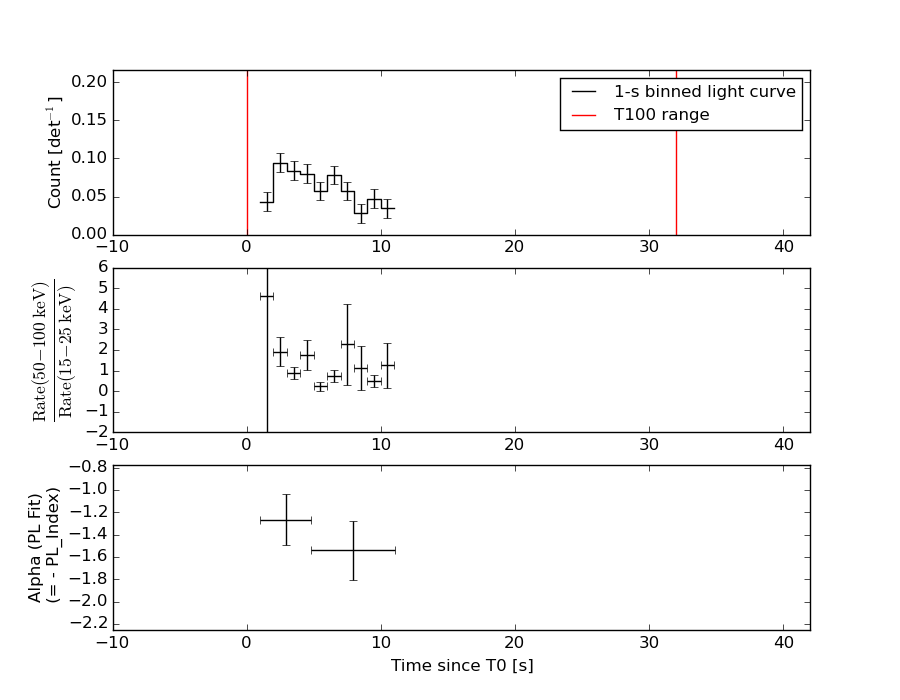
=== 1-s peak spectral analysis ===
(Best model with acceptable fit: N/A)
Model Ph_index Ph_90err_low Ph_90err_hi Epeak Epeak_90err_low Epeak_90err_hi Norm Nomr_90err_low Norm_90err_hi chi2 dof
PL N/A N/A N/A - - - N/A N/A N/A N/A N/A
CPL N/A N/A N/A N/A N/A N/A N/A N/A N/A N/A N/A
=== Fluence/Peak Flux Summary ===
Model Band1 Band2 Band3 Band4 Band5 Total
15-25 25-50 50-100 100-350 15-150 15-350 keV
Fluence PL 4.74e-08 9.24e-08 1.40e-07 4.57e-07 3.92e-07 7.36e-07 erg/cm2
90%_error_low -7.99e-09 -9.83e-09 -1.87e-08 -1.19e-07 -4.54e-08 -1.35e-07 erg/cm2
90%_error_hi 8.35e-09 9.77e-09 1.86e-08 1.44e-07 4.60e-08 1.56e-07 erg/cm2
Peak flux PL N/A N/A N/A N/A N/A N/A ph/cm2/s
Image
Light Curves
Note: The mask-weighted lightcurves have units of either count/det or counts/sec/det, where a det is 0.4 x 0.4 = 0.16 sq cm.
Best duration plot
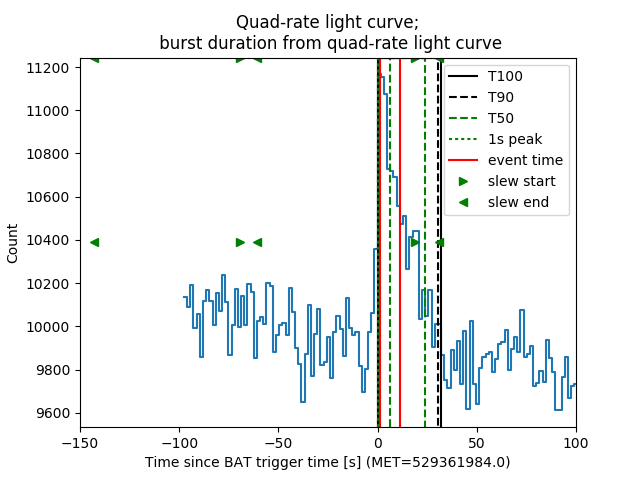
Full-time range; 1 s binning
Other quick-look light curves:
- 64 ms binning (zoomed)
- 16 ms binning (zoomed)
- 8 ms binning (zoomed)
- 2 ms binning (zoomed)
- SN=5 or 10 s binning (full-time range)
- Raw light curve
Spectra
- 64 ms binning (zoomed)
- 16 ms binning (zoomed)
- 8 ms binning (zoomed)
- 2 ms binning (zoomed)
- SN=5 or 10 s binning (full-time range)
- Raw light curve
Spectra
Notes:
- 1) The fitting includes the systematic errors.
- 2) When the burst includes telescope slew time periods, the fitting uses an average response file made from multiple 5-s response files through out the slew time plus single time preiod for the non-slew times, and weighted by the total counts in the corresponding time period using addrmf. An average response file is needed becuase a spectral fit using the pre-slew DRM will introduce some errors in both a spectral shape and a normalization if the PHA file contains a lot of the slew/post-slew time interval.
- 3) For fits to more complicated models (e.g. a power-law over a cutoff power-law), the BAT team has decided to require a chi-square improvement of more than 6 for each extra dof.
Time averaged spectrum fit using the average DRM
Power-law model
Time interval is from    1.000 sec. to   11.088 sec.

Spectral model in power-law:
------------------------------------------------------------
Parameters  : value       lower 90%   higher 90%
Photon index: -1.4052     ( -0.176344   0.17501 )
Norm@50keV  : 4.02355E-03    ( -0.000417721   0.000415744 )
------------------------------------------------------------
#Fit statistic : Chi-Squared =          52.39 using 59 PHA bins.
# Reduced chi-squared =         0.9191 for     57 degrees of freedom
# Null hypothesis probability =   6.485389e-01

Photon flux (15-150 keV)    in 10.09 sec: 0.490583 ( -0.050104  0.050152 ) ph/cm2/s
Energy fluence (15-150 keV)             : 3.91915e-07 ( -4.54484e-08  4.60117e-08 ) ergs/cm2
Cutoff power-law model
Time interval is from    1.000 sec. to   11.088 sec.
Spectral model in the cutoff power-law:
------------------------------------------------------------
Parameters  : value       lower 90%   higher 90%
Photon index: -0.617615     ( -0.757798   0.931877 )
Epeak [keV] : 88.2368      ( -24.2328 549.017 )
Norm@50keV  : 9.96570E-03    (     )
------------------------------------------------------------
#Fit statistic : Chi-Squared =          49.24 using 59 PHA bins.
# Reduced chi-squared =         0.8793 for     56 degrees of freedom
# Null hypothesis probability =   7.266063e-01

Photon flux (15-150 keV)    in 10.09 sec: 0.473018 ( -0.05344  0.053104 ) ph/cm2/s
Energy fluence (15-150 keV)             : 3.68495e-07 ( -5.00083e-08  5.11492e-08 ) ergs/cm2
1-s peak spectrum fit
1-s peak spectrum unavailable, likely because there are no event data in the 1-s peak range.
Time-resolved spectra
Distribution
T90 vs. Hardness ratio plot
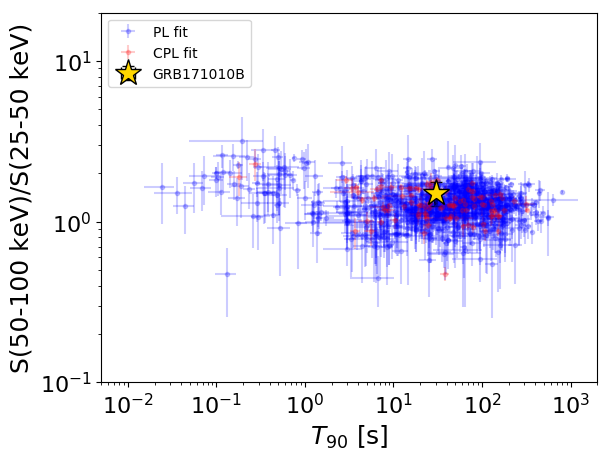
T90                                   = 30.4 sec.
Hardness ratio (energy fluence ratio) = 1.51028842048
S(15-50 keV) vs. S(50-150 keV) plot
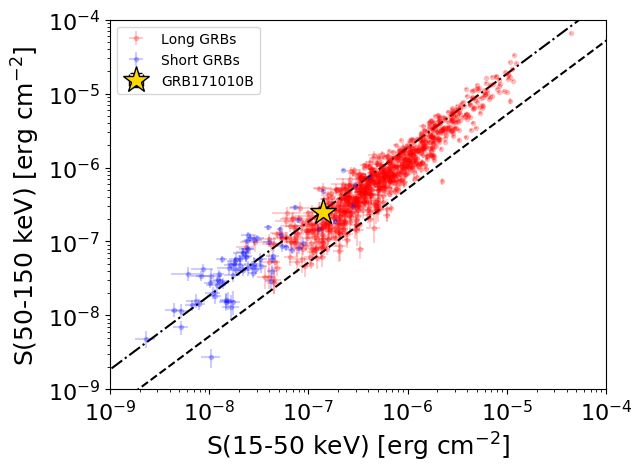
S(15-50 keV)  = 1.3980208e-07
S(50-150 keV) = 2.521133e-07
The dash-dotted line and the dashed line traces the fluences calculated from the Band function with Epeak = 15 and 150 keV, respectively. Both lines assume a canonical values of alpha = -1 and beta = -2.5.
Spacecraft aspect plot
Bright source in the event data image
Event data image of 15-350 keV band
Time interval of the image:
2.300000 11.088500

# RAcent  DECcent POSerr Theta    Phi  PeakCts   SNR AngSep     Name
#  [deg]    [deg]    ['] [deg]  [deg]                   [']
264.7544 -44.4723   21.2  55.0  -33.4  -0.0905  -0.5    1.4	4U 1735-44
 34.1231 -54.4101    0.7  20.5  110.2   0.5802  15.8 ------	UNKNOWN
 86.1129 -42.6465    2.4  41.0  172.3   0.2632   4.8 ------	UNKNOWN
276.4958 -74.2664    3.2  25.4  -44.4   0.1337   3.6 ------	UNKNOWN
Webpage updated on:
Wed Oct 11 13:39:06 EDT 2017