Analysis Summary
Notes:
- 1) No attempt has been made to eliminate the non-significant decimal places.
- 2) This batgrbproduct analysis is done using the HEASARC data.
- 3) This batgrbproduct analysis is using the flight position for the mask-weighting calculation.
======================================================================
BAT GRB EVENT DATA PROCESSING REPORT
Process Script Ver: batgrbproduct v2.46
Process Start Time: Sat Jan 20 05:10:05 EST 2018
Host Name: bat1
Current Working Dir: /local/data/bat1/alien/Swift_3rdBATcatalog/event/batevent_reproc/trigger780845
======================================================================
Trigger: 00780845 Segment: 000
BAT Trigger Time: 530233650.624 [s; MET]
Trigger Stop: 530233658.816 [s; MET]
UTC: 2017-10-20T23:07:10.751760 [includes UTCF correction]
Where From?: TDRSS position message
BAT
RA: 39.2624242628798 Dec: 15.1860174459639 [deg; J2000]
Catalogged Source?: NO
Point Source?: YES
GRB Indicated?: YES [ by BAT flight software ]
Image S/N Ratio: 8.64
Image Trigger?: NO
Rate S/N Ratio: 17.464249196573 [ if not an image trigger ]
Image S/N Ratio: 8.64
Analysis Position: [ source = BAT ]
RA: 39.2624242628798 Dec: 15.1860174459639 [deg; J2000]
Refined Position: [ source = BAT pre-slew burst ]
RA: 39.2594004674261 Dec: 15.1993590075078 [deg; J2000]
{ 02h 37m 02.3s , +15d 11' 57.7" }
+/- 1.80894193723606 [arcmin] (estimated 90% radius based on SNR)
+/- 0.601104503476604 [arcmin] (formal 1-sigma fit error)
SNR: 13.0427422685848
Angular difference between the analysis and refined position is 0.819418 arcmin
Partial Coding Fraction: 0.4804688 [ including projection effects ]
Duration
T90: 41.8560000061989 +/- 9.19157878695337
Measured from: 0.247999966144562
to: 42.1039999723434 [s; relative to TRIGTIME]
T50: 17.727999985218 +/- 4.11358723729074
Measured from: 7.09600001573563
to: 24.8240000009537 [s; relative to TRIGTIME]
Fluence
Peak Flux (peak 1 second)
Measured from: 19.9399999976158
to: 20.9399999976158 [s; relative to TRIGTIME]
Total Fluence
Measured from: -0.967999994754791
to: 46.6480000019073 [s; relative to TRIGTIME]
Band 1 Band 2 Band 3 Band 4
15-25 25-50 50-100 100-350 keV
Total 0.347207 0.461168 0.557084 0.250698
0.062298 0.064489 0.054786 0.048090 [error]
Peak 0.019563 0.038286 0.025938 0.010278
0.008990 0.009323 0.007852 0.006996 [error]
[ fluence units of on-axis counts / fully illuminated detector ]
======================================================================
====== Table of the duration information =============================
Value tstart tstop
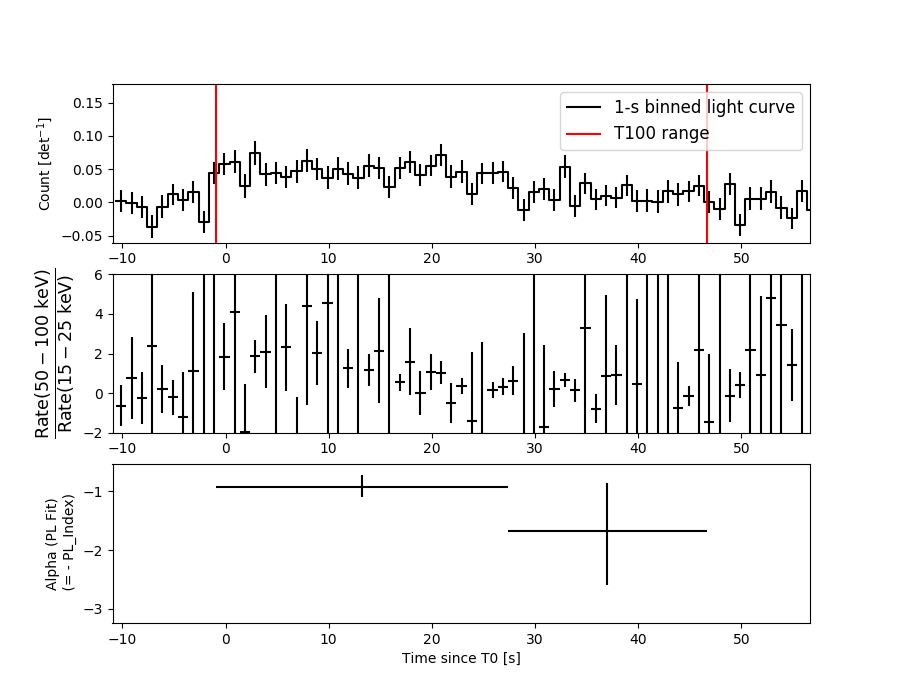
T100 47.616 -0.968 46.648
T90 41.856 0.248 42.104
T50 17.728 7.096 24.824
Peak 1.000 19.940 20.940
====== Spectral Analysis Summary =====================================
Model : spectral model: simple power-law (PL) and cutoff power-law (CPL)
Ph_index : photon index: E^{Ph_index}
Ph_90err : 90% error of the photon index
Epeak : Epeak in keV
Epeak_90err: 90% error of Epeak
Norm : normalization at 50 keV in both the PL model and CPL model
Nomr_90err : 90% error of the normalization
chi2 : Chi-Squared
dof : degree of freedo
=== Time-averaged spectral analysis ===
(Best model with acceptable fit: PL)
Model Ph_index Ph_90err_low Ph_90err_hi Epeak Epeak_90err_low Epeak_90err_hi Norm Nomr_90err_low Norm_90err_hi chi2 dof
PL -1.033 -0.198 0.207 - - - 2.29e-03 -2.62e-04 2.60e-04 66.610 57
CPL -0.844 -0.368 0.966 354.479 -354.479 -354.479 2.77e-03 -7.14e-04 4.29e-03 66.460 56
=== 1-s peak spectral analysis ===
(Best model with acceptable fit: N/A)
Model Ph_index Ph_90err_low Ph_90err_hi Epeak Epeak_90err_low Epeak_90err_hi Norm Nomr_90err_low Norm_90err_hi chi2 dof
PL -1.308 -0.475 0.492 - - - 6.11e-03 -1.72e-03 1.72e-03 73.820 57
CPL -0.116 -1.583 3.955 82.729 -59.377 -82.729 2.29e-02 -2.29e-02 1.26e+00 73.000 56
=== Fluence/Peak Flux Summary ===
Model Band1 Band2 Band3 Band4 Band5 Total
15-25 25-50 50-100 100-350 15-150 15-350 keV
Fluence PL 8.99e-08 2.20e-07 4.30e-07 2.08e-06 1.16e-06 2.82e-06 erg/cm2
90%_error_low -2.09e-08 -3.19e-08 -5.18e-08 -5.28e-07 -1.35e-07 -5.57e-07 erg/cm2
90%_error_hi 2.27e-08 3.13e-08 5.13e-08 6.57e-07 1.36e-07 6.67e-07 erg/cm2
Peak flux PL 2.09e-01 2.36e-01 1.91e-01 2.57e-01 7.30e-01 8.93e-01 ph/cm2/s
90%_error_low -9.89e-02 -7.75e-02 -6.29e-02 -1.38e-01 -2.12e-01 -2.56e-01 ph/cm2/s
90%_error_hi 1.15e-01 7.52e-02 6.16e-02 2.14e-01 2.14e-01 2.61e-01 ph/cm2/s
Fluence CPL 8.57e-08 2.23e-07 4.39e-07 1.61e-06 1.15e-06 2.36e-06 erg/cm2
90%_error_low -2.75e-08 -3.35e-08 -5.86e-08 -1.02e-06 -1.46e-07 -1.02e-06 erg/cm2
90%_error_hi 2.61e-08 3.46e-08 6.49e-08 5.99e-07 1.43e-07 4.82e-07 erg/cm2
Peak flux CPL 1.63e-01 2.57e-01 2.11e-01 9.16e-02 6.95e-01 7.23e-01 ph/cm2/s
90%_error_low -1.22e-01 -8.94e-02 -7.42e-02 -9.16e-02 -2.28e-01 -2.53e-01 ph/cm2/s
90%_error_hi 1.42e-01 9.61e-02 8.00e-02 2.24e-01 2.25e-01 3.20e-01 ph/cm2/s
======================================================================
Image
Pre-slew 15.0-350.0 keV image (Event data)
#   RAcent    DECcent   POSerr    Theta     Phi              Peak Cts       SNR   Name
   39.2594    15.1994   0.0148    28.2642    74.6097         1.6979571     13.043 TRIG_00780845

Foreground time interval of the image:
 -0.968  46.648 (delta_t =  47.616 [sec])
Background time interval of the image:
-222.123  -0.968 (delta_t = 221.155 [sec])
Light Curves
Note: The mask-weighted lightcurves have units of either count/det or counts/sec/det, where a det is 0.4 x 0.4 = 0.16 sq cm.
Full-time range; 1 s binning
Other quick-look light curves:
- 64 ms binning (zoomed)
- 16 ms binning (zoomed)
- 8 ms binning (zoomed)
- 2 ms binning (zoomed)
- SN=5 or 10 s binning (full-time range)
- Raw light curve
Spectra
- 64 ms binning (zoomed)
- 16 ms binning (zoomed)
- 8 ms binning (zoomed)
- 2 ms binning (zoomed)
- SN=5 or 10 s binning (full-time range)
- Raw light curve
Spectra
Notes:
- 1) The fitting includes the systematic errors.
- 2) When the burst includes telescope slew time periods, the fitting uses an average response file made from multiple 5-s response files through out the slew time plus single time preiod for the non-slew times, and weighted by the total counts in the corresponding time period using addrmf. An average response file is needed becuase a spectral fit using the pre-slew DRM will introduce some errors in both a spectral shape and a normalization if the PHA file contains a lot of the slew/post-slew time interval.
- 3) For fits to more complicated models (e.g. a power-law over a cutoff power-law), the BAT team has decided to require a chi-square improvement of more than 6 for each extra dof.
Time averaged spectrum fit using the average DRM
Power-law model
Time interval is from   -0.968 sec. to   46.648 sec.

Spectral model in power-law:
------------------------------------------------------------
Parameters  : value       lower 90%   higher 90%
Photon index: -1.03304     ( -0.19824   0.207175 )
Norm@50keV  : 2.28507E-03    ( -0.000261864   0.000259613 )
------------------------------------------------------------
#Fit statistic : Chi-Squared =          66.61 using 59 PHA bins.
# Reduced chi-squared =          1.169 for     57 degrees of freedom
# Null hypothesis probability =   1.799329e-01

Photon flux (15-150 keV)    in 47.62 sec: 0.263600 ( -0.031096  0.03127 ) ph/cm2/s
Energy fluence (15-150 keV)             : 1.16332e-06 ( -1.35351e-07  1.35892e-07 ) ergs/cm2
Cutoff power-law model
Time interval is from   -0.968 sec. to   46.648 sec.
Spectral model in the cutoff power-law:
------------------------------------------------------------
Parameters  : value       lower 90%   higher 90%
Photon index: -0.844352     ( -0.368182   0.966446 )
Epeak [keV] : 354.479      ( -354.69 -354.69 )
Norm@50keV  : 2.76835E-03    ( -0.000713439   0.00429516 )
------------------------------------------------------------
#Fit statistic : Chi-Squared =          66.46 using 59 PHA bins.
# Reduced chi-squared =          1.187 for     56 degrees of freedom
# Null hypothesis probability =   1.598903e-01

Photon flux (15-150 keV)    in 47.62 sec: 0.261282 ( -0.032862  0.032553 ) ph/cm2/s
Energy fluence (15-150 keV)             : 1.15244e-06 ( -1.46462e-07  1.42587e-07 ) ergs/cm2
1-s peak spectrum fit
Power-law model
Time interval is from   19.940 sec. to   20.940 sec.

Spectral model in power-law:
------------------------------------------------------------
Parameters  : value       lower 90%   higher 90%
Photon index: -1.30789     ( -0.475409   0.492457 )
Norm@50keV  : 6.11356E-03    ( -0.00172137   0.00172082 )
------------------------------------------------------------
#Fit statistic : Chi-Squared =          73.82 using 59 PHA bins.
# Reduced chi-squared =          1.295 for     57 degrees of freedom
# Null hypothesis probability =   6.637389e-02

Photon flux (15-150 keV)    in 1 sec: 0.730443 ( -0.212249  0.213786 ) ph/cm2/s
Energy fluence (15-150 keV)             : 6.03045e-08 ( -1.82841e-08  1.86251e-08 ) ergs/cm2
Cutoff power-law model
Time interval is from   19.940 sec. to   20.940 sec.
Spectral model in the cutoff power-law:
------------------------------------------------------------
Parameters  : value       lower 90%   higher 90%
Photon index: -0.116008     ( -1.58273   3.95522 )
Epeak [keV] : 82.7290      ( -59.3761 -82.7281 )
Norm@50keV  : 2.29400E-02    ( -0.022941   1.2592 )
------------------------------------------------------------
#Fit statistic : Chi-Squared =          73.00 using 59 PHA bins.
# Reduced chi-squared =          1.303 for     56 degrees of freedom
# Null hypothesis probability =   6.314319e-02

Photon flux (15-150 keV)    in 1 sec: 0.694741 ( -0.227602  0.225139 ) ph/cm2/s
Energy fluence (15-150 keV)             : 5.59887e-08 ( -1.92562e-08  2.03456e-08 ) ergs/cm2
Time-resolved spectra
Distribution
T90 vs. Hardness ratio plot
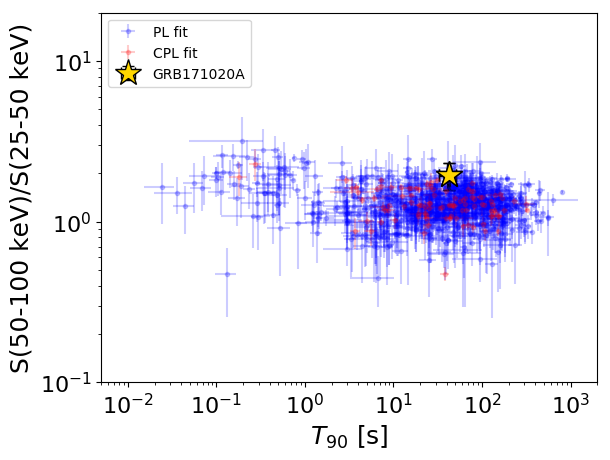
T90                                   = 41.856 sec.
Hardness ratio (energy fluence ratio) = 1.95474412038
S(15-50 keV) vs. S(50-150 keV) plot
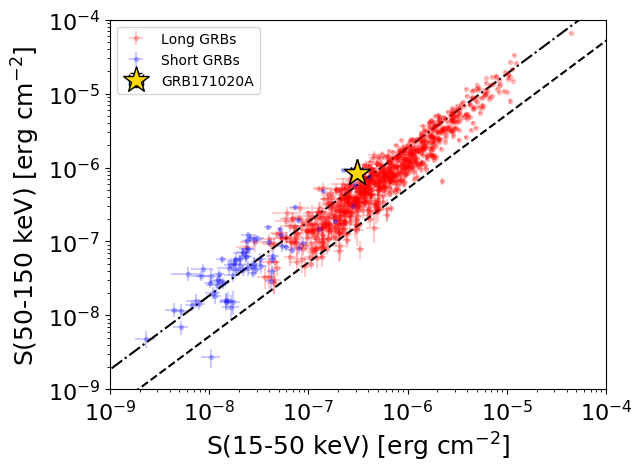
S(15-50 keV)  = 3.1003586e-07
S(50-150 keV) = 8.532783e-07
The dash-dotted line and the dashed line traces the fluences calculated from the Band function with Epeak = 15 and 150 keV, respectively. Both lines assume a canonical values of alpha = -1 and beta = -2.5.
Mask shadow pattern
IMX = 1.426852745462230E-01, IMY = -5.183595386081318E-01
Spacecraft aspect plot
Bright source in the pre-burst/pre-slew/post-slew images
Pre-burst image of 15-350 keV band
Time interval of the image:
-222.123400 -0.968000

# RAcent  DECcent POSerr Theta    Phi  PeakCts   SNR AngSep     Name
#  [deg]    [deg]    ['] [deg]  [deg]                   [']
 83.6323  22.0152    0.7  42.6    0.7   8.9216  17.3    0.1	Crab
326.0768  38.3765   27.6  53.5 -173.5   0.4219   0.4    5.5	Cyg X-2
 75.7324   2.1585    2.5  52.6   26.4   8.3757   4.6 ------	UNKNOWN
 40.9161  61.4295    0.2  18.0 -101.9  25.2126  75.4 ------	UNKNOWN
 18.3178  67.2981    2.6  26.3 -122.8   1.6749   4.5 ------	UNKNOWN
Pre-slew background subtracted image of 15-350 keV band
Time interval of the image:
-0.968000 46.648000

# RAcent  DECcent POSerr Theta    Phi  PeakCts   SNR AngSep     Name
#  [deg]    [deg]    ['] [deg]  [deg]                   [']
 83.7957  21.9756    4.4  42.7    0.6  -0.3594  -2.6    9.3	Crab
326.1118  38.4004   15.1  53.5 -173.5  -0.2196  -0.8    5.5	Cyg X-2
354.8875  18.8278    2.8  44.3  145.7   1.0212   4.2 ------	UNKNOWN
 39.2594  15.1994    0.9  28.3   74.6   1.6978  13.0 ------	UNKNOWN
 97.2749  13.2727    2.3  58.0   -2.2   2.8901   5.0 ------	UNKNOWN
 36.6480  62.8086    3.1  19.4 -108.1   0.3653   3.7 ------	UNKNOWN
333.1448  63.4855    2.5  41.6 -142.7   0.7719   4.7 ------	UNKNOWN
Post-slew image of 15-350 keV band
Time interval of the image:
127.076590 962.535500

# RAcent  DECcent POSerr Theta    Phi  PeakCts   SNR AngSep     Name
#  [deg]    [deg]    ['] [deg]  [deg]                   [']
349.2157  45.8783    2.9  51.7  154.7  13.2938   3.9 ------	UNKNOWN
 21.5963 -13.0659    3.2  33.2   50.2   4.3117   3.6 ------	UNKNOWN
 19.1953   3.1815    3.0  23.1   78.3   3.5177   3.9 ------	UNKNOWN
  1.9855  42.5380    3.3  42.0  155.7   5.6344   3.5 ------	UNKNOWN
 40.9557  61.4308    0.3  46.3 -161.3  76.6161  42.8 ------	UNKNOWN
 79.9785 -28.6636    3.3  58.9  -24.4  19.3733   3.5 ------	UNKNOWN