Analysis Summary
Notes:
- 1) No attempt has been made to eliminate the non-significant decimal places.
- 2) This batgrbproduct analysis is done using the HEASARC data.
- 3) This batgrbproduct analysis is using the flight position for the mask-weighting calculation.
======================================================================
BAT GRB EVENT DATA PROCESSING REPORT
Process Script Ver: batgrbproduct v2.46
Process Start Time: Sat Jan 20 04:57:06 EST 2018
Host Name: bat1
Current Working Dir: /local/data/bat1/alien/Swift_3rdBATcatalog/event/batevent_reproc/trigger790053
======================================================================
Trigger: 00790053 Segment: 000
BAT Trigger Time: 532464700.864 [s; MET]
Trigger Stop: 532464702.912 [s; MET]
UTC: 2017-11-15T18:51:20.858340 [includes UTCF correction]
Where From?: TDRSS position message
BAT
RA: 278.412563701263 Dec: 9.12838471438907 [deg; J2000]
Catalogged Source?: NO
Point Source?: YES
GRB Indicated?: YES [ by BAT flight software ]
Image S/N Ratio: 7.59
Image Trigger?: NO
Rate S/N Ratio: 8.83176086632785 [ if not an image trigger ]
Image S/N Ratio: 7.59
Analysis Position: [ source = BAT ]
RA: 278.412563701263 Dec: 9.12838471438907 [deg; J2000]
Refined Position: [ source = BAT pre-slew burst ]
RA: 278.391772564459 Dec: 9.11771088638416 [deg; J2000]
{ 18h 33m 34.0s , +09d 07' 03.8" }
+/- 1.52951440585242 [arcmin] (estimated 90% radius based on SNR)
+/- 0.67945946282575 [arcmin] (formal 1-sigma fit error)
SNR: 16.5756443668173
Angular difference between the analysis and refined position is 1.388238 arcmin
Partial Coding Fraction: 1.015625 [ including projection effects ]
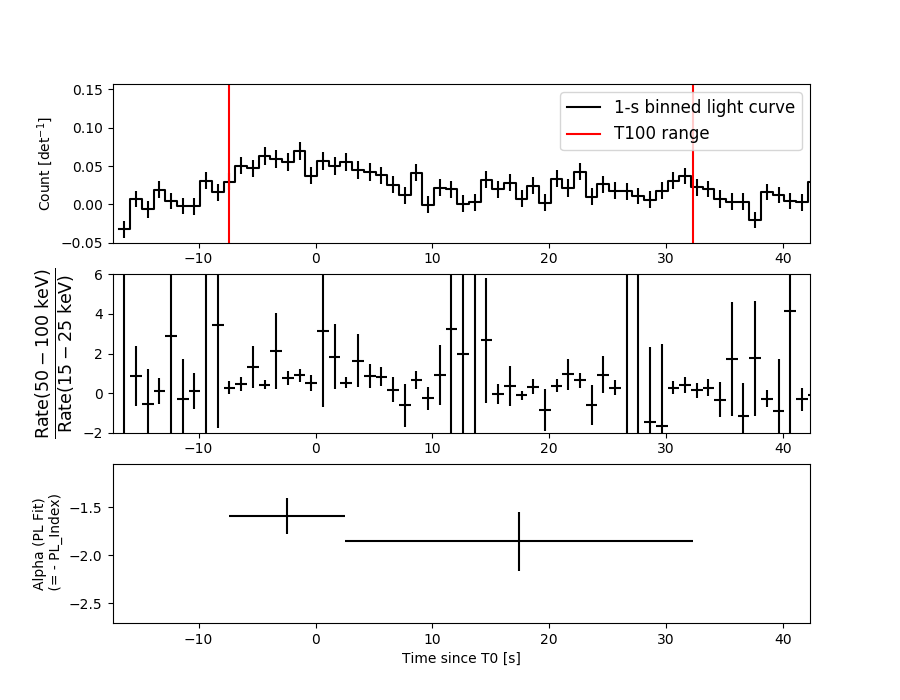
Duration
T90: 36.7719999551773 +/- 5.18024129206609
Measured from: -6.30000001192093
to: 30.4719999432564 [s; relative to TRIGTIME]
T50: 19.6519999504089 +/- 3.96798791377569
Measured from: -1.91200000047684
to: 17.7399999499321 [s; relative to TRIGTIME]
Fluence
Peak Flux (peak 1 second)
Measured from: -2.32400000095367
to: -1.32400000095367 [s; relative to TRIGTIME]
Total Fluence
Measured from: -7.37999999523163
to: 32.3319999575615 [s; relative to TRIGTIME]
Band 1 Band 2 Band 3 Band 4
15-25 25-50 50-100 100-350 keV
Total 0.426202 0.449640 0.273522 0.062766
0.039964 0.038821 0.032961 0.028387 [error]
Peak 0.027859 0.020678 0.023122 0.006521
0.006384 0.006301 0.005567 0.004688 [error]
[ fluence units of on-axis counts / fully illuminated detector ]
======================================================================
====== Table of the duration information =============================
Value tstart tstop
T100 39.712 -7.380 32.332
T90 36.772 -6.300 30.472
T50 19.652 -1.912 17.740
Peak 1.000 -2.324 -1.324
====== Spectral Analysis Summary =====================================
Model : spectral model: simple power-law (PL) and cutoff power-law (CPL)
Ph_index : photon index: E^{Ph_index}
Ph_90err : 90% error of the photon index
Epeak : Epeak in keV
Epeak_90err: 90% error of Epeak
Norm : normalization at 50 keV in both the PL model and CPL model
Nomr_90err : 90% error of the normalization
chi2 : Chi-Squared
dof : degree of freedo
=== Time-averaged spectral analysis ===
(Best model with acceptable fit: PL)
Model Ph_index Ph_90err_low Ph_90err_hi Epeak Epeak_90err_low Epeak_90err_hi Norm Nomr_90err_low Norm_90err_hi chi2 dof
PL -1.722 -0.187 0.183 - - - 1.82e-03 -1.95e-04 1.91e-04 51.470 57
CPL -1.730 -0.179 0.209 9999.360 -9999.350 -9999.360 1.82e-03 -1.33e-03 1.03e-03 51.490 56
=== 1-s peak spectral analysis ===
(Best model with acceptable fit: PL)
Model Ph_index Ph_90err_low Ph_90err_hi Epeak Epeak_90err_low Epeak_90err_hi Norm Nomr_90err_low Norm_90err_hi chi2 dof
PL -1.781 -0.549 0.485 - - - 4.24e-03 -1.36e-03 1.25e-03 52.860 57
CPL -2.148 -0.062 1.805 58.964 N/A N/A 2.79e-03 N/A N/A 52.800 56
=== Fluence/Peak Flux Summary ===
Model Band1 Band2 Band3 Band4 Band5 Total
15-25 25-50 50-100 100-350 15-150 15-350 keV
Fluence PL 1.14e-07 1.83e-07 2.22e-07 5.27e-07 6.69e-07 1.05e-06 erg/cm2
90%_error_low -1.74e-08 -1.73e-08 -3.28e-08 -1.48e-07 -7.45e-08 -1.80e-07 erg/cm2
90%_error_hi 1.80e-08 1.73e-08 3.29e-08 1.84e-07 7.58e-08 2.09e-07 erg/cm2
Peak flux PL 2.29e-01 1.95e-01 1.13e-01 9.85e-02 5.80e-01 6.35e-01 ph/cm2/s
90%_error_low -8.52e-02 -4.82e-02 -4.66e-02 -6.18e-02 -1.43e-01 -1.61e-01 ph/cm2/s
90%_error_hi 9.21e-02 4.82e-02 4.67e-02 1.04e-01 1.43e-01 1.65e-01 ph/cm2/s
Fluence CPL 1.16e-07 1.80e-07 1.61e-07 5.26e-07 6.76e-07 1.04e-06 erg/cm2
90%_error_low -2.56e-08 -2.14e-08 -2.93e-08 N/A -8.11e-08 -2.75e-07 erg/cm2
90%_error_hi 2.27e-08 2.86e-08 2.66e-08 N/A 6.92e-08 1.99e-07 erg/cm2
Peak flux CPL 2.33e-01 1.94e-01 1.12e-01 1.10e-01 5.81e-01 6.37e-01 ph/cm2/s
90%_error_low -9.29e-02 -4.72e-02 N/A N/A -1.44e-01 -1.75e-01 ph/cm2/s
90%_error_hi 9.13e-02 5.41e-02 N/A N/A 1.43e-01 1.60e-01 ph/cm2/s
======================================================================
Image
Pre-slew 15.0-350.0 keV image (Event data)
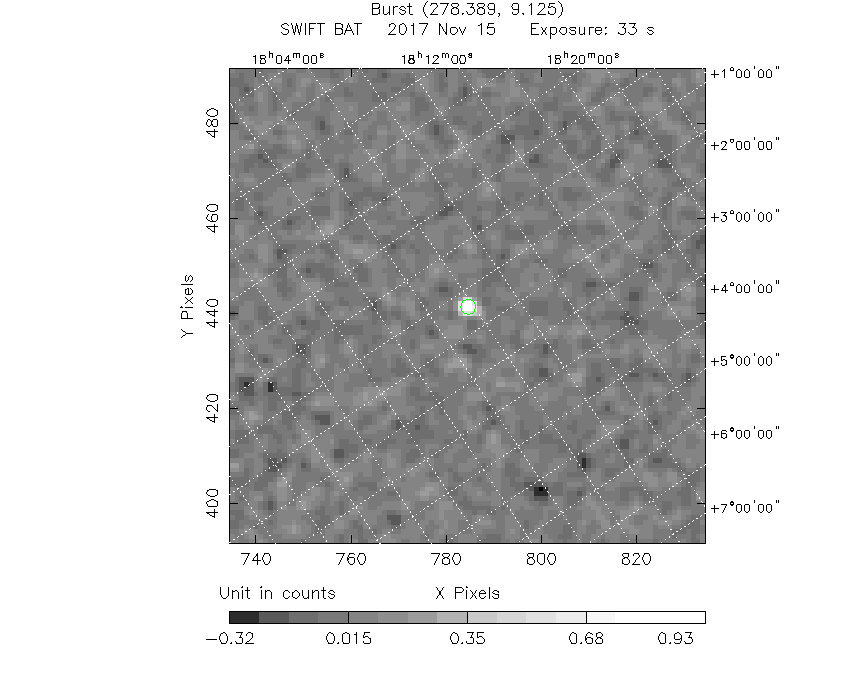
#   RAcent    DECcent   POSerr    Theta     Phi              Peak Cts       SNR   Name
  278.3918     9.1177   0.0116    12.0209    20.3832         1.1638647     16.576 TRIG_00790053

Foreground time interval of the image:
 -7.380  26.037 (delta_t =  33.417 [sec])
Background time interval of the image:
-174.963  -7.380 (delta_t = 167.583 [sec])
Light Curves
Note: The mask-weighted lightcurves have units of either count/det or counts/sec/det, where a det is 0.4 x 0.4 = 0.16 sq cm.
Full-time range; 1 s binning
Other quick-look light curves:
- 64 ms binning (zoomed)
- 16 ms binning (zoomed)
- 8 ms binning (zoomed)
- 2 ms binning (zoomed)
- SN=5 or 10 s binning (full-time range)
- Raw light curve
Spectra
- 64 ms binning (zoomed)
- 16 ms binning (zoomed)
- 8 ms binning (zoomed)
- 2 ms binning (zoomed)
- SN=5 or 10 s binning (full-time range)
- Raw light curve
Spectra
Notes:
- 1) The fitting includes the systematic errors.
- 2) When the burst includes telescope slew time periods, the fitting uses an average response file made from multiple 5-s response files through out the slew time plus single time preiod for the non-slew times, and weighted by the total counts in the corresponding time period using addrmf. An average response file is needed becuase a spectral fit using the pre-slew DRM will introduce some errors in both a spectral shape and a normalization if the PHA file contains a lot of the slew/post-slew time interval.
- 3) For fits to more complicated models (e.g. a power-law over a cutoff power-law), the BAT team has decided to require a chi-square improvement of more than 6 for each extra dof.
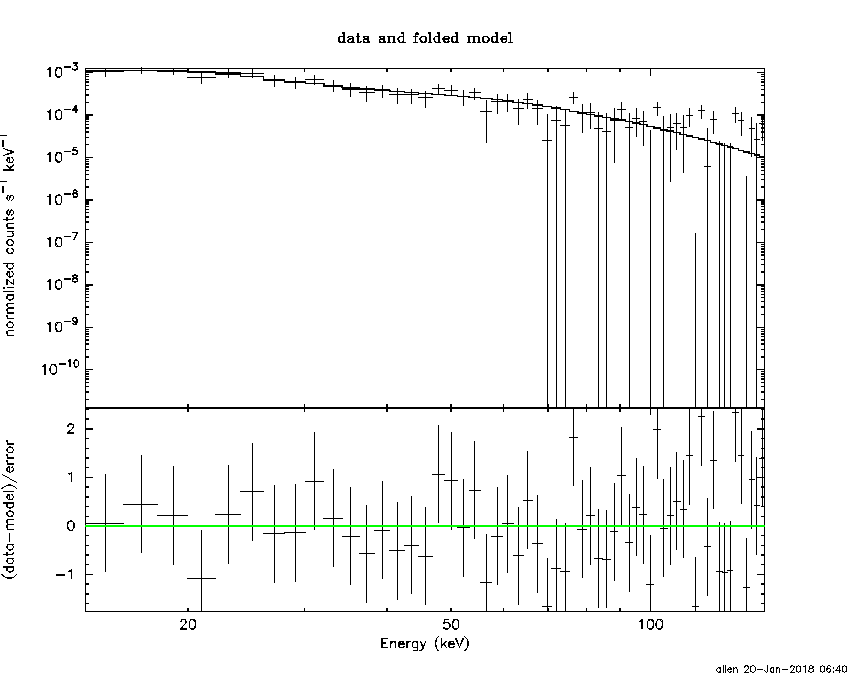
Time averaged spectrum fit using the average DRM
Power-law model

Time interval is from   -7.380 sec. to   32.332 sec.

Spectral model in power-law:
------------------------------------------------------------
Parameters  : value       lower 90%   higher 90%
Photon index: -1.72166     ( -0.187183   0.182758 )
Norm@50keV  : 1.82355E-03    ( -0.000195283   0.000191444 )
------------------------------------------------------------
#Fit statistic : Chi-Squared =          51.47 using 59 PHA bins.
# Reduced chi-squared =         0.9030 for     57 degrees of freedom
# Null hypothesis probability =   6.817514e-01

Photon flux (15-150 keV)    in 39.71 sec: 0.244060 ( -0.023238  0.023281 ) ph/cm2/s
Energy fluence (15-150 keV)             : 6.69483e-07 ( -7.44789e-08  7.58151e-08 ) ergs/cm2
Cutoff power-law model
Time interval is from   -7.380 sec. to   32.332 sec.
Spectral model in the cutoff power-law:
------------------------------------------------------------
Parameters  : value       lower 90%   higher 90%
Photon index: -1.7298     ( -0.179992   0.208057 )
Epeak [keV] : 9999.36      ( -9999.35 -9999.36 )
Norm@50keV  : 1.81538E-03    ( -0.00133417   0.00102661 )
------------------------------------------------------------
#Fit statistic : Chi-Squared =          51.49 using 59 PHA bins.
# Reduced chi-squared =         0.9195 for     56 degrees of freedom
# Null hypothesis probability =   6.460824e-01

Photon flux (15-150 keV)    in 39.71 sec: 0.244493 ( -0.023923  0.023184 ) ph/cm2/s
Energy fluence (15-150 keV)             : 6.75912e-07 ( -8.11406e-08  6.91629e-08 ) ergs/cm2
1-s peak spectrum fit
Power-law model
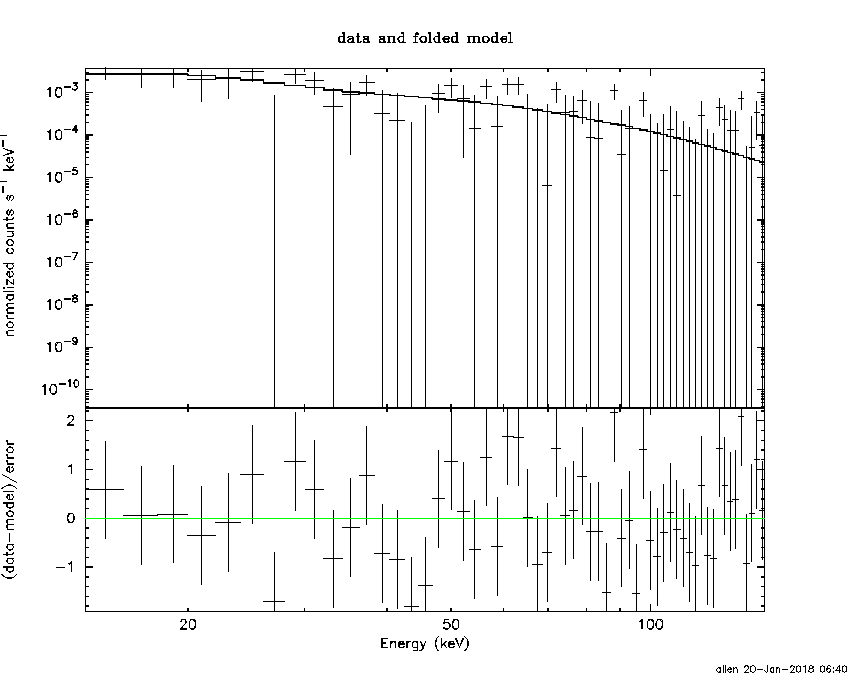
Time interval is from   -2.324 sec. to   -1.324 sec.

Spectral model in power-law:
------------------------------------------------------------
Parameters  : value       lower 90%   higher 90%
Photon index: -1.78118     ( -0.549419   0.485416 )
Norm@50keV  : 4.23754E-03    ( -0.00135546   0.00124864 )
------------------------------------------------------------
#Fit statistic : Chi-Squared =          52.86 using 59 PHA bins.
# Reduced chi-squared =         0.9274 for     57 degrees of freedom
# Null hypothesis probability =   6.310103e-01

Photon flux (15-150 keV)    in 1 sec: 0.579747 ( -0.143394  0.143431 ) ph/cm2/s
Energy fluence (15-150 keV)             : 3.90472e-08 ( -1.20269e-08  1.26194e-08 ) ergs/cm2
Cutoff power-law model
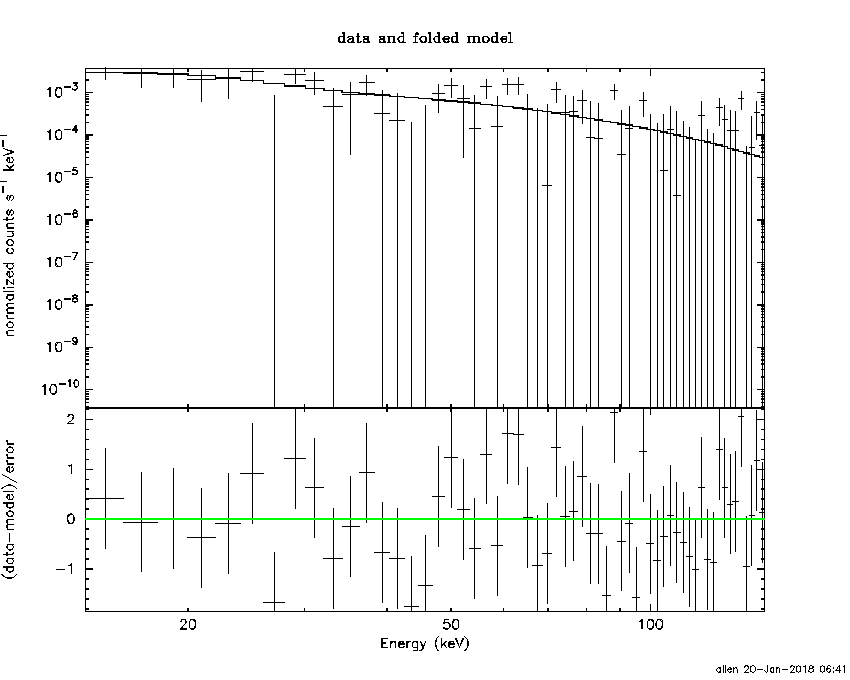
Time interval is from   -2.324 sec. to   -1.324 sec.
Spectral model in the cutoff power-law:
------------------------------------------------------------
Parameters  : value       lower 90%   higher 90%
Photon index: -2.14799     ( -0.0617533   1.80467 )
Epeak [keV] : 58.9638      (   )
Norm@50keV  : 2.79228E-03    (     )
------------------------------------------------------------
#Fit statistic : Chi-Squared =          52.80 using 59 PHA bins.
# Reduced chi-squared =         0.9429 for     56 degrees of freedom
# Null hypothesis probability =   5.967521e-01

Photon flux (15-150 keV)    in 1 sec: 0.580834 ( -0.144253  0.142724 ) ph/cm2/s
Energy fluence (15-150 keV)             : 3.44398e-08 ( -1.52226e-08  1.12301e-08 ) ergs/cm2
Time-resolved spectra
Distribution
T90 vs. Hardness ratio plot
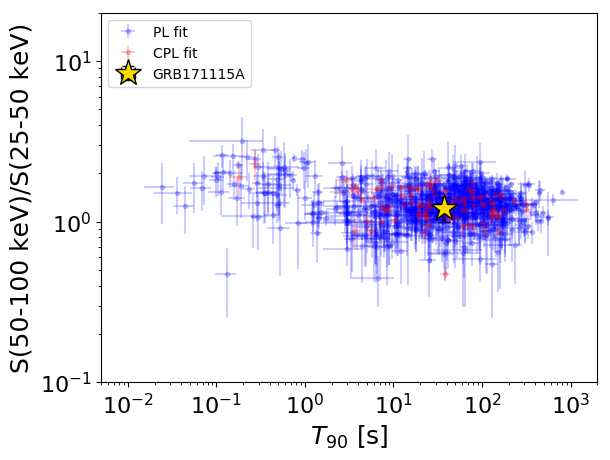
T90                                   = 36.772 sec.
Hardness ratio (energy fluence ratio) = 1.21282986507
S(15-50 keV) vs. S(50-150 keV) plot
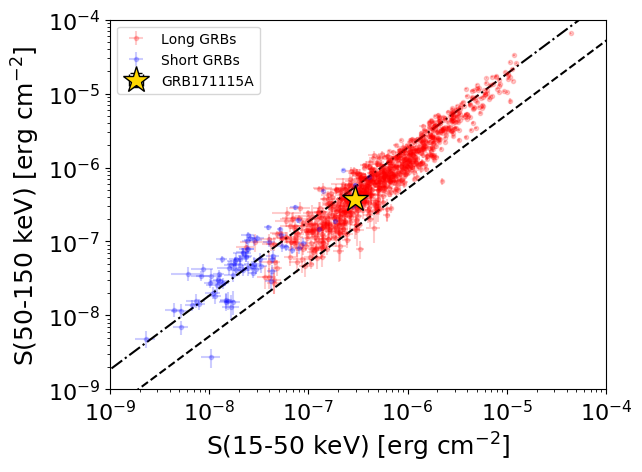
S(15-50 keV)  = 2.967322e-07
S(50-150 keV) = 3.727489e-07
The dash-dotted line and the dashed line traces the fluences calculated from the Band function with Epeak = 15 and 150 keV, respectively. Both lines assume a canonical values of alpha = -1 and beta = -2.5.
Mask shadow pattern
IMX = 1.996049371019823E-01, IMY = -7.416591476991764E-02
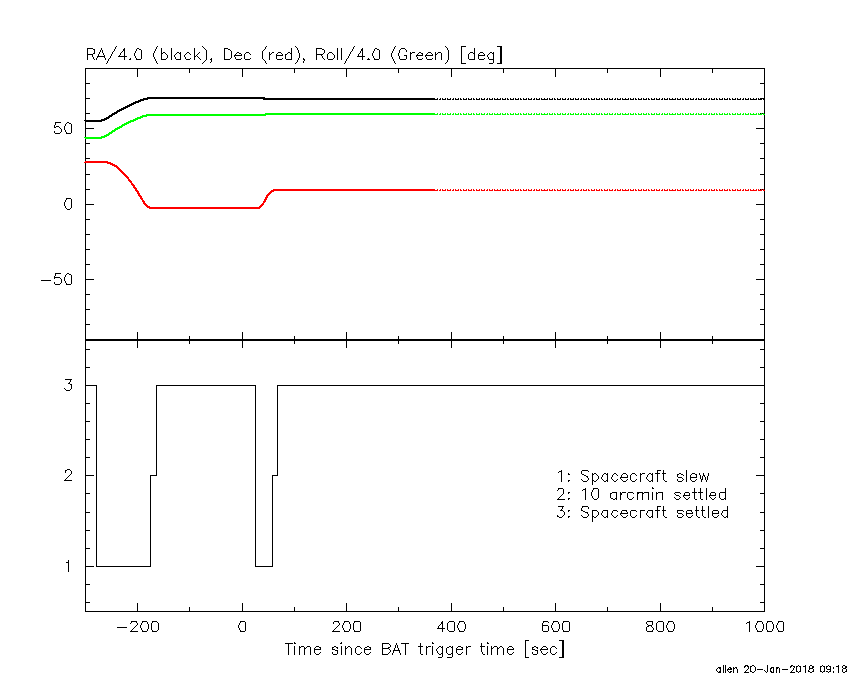
Spacecraft aspect plot
Bright source in the pre-burst/pre-slew/post-slew images
Pre-burst image of 15-350 keV band
Time interval of the image:
-174.963400 -7.380000

# RAcent  DECcent POSerr Theta    Phi  PeakCts   SNR AngSep     Name
#  [deg]    [deg]    ['] [deg]  [deg]                   [']
244.9886 -15.6375    1.0  38.0  -78.7   6.3671  11.4    0.6	Sco X-1
254.3963  35.3358    3.5  45.5    2.7   1.1091   3.3    3.0	Her X-1
256.0828 -37.8860    6.1  42.1 -116.3   1.3367   1.9    5.2	4U 1700-377
256.3910 -36.4294    6.6  40.9 -115.2   1.1065   1.7    2.2	GX 349+2
263.0942 -24.7524    3.9  28.2 -109.7   0.7567   3.0    4.7	GX 1+4
264.7496 -44.4537  199.5  44.3 -129.5   0.0311   0.1    0.4	4U 1735-44
268.2501  -1.3540    6.9  13.0  -51.1  -0.3075  -1.7    9.2	SW J1753.5-0127
270.4002 -25.0215    5.8  24.7 -122.4   0.4508   2.0    7.2	GX 5-1
270.5322 -25.7907    0.0  25.4 -123.4   0.5943   2.6   12.7	GRS 1758-258
273.9865 -14.0022    7.3  13.5 -114.8   0.3088   1.6    2.3	GX 17+2
275.9658 -30.3468    3.5  28.2 -136.7   0.7279   3.3    2.4	H1820-303
285.0759 -24.9991   28.0  22.7 -155.4   0.0709   0.4    5.2	HT1900.1-2455
288.8235  10.9892    4.3  15.6   62.9   0.4925   2.7    3.0	GRS 1915+105
299.4773  35.2388    3.9  41.5   56.5   1.8404   3.0    6.0	Cyg X-1
262.8564 -33.8374    7.2  35.6 -119.6   0.5324   1.6    6.6	GX 354-0
Pre-slew background subtracted image of 15-350 keV band
Time interval of the image:
-7.380000 26.036590

# RAcent  DECcent POSerr Theta    Phi  PeakCts   SNR AngSep     Name
#  [deg]    [deg]    ['] [deg]  [deg]                   [']
245.0284 -15.6217   19.5  37.9  -78.7  -0.1299  -0.6    3.0	Sco X-1
254.4629  35.2493    4.7  45.4    2.7  -0.3244  -2.5    5.6	Her X-1
256.0167 -37.8590    5.5  42.1 -116.2  -0.6259  -2.1    1.7	4U 1700-377
256.2001 -36.3856    3.7  40.9 -115.0  -0.7960  -3.1   11.6	GX 349+2
262.8361 -24.7729    7.8  28.4 -109.3   0.1541   1.5    9.6	GX 1+4
264.7530 -44.5708   11.9  44.4 -129.5  -0.2078  -1.0    7.3	4U 1735-44
268.3114  -1.3462   92.2  12.9  -51.0  -0.0091  -0.1    7.2	SW J1753.5-0127
270.0669 -25.0466    8.3  24.9 -121.8  -0.1223  -1.4   12.0	GX 5-1
270.4968 -25.7428    8.9  25.3 -123.3   0.1165   1.3   10.5	GRS 1758-258
274.0532 -13.8345    0.0  13.3 -114.6  -0.0612  -0.8   12.4	GX 17+2
275.8449 -30.2430   12.7  28.1 -136.5   0.0833   0.9    8.5	H1820-303
285.0956 -24.8334    6.6  22.6 -155.6  -0.1293  -1.7    6.2	HT1900.1-2455
288.8728  10.8195    6.3  15.4   63.3   0.1367   1.8    8.7	GRS 1915+105
299.7376  35.2484    4.3  41.6   56.8   0.6885   2.7    7.7	Cyg X-1
262.9892 -33.9747    5.6  35.7 -119.9   0.2689   2.1    8.4	GX 354-0
278.3918   9.1177    0.7  12.0   20.4   1.1640  16.6 ------	UNKNOWN
299.0446 -28.1911    2.7  30.8 -178.2   0.3476   4.2 ------	UNKNOWN
Post-slew image of 15-350 keV band
Time interval of the image:
58.436590 962.212600

# RAcent  DECcent POSerr Theta    Phi  PeakCts   SNR AngSep     Name
#  [deg]    [deg]    ['] [deg]  [deg]                   [']
254.4853  35.3560    1.5  34.1   -4.9   6.2734   7.9    1.6	Her X-1
262.8424 -24.6910    4.6  37.1 -124.9   2.8040   2.5    9.7	GX 1+4
268.3182  -1.6535    0.0  14.7 -105.3   1.1267   1.7   12.4	SW J1753.5-0127
270.2349 -25.1255    4.0  35.2 -135.9   2.7418   2.9    3.9	GX 5-1
270.4082 -25.7224    2.4  35.7 -136.4   4.5431   4.9    5.8	GRS 1758-258
274.0178 -14.0760    1.8  23.6 -138.1   3.8703   6.5    2.5	GX 17+2
275.8133 -30.3144    4.5  39.5 -145.2   2.6264   2.5    6.6	H1820-303
285.0384 -24.8797   23.8  34.6 -159.4  -0.3723  -0.5    2.5	HT1900.1-2455
288.8576  11.0019    1.9  10.5  110.0   4.1913   6.2    4.9	GRS 1915+105
299.5956  35.2070    1.7  32.5   64.6   7.5967   6.7    0.4	Cyg X-1
262.8459 -33.7400   11.0  45.3 -130.5  -2.1593  -1.0    9.1	GX 354-0
310.0074  38.0467    3.8  40.5   70.7   8.8203   3.0 ------	UNKNOWN
315.0337  24.4228    3.5  38.1   93.0   6.6812   3.3 ------	UNKNOWN
293.0639  56.6528    3.3  48.9   41.9  10.9792   3.6 ------	UNKNOWN
294.2383  19.1050    4.1  18.3   86.5   1.9262   2.8 ------	UNKNOWN
233.7837  50.3665    5.6  55.2   -1.8   4.1985   2.1 ------	UNKNOWN
236.4266  31.9050    2.9  45.0  -22.1   4.1248   4.0 ------	UNKNOWN
258.2031 -12.3578    2.2  29.4 -105.4   4.7730   5.3 ------	UNKNOWN
229.2427  23.0117    2.4  49.0  -36.1   8.3093   4.9 ------	UNKNOWN