Analysis Summary
Notes:
- 1) No attempt has been made to eliminate the non-significant decimal places.
- 2) This batgrbproduct analysis is done using the HEASARC data.
- 3) This batgrbproduct analysis is using the flight position for the mask-weighting calculation.
======================================================================
BAT GRB EVENT DATA PROCESSING REPORT
Process Script Ver: batgrbproduct v2.46
Process Start Time: Sat Jan 20 09:51:53 EST 2018
Host Name: bat1
Current Working Dir: /local/data/bat1/alien/Swift_3rdBATcatalog/event/batevent_reproc/trigger796100
======================================================================
Trigger: 00796100 Segment: 000
BAT Trigger Time: 534523596.352 [s; MET]
Trigger Stop: 534523600.448 [s; MET]
UTC: 2017-12-09T14:46:16.223100 [includes UTCF correction]
Where From?: TDRSS position message
BAT
RA: 139.381678720042 Dec: -30.5276478397297 [deg; J2000]
Catalogged Source?: NO
Point Source?: YES
GRB Indicated?: YES [ by BAT flight software ]
Image S/N Ratio: 7.97
Image Trigger?: NO
Rate S/N Ratio: 9 [ if not an image trigger ]
Image S/N Ratio: 7.97
Analysis Position: [ source = BAT ]
RA: 139.381678720042 Dec: -30.5276478397297 [deg; J2000]
Refined Position: [ source = BAT pre-slew burst ]
RA: 139.386827755818 Dec: -30.522898752921 [deg; J2000]
{ 09h 17m 32.8s , -30d 31' 22.4" }
+/- 1.22291823167493 [arcmin] (estimated 90% radius based on SNR)
+/- 0.507683091509645 [arcmin] (formal 1-sigma fit error)
SNR: 22.8173352447555
Angular difference between the analysis and refined position is 0.389892 arcmin
Partial Coding Fraction: 0.6171875 [ including projection effects ]
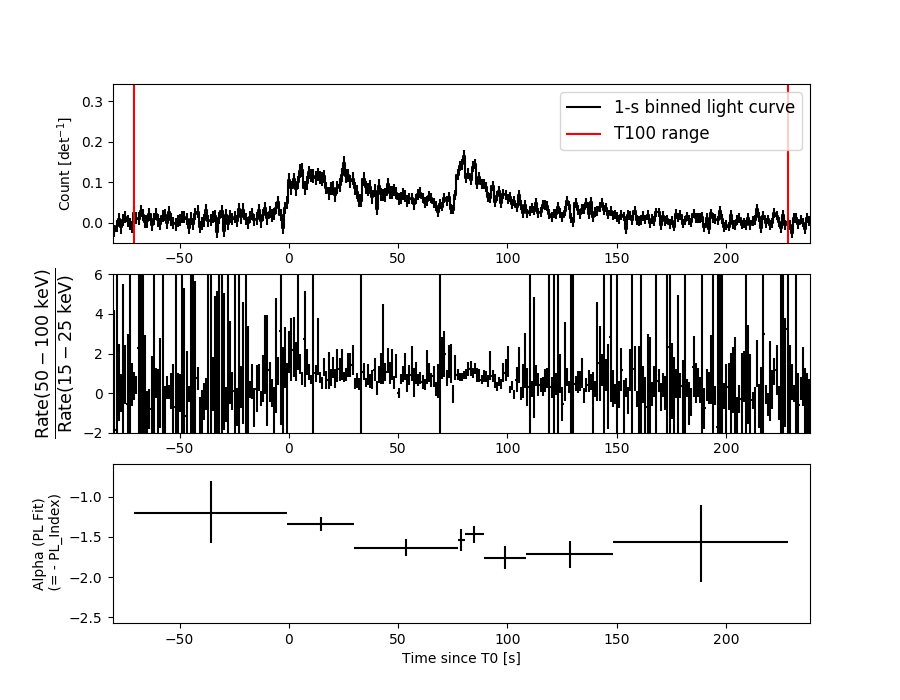
Duration
T90: 161.647999942303 +/- 30.7587722246145
Measured from: -5.2039999961853
to: 156.443999946117 [s; relative to TRIGTIME]
T50: 70.1039999723434 +/- 4.36929745260489
Measured from: 18.5
to: 88.6039999723434 [s; relative to TRIGTIME]
Fluence
Peak Flux (peak 1 second)
Measured from: 79.5159999728203
to: 80.5159999728203 [s; relative to TRIGTIME]
Total Fluence
Measured from: -70.755999982357
to: 228.43599998951 [s; relative to TRIGTIME]
Band 1 Band 2 Band 3 Band 4
15-25 25-50 50-100 100-350 keV
Total 3.266617 4.412842 3.281470 0.778833
0.125508 0.131204 0.114638 0.100451 [error]
Peak 0.053189 0.078453 0.046665 0.008595
0.006941 0.007601 0.006712 0.005318 [error]
[ fluence units of on-axis counts / fully illuminated detector ]
======================================================================
====== Table of the duration information =============================
Value tstart tstop
T100 299.192 -70.756 228.436
T90 161.648 -5.204 156.444
T50 70.104 18.500 88.604
Peak 1.000 79.516 80.516
====== Spectral Analysis Summary =====================================
Model : spectral model: simple power-law (PL) and cutoff power-law (CPL)
Ph_index : photon index: E^{Ph_index}
Ph_90err : 90% error of the photon index
Epeak : Epeak in keV
Epeak_90err: 90% error of Epeak
Norm : normalization at 50 keV in both the PL model and CPL model
Nomr_90err : 90% error of the normalization
chi2 : Chi-Squared
dof : degree of freedo
=== Time-averaged spectral analysis ===
(Best model with acceptable fit: PL)
Model Ph_index Ph_90err_low Ph_90err_hi Epeak Epeak_90err_low Epeak_90err_hi Norm Nomr_90err_low Norm_90err_hi chi2 dof
PL -1.541 -0.067 0.067 - - - 2.58e-03 -9.18e-05 9.17e-05 58.440 57
CPL -1.432 -0.154 0.228 248.082 -248.082 -248.082 2.91e-03 -6.03e-04 7.25e-04 58.770 56
=== 1-s peak spectral analysis ===
(Best model with acceptable fit: PL)
Model Ph_index Ph_90err_low Ph_90err_hi Epeak Epeak_90err_low Epeak_90err_hi Norm Nomr_90err_low Norm_90err_hi chi2 dof
PL -1.440 -0.195 0.192 - - - 1.19e-02 -1.41e-03 1.40e-03 47.840 57
CPL -0.993 -0.548 0.947 108.198 -46.077 -108.198 2.05e-02 -9.69e-03 4.33e-02 46.900 56
=== Fluence/Peak Flux Summary ===
Model Band1 Band2 Band3 Band4 Band5 Total
15-25 25-50 50-100 100-350 15-150 15-350 keV
Fluence PL 1.02e-06 1.83e-06 2.52e-06 7.19e-06 7.27e-06 1.26e-05 erg/cm2
90%_error_low -6.82e-08 -7.14e-08 -1.17e-07 -7.22e-07 -2.78e-07 -8.00e-07 erg/cm2
90%_error_hi 6.98e-08 7.11e-08 1.16e-07 7.78e-07 2.79e-07 8.44e-07 erg/cm2
Peak flux PL 4.64e-01 4.84e-01 3.56e-01 4.23e-01 1.47e+00 1.73e+00 ph/cm2/s
90%_error_low -8.47e-02 -5.74e-02 -5.33e-02 -1.15e-01 -1.66e-01 -2.04e-01 ph/cm2/s
90%_error_hi 8.87e-02 5.70e-02 5.29e-02 1.39e-01 1.66e-01 2.07e-01 ph/cm2/s
Fluence CPL 1.01e-06 1.84e-06 2.53e-06 6.60e-06 7.23e-06 1.20e-05 erg/cm2
90%_error_low -8.44e-08 -7.38e-08 -1.19e-07 -2.07e-06 -3.02e-07 -2.09e-06 erg/cm2
90%_error_hi 7.09e-08 8.02e-08 1.24e-07 7.38e-07 2.87e-07 8.62e-07 erg/cm2
Peak flux CPL 4.34e-01 5.08e-01 3.67e-01 2.45e-01 1.44e+00 1.55e+00 ph/cm2/s
90%_error_low -1.00e-01 -7.08e-02 -5.79e-02 -1.50e-01 -1.73e-01 -2.38e-01 ph/cm2/s
90%_error_hi 1.02e-01 7.45e-02 5.95e-02 2.20e-01 1.72e-01 2.97e-01 ph/cm2/s
======================================================================
Image
Pre-slew 15.0-350.0 keV image (Event data)
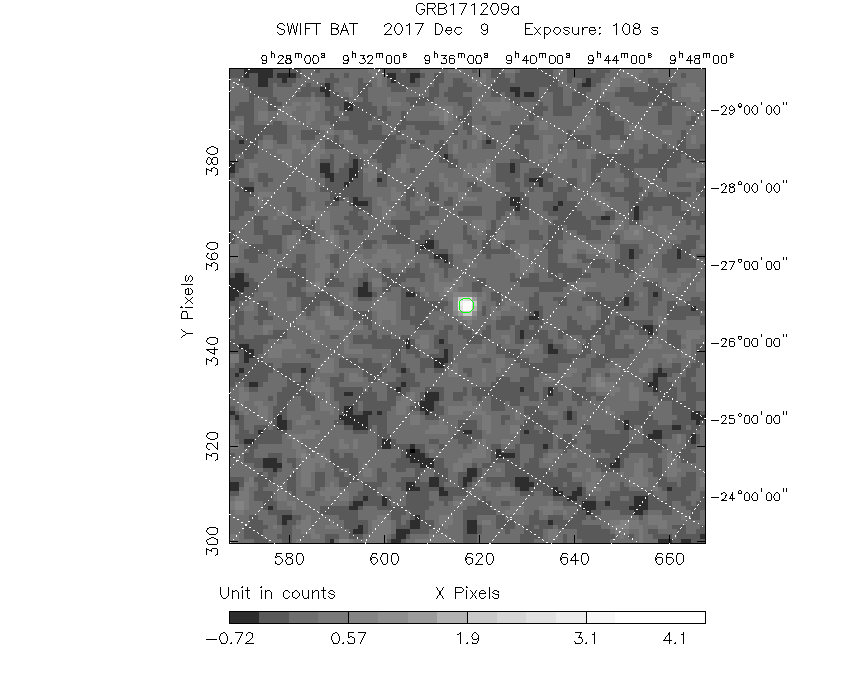
#   RAcent    DECcent   POSerr    Theta     Phi              Peak Cts       SNR   Name
  139.3868   -30.5229   0.0085    31.4838    25.8353         4.7420407     22.817 TRIG_00796100

Foreground time interval of the image:
-70.756  36.749 (delta_t = 107.505 [sec])
Background time interval of the image:
-239.352 -70.756 (delta_t = 168.596 [sec])
Light Curves
Note: The mask-weighted lightcurves have units of either count/det or counts/sec/det, where a det is 0.4 x 0.4 = 0.16 sq cm.
Full-time range; 1 s binning
Other quick-look light curves:
- 64 ms binning (zoomed)
- 16 ms binning (zoomed)
- 8 ms binning (zoomed)
- 2 ms binning (zoomed)
- SN=5 or 10 s binning (full-time range)
- Raw light curve
Spectra
- 64 ms binning (zoomed)
- 16 ms binning (zoomed)
- 8 ms binning (zoomed)
- 2 ms binning (zoomed)
- SN=5 or 10 s binning (full-time range)
- Raw light curve
Spectra
Notes:
- 1) The fitting includes the systematic errors.
- 2) When the burst includes telescope slew time periods, the fitting uses an average response file made from multiple 5-s response files through out the slew time plus single time preiod for the non-slew times, and weighted by the total counts in the corresponding time period using addrmf. An average response file is needed becuase a spectral fit using the pre-slew DRM will introduce some errors in both a spectral shape and a normalization if the PHA file contains a lot of the slew/post-slew time interval.
- 3) For fits to more complicated models (e.g. a power-law over a cutoff power-law), the BAT team has decided to require a chi-square improvement of more than 6 for each extra dof.
Time averaged spectrum fit using the average DRM
Power-law model
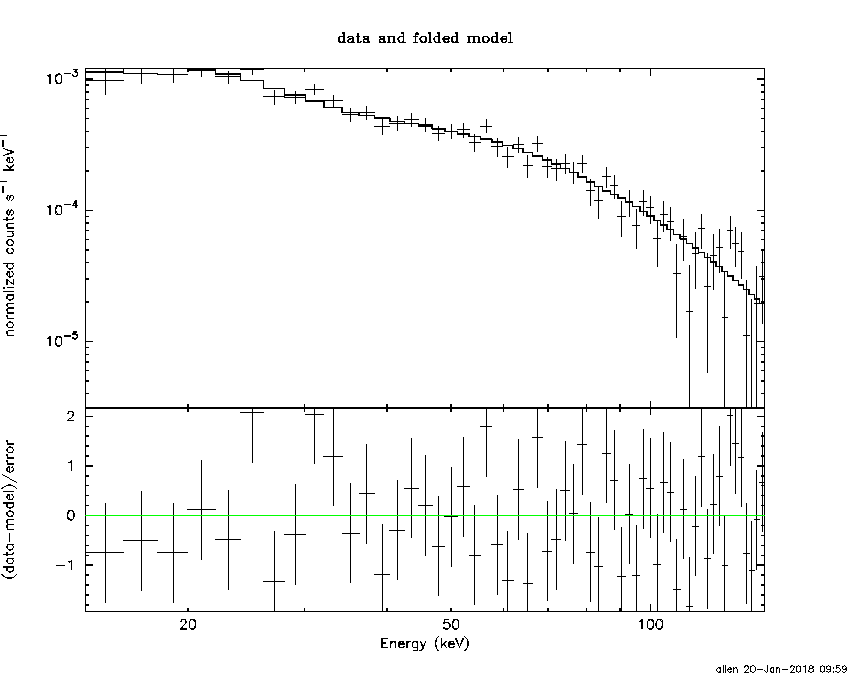
Time interval is from  -70.756 sec. to  228.436 sec.

Spectral model in power-law:
------------------------------------------------------------
Parameters  : value       lower 90%   higher 90%
Photon index: -1.5411     ( -0.0673306   0.0672311 )
Norm@50keV  : 2.57653E-03    ( -9.18242e-05   9.16898e-05 )
------------------------------------------------------------
#Fit statistic : Chi-Squared =          58.44 using 59 PHA bins.
# Reduced chi-squared =          1.025 for     57 degrees of freedom
# Null hypothesis probability =   4.221448e-01

Photon flux (15-150 keV)    in 299.2 sec: 0.325349 ( -0.012267  0.01231 ) ph/cm2/s
Energy fluence (15-150 keV)             : 7.2676e-06 ( -2.78332e-07  2.79354e-07 ) ergs/cm2
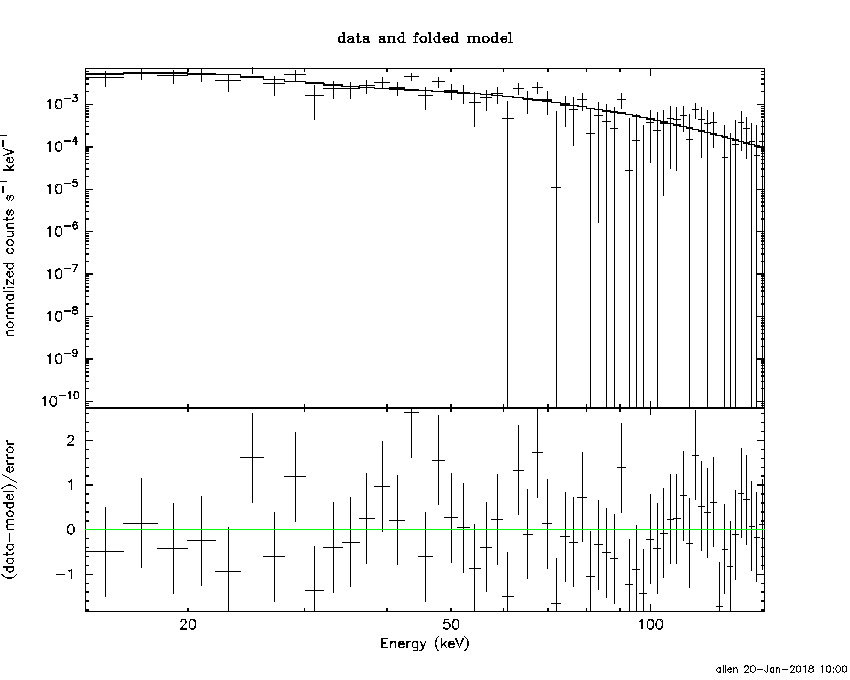
Cutoff power-law model

Time interval is from  -70.756 sec. to  228.436 sec.
Spectral model in the cutoff power-law:
------------------------------------------------------------
Parameters  : value       lower 90%   higher 90%
Photon index: -1.48523     ( -0.102274   0.279627 )
Epeak [keV] : 469.016      ( -482.532 -482.532 )
Norm@50keV  : 2.74269E-03    ( -0.000434642   0.000893344 )
------------------------------------------------------------
#Fit statistic : Chi-Squared =          58.31 using 59 PHA bins.
# Reduced chi-squared =          1.041 for     56 degrees of freedom
# Null hypothesis probability =   3.905639e-01

Photon flux (15-150 keV)    in 299.2 sec: 0.324141 ( -0.013374  0.006715 ) ph/cm2/s
Energy fluence (15-150 keV)             : 7.23439e-06 ( -3.0218e-07  2.8741e-07 ) ergs/cm2
1-s peak spectrum fit
Power-law model
Time interval is from   79.516 sec. to   80.516 sec.

Spectral model in power-law:
------------------------------------------------------------
Parameters  : value       lower 90%   higher 90%
Photon index: -1.44024     ( -0.194826   0.191837 )
Norm@50keV  : 1.19317E-02    ( -0.0014136   0.00140137 )
------------------------------------------------------------
#Fit statistic : Chi-Squared =          47.84 using 59 PHA bins.
# Reduced chi-squared =         0.8393 for     57 degrees of freedom
# Null hypothesis probability =   8.010027e-01

Photon flux (15-150 keV)    in 1 sec: 1.46692 ( -0.16637  0.16643 ) ph/cm2/s
Energy fluence (15-150 keV)             : 1.14401e-07 ( -1.50985e-08  1.5302e-08 ) ergs/cm2
Cutoff power-law model
Time interval is from   79.516 sec. to   80.516 sec.
Spectral model in the cutoff power-law:
------------------------------------------------------------
Parameters  : value       lower 90%   higher 90%
Photon index: -0.992719     ( -0.547402   0.94697 )
Epeak [keV] : 108.198      ( -46.1001 -108.221 )
Norm@50keV  : 2.05166E-02    ( -0.00968408   0.0433367 )
------------------------------------------------------------
#Fit statistic : Chi-Squared =          46.90 using 59 PHA bins.
# Reduced chi-squared =         0.8375 for     56 degrees of freedom
# Null hypothesis probability =   8.017112e-01

Photon flux (15-150 keV)    in 1 sec: 1.44323 ( -0.17273  0.17175 ) ph/cm2/s
Energy fluence (15-150 keV)             : 1.09959e-07 ( -1.73443e-08  1.71452e-08 ) ergs/cm2
Time-resolved spectra
Distribution
T90 vs. Hardness ratio plot
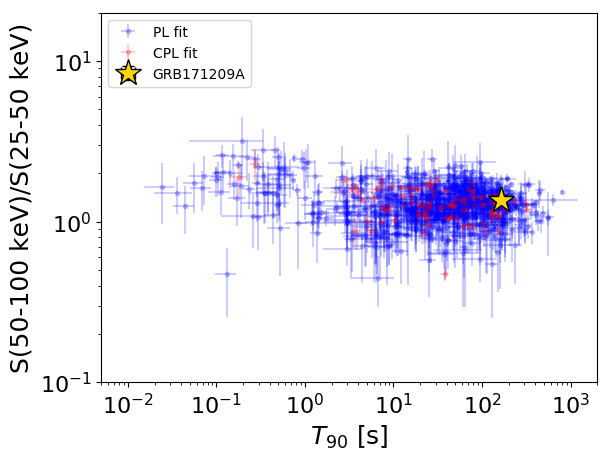
T90                                   = 161.648 sec.
Hardness ratio (energy fluence ratio) = 1.37454808072
S(15-50 keV) vs. S(50-150 keV) plot
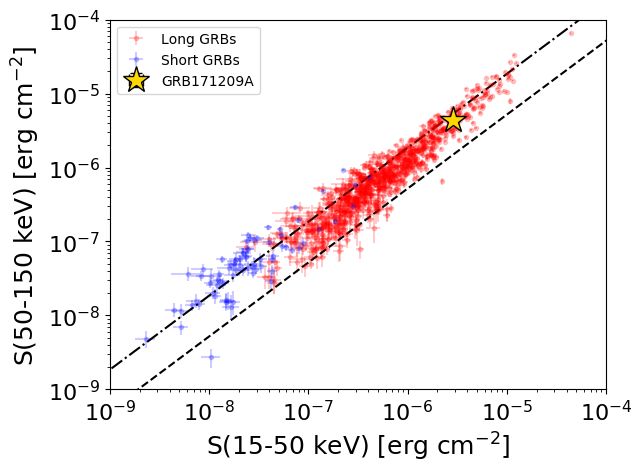
S(15-50 keV)  = 2.856353e-06
S(50-150 keV) = 4.411297e-06
The dash-dotted line and the dashed line traces the fluences calculated from the Band function with Epeak = 15 and 150 keV, respectively. Both lines assume a canonical values of alpha = -1 and beta = -2.5.
Mask shadow pattern
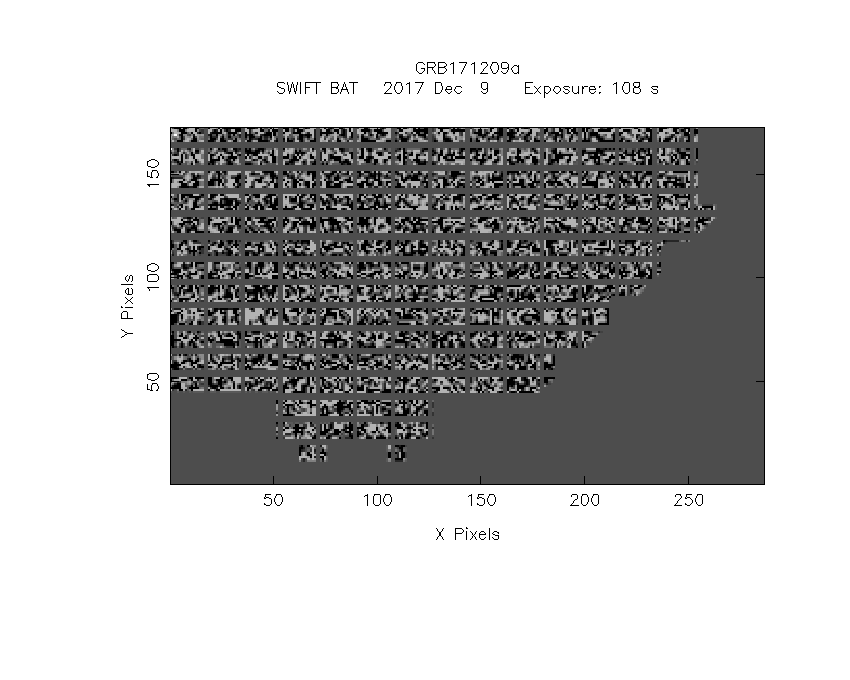
IMX = 5.512023442474684E-01, IMY = -2.668801861278758E-01
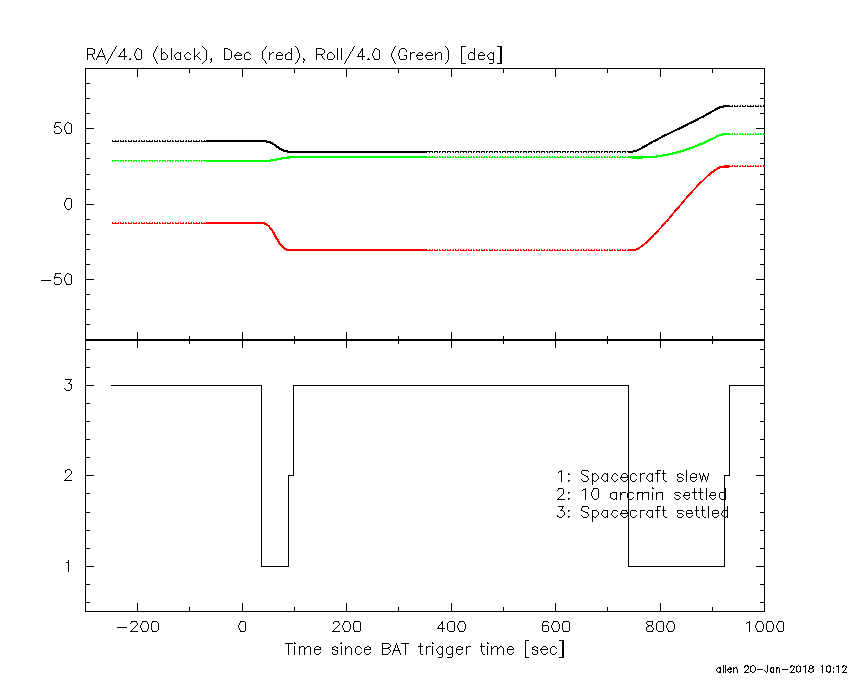
Spacecraft aspect plot
Bright source in the pre-burst/pre-slew/post-slew images
Pre-burst image of 15-350 keV band
Time interval of the image:
-239.352000 -70.756000

# RAcent  DECcent POSerr Theta    Phi  PeakCts   SNR AngSep     Name
#  [deg]    [deg]    ['] [deg]  [deg]                   [']
135.5297 -40.7496  171.0  39.7   13.9  -0.0179  -0.1   11.7	Vela X-1
170.3707 -60.6066    6.2  48.1  -26.9   0.6900   1.9    1.9	Cen X-3
186.5721 -62.8162    2.9  52.1  -35.9   2.8176   3.9    3.6	GX 301-2
156.6379  35.7167    2.2  49.3  143.6   4.6091   5.1 ------	UNKNOWN
188.1744   1.7534    2.6  25.1 -148.2   0.8783   4.4 ------	UNKNOWN
194.7405  -1.4848    2.3  29.3 -134.9   1.1028   5.1 ------	UNKNOWN
208.3997  28.3111    2.9  56.9 -161.3   4.1173   4.0 ------	UNKNOWN
204.9182 -39.1996    2.2  42.5  -69.2   3.8853   5.2 ------	UNKNOWN
Pre-slew background subtracted image of 15-350 keV band
Time interval of the image:
-70.756000 36.748590

# RAcent  DECcent POSerr Theta    Phi  PeakCts   SNR AngSep     Name
#  [deg]    [deg]    ['] [deg]  [deg]                   [']
135.5142 -40.4060   34.3  39.5   14.3  -0.0807  -0.3    8.9	Vela X-1
170.3076 -60.7217   10.6  48.2  -26.8  -0.3470  -1.1    5.9	Cen X-3
186.3357 -62.8258    3.9  52.1  -35.7  -1.9399  -3.0    9.4	GX 301-2
139.3868 -30.5229    0.5  31.5   25.8   4.7413  22.8 ------	UNKNOWN
189.5588  33.8823    2.2  51.0  178.9   2.3199   5.2 ------	UNKNOWN
143.9417 -56.2149    1.7  47.3   -7.4   1.8964   6.7 ------	UNKNOWN
Post-slew image of 15-350 keV band
Time interval of the image:
88.348620 482.687200

# RAcent  DECcent POSerr Theta    Phi  PeakCts   SNR AngSep     Name
#  [deg]    [deg]    ['] [deg]  [deg]                   [']
135.4597 -40.5459    2.3  10.5  -17.1   2.9467   5.0    3.2	Vela X-1
170.5676 -60.6211   13.6  36.5  -59.0   1.0258   0.8    7.4	Cen X-3
186.5890 -62.6561    3.0  43.9  -62.8  10.8899   3.8    7.1	GX 301-2
149.6478  20.8266    2.5  52.3  158.5  13.0599   4.7 ------	UNKNOWN
152.9892  22.7919    2.8  54.9  161.7  15.0217   4.1 ------	UNKNOWN
 79.3791 -48.6969    3.3  48.3   16.3   4.7672   3.5 ------	UNKNOWN
139.3360 -30.5277    2.2   0.0   69.1   3.1310   5.3 ------	UNKNOWN
157.3476  -5.6528    2.7  30.1 -175.9   2.8282   4.3 ------	UNKNOWN
164.1295 -49.6960    3.2  26.7  -70.8   2.9952   3.5 ------	UNKNOWN
 68.0953 -78.4186    2.2  56.4  -20.5  12.9734   5.2 ------	UNKNOWN
160.6256 -74.9883    2.6  45.7  -41.2   5.8428   4.5 ------	UNKNOWN
186.6108 -11.1897    3.3  47.7 -137.1   7.1134   3.5 ------	UNKNOWN