Analysis Summary
Notes:
- 1) No attempt has been made to eliminate the non-significant decimal places.
- 2) This batgrbproduct analysis is done using the HEASARC data.
- 3) This batgrbproduct analysis is using the flight position for the mask-weighting calculation.
======================================================================
BAT GRB EVENT DATA PROCESSING REPORT
Process Script Ver: batgrbproduct v2.46
Process Start Time: Sat Jan 20 09:20:59 EST 2018
Host Name: bat1
Current Working Dir: /local/data/bat1/alien/Swift_3rdBATcatalog/event/batevent_reproc/trigger796469
======================================================================
Trigger: 00796469 Segment: 000
BAT Trigger Time: 534677273.088 [s; MET]
Trigger Stop: 534677274.112 [s; MET]
UTC: 2017-12-11T09:27:32.949900 [includes UTCF correction]
Where From?: TDRSS position message
BAT
RA: 98.108012249038 Dec: -58.669689444389 [deg; J2000]
Catalogged Source?: NO
Point Source?: YES
GRB Indicated?: YES [ by BAT flight software ]
Image S/N Ratio: 11.03
Image Trigger?: NO
Rate S/N Ratio: 21.0475651798492 [ if not an image trigger ]
Image S/N Ratio: 11.03
Analysis Position: [ source = BAT ]
RA: 98.108012249038 Dec: -58.669689444389 [deg; J2000]
Refined Position: [ source = BAT pre-slew burst ]
RA: 98.1452289806442 Dec: -58.6881597941355 [deg; J2000]
{ 06h 32m 34.9s , -58d 41' 17.4" }
+/- 1.75106632086887 [arcmin] (estimated 90% radius based on SNR)
+/- 0.887388504858632 [arcmin] (formal 1-sigma fit error)
SNR: 13.6629111498022
Angular difference between the analysis and refined position is 1.604864 arcmin
Partial Coding Fraction: 0.578125 [ including projection effects ]
Duration
T90: 2.17600005865097 +/- 0.455367963461657
Measured from: 0.0799999833106995
to: 2.25600004196167 [s; relative to TRIGTIME]
T50: 0.76800000667572 +/- 0.389625496896741
Measured from: 0.38400000333786
to: 1.15200001001358 [s; relative to TRIGTIME]
Fluence
Peak Flux (peak 1 second)
Measured from: 0.0360000133514404
to: 1.03600001335144 [s; relative to TRIGTIME]
Total Fluence
Measured from: 0.0320000052452087
to: 2.63999998569489 [s; relative to TRIGTIME]
Band 1 Band 2 Band 3 Band 4
15-25 25-50 50-100 100-350 keV
Total 0.106308 0.167052 0.100035 0.018681
0.015795 0.016757 0.014705 0.011871 [error]
Peak 0.061975 0.111926 0.072538 0.013629
0.010041 0.011422 0.010216 0.007738 [error]
[ fluence units of on-axis counts / fully illuminated detector ]
======================================================================
====== Table of the duration information =============================
Value tstart tstop
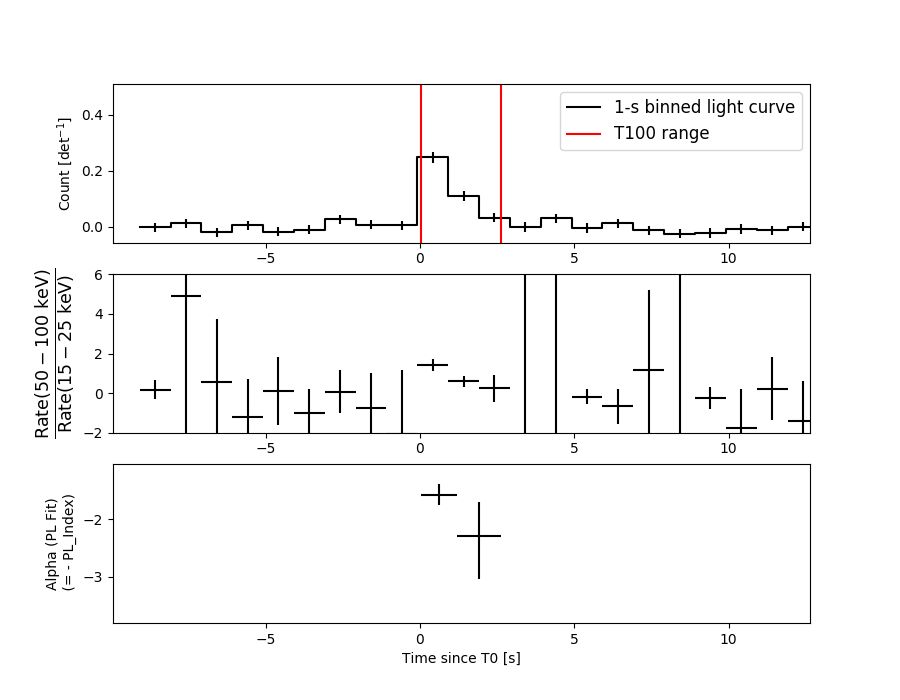
T100 2.608 0.032 2.640
T90 2.176 0.080 2.256
T50 0.768 0.384 1.152
Peak 1.000 0.036 1.036
====== Spectral Analysis Summary =====================================
Model : spectral model: simple power-law (PL) and cutoff power-law (CPL)
Ph_index : photon index: E^{Ph_index}
Ph_90err : 90% error of the photon index
Epeak : Epeak in keV
Epeak_90err: 90% error of Epeak
Norm : normalization at 50 keV in both the PL model and CPL model
Nomr_90err : 90% error of the normalization
chi2 : Chi-Squared
dof : degree of freedo
=== Time-averaged spectral analysis ===
(Best model with acceptable fit: PL)
Model Ph_index Ph_90err_low Ph_90err_hi Epeak Epeak_90err_low Epeak_90err_hi Norm Nomr_90err_low Norm_90err_hi chi2 dof
PL -1.747 -0.208 0.201 - - - 1.00e-02 -1.33e-03 1.30e-03 54.040 57
CPL -1.043 -0.797 1.113 61.072 -17.040 -61.072 2.45e-02 -1.53e-02 7.84e-02 52.120 56
=== 1-s peak spectral analysis ===
(Best model with acceptable fit: N/A)
Model Ph_index Ph_90err_low Ph_90err_hi Epeak Epeak_90err_low Epeak_90err_hi Norm Nomr_90err_low Norm_90err_hi chi2 dof
PL -1.552 -0.199 0.196 - - - 1.79e-02 -2.27e-03 2.25e-03 74.750 57
CPL -0.796 -0.793 1.013 75.283 -22.152 -75.283 4.53e-02 -2.78e-02 1.15e-01 72.130 56
=== Fluence/Peak Flux Summary ===
Model Band1 Band2 Band3 Band4 Band5 Total
15-25 25-50 50-100 100-350 15-150 15-350 keV
Fluence PL 4.21e-08 6.66e-08 7.93e-08 1.84e-07 2.41e-07 3.72e-07 erg/cm2
90%_error_low -7.48e-09 -7.98e-09 -1.38e-08 -5.74e-08 -3.27e-08 -7.24e-08 erg/cm2
90%_error_hi 7.76e-09 7.97e-09 1.38e-08 7.21e-08 3.31e-08 8.36e-08 erg/cm2
Peak flux PL 7.72e-01 7.54e-01 5.14e-01 5.51e-01 2.26e+00 2.59e+00 ph/cm2/s
90%_error_low -1.47e-01 -9.60e-02 -8.08e-02 -1.53e-01 -2.79e-01 -3.19e-01 ph/cm2/s
90%_error_hi 1.54e-01 9.54e-02 8.02e-02 1.84e-01 2.79e-01 3.21e-01 ph/cm2/s
Fluence CPL 3.90e-08 7.26e-08 7.99e-08 6.37e-08 2.27e-07 2.55e-07 erg/cm2
90%_error_low -8.53e-09 -9.96e-09 -1.62e-08 -4.63e-08 -3.72e-08 -6.04e-08 erg/cm2
90%_error_hi 8.65e-09 1.15e-08 1.54e-08 1.41e-07 3.75e-08 1.53e-07 erg/cm2
Peak flux CPL 6.97e-01 8.23e-01 5.41e-01 2.40e-01 2.22e+00 2.30e+00 ph/cm2/s
90%_error_low -1.67e-01 -1.22e-01 -9.17e-02 -1.50e-01 -2.83e-01 -3.25e-01 ph/cm2/s
90%_error_hi 1.72e-01 1.29e-01 9.28e-02 3.46e-01 2.83e-01 3.99e-01 ph/cm2/s
======================================================================
Image
Pre-slew 15.0-350.0 keV image (Event data)
#   RAcent    DECcent   POSerr    Theta     Phi              Peak Cts       SNR   Name
   98.1452   -58.6882   0.0141    39.5736    -2.2116         0.4073248     13.663 TRIG_00796469

Foreground time interval of the image:
  0.032   2.640 (delta_t =   2.608 [sec])
Background time interval of the image:
-239.088   0.032 (delta_t = 239.120 [sec])
Light Curves
Note: The mask-weighted lightcurves have units of either count/det or counts/sec/det, where a det is 0.4 x 0.4 = 0.16 sq cm.
Full-time range; 1 s binning
Other quick-look light curves:
- 64 ms binning (zoomed)
- 16 ms binning (zoomed)
- 8 ms binning (zoomed)
- 2 ms binning (zoomed)
- SN=5 or 10 s binning (full-time range)
- Raw light curve
Spectra
- 64 ms binning (zoomed)
- 16 ms binning (zoomed)
- 8 ms binning (zoomed)
- 2 ms binning (zoomed)
- SN=5 or 10 s binning (full-time range)
- Raw light curve
Spectra
Notes:
- 1) The fitting includes the systematic errors.
- 2) When the burst includes telescope slew time periods, the fitting uses an average response file made from multiple 5-s response files through out the slew time plus single time preiod for the non-slew times, and weighted by the total counts in the corresponding time period using addrmf. An average response file is needed becuase a spectral fit using the pre-slew DRM will introduce some errors in both a spectral shape and a normalization if the PHA file contains a lot of the slew/post-slew time interval.
- 3) For fits to more complicated models (e.g. a power-law over a cutoff power-law), the BAT team has decided to require a chi-square improvement of more than 6 for each extra dof.
Time averaged spectrum fit using the average DRM
Power-law model
Time interval is from    0.032 sec. to    2.640 sec.

Spectral model in power-law:
------------------------------------------------------------
Parameters  : value       lower 90%   higher 90%
Photon index: -1.74744     ( -0.208255   0.200938 )
Norm@50keV  : 1.00223E-02    ( -0.00132557   0.00130467 )
------------------------------------------------------------
#Fit statistic : Chi-Squared =          54.04 using 59 PHA bins.
# Reduced chi-squared =         0.9481 for     57 degrees of freedom
# Null hypothesis probability =   5.867262e-01

Photon flux (15-150 keV)    in 2.608 sec: 1.35397 ( -0.16329  0.16345 ) ph/cm2/s
Energy fluence (15-150 keV)             : 2.41261e-07 ( -3.26887e-08  3.30966e-08 ) ergs/cm2
Cutoff power-law model
Time interval is from    0.032 sec. to    2.640 sec.
Spectral model in the cutoff power-law:
------------------------------------------------------------
Parameters  : value       lower 90%   higher 90%
Photon index: -1.0428     ( -0.79733   1.11293 )
Epeak [keV] : 61.0718      ( -17.0392 -61.0712 )
Norm@50keV  : 2.45209E-02    ( -0.0153326   0.0783989 )
------------------------------------------------------------
#Fit statistic : Chi-Squared =          52.12 using 59 PHA bins.
# Reduced chi-squared =         0.9307 for     56 degrees of freedom
# Null hypothesis probability =   6.226159e-01

Photon flux (15-150 keV)    in 2.608 sec: 1.32288 ( -0.16861  0.16814 ) ph/cm2/s
Energy fluence (15-150 keV)             : 2.27226e-07 ( -3.7237e-08  3.74522e-08 ) ergs/cm2
1-s peak spectrum fit
Power-law model
Time interval is from    0.036 sec. to    1.036 sec.

Spectral model in power-law:
------------------------------------------------------------
Parameters  : value       lower 90%   higher 90%
Photon index: -1.55197     ( -0.199384   0.195765 )
Norm@50keV  : 1.78537E-02    ( -0.00226748   0.0022499 )
------------------------------------------------------------
#Fit statistic : Chi-Squared =          74.75 using 59 PHA bins.
# Reduced chi-squared =          1.311 for     57 degrees of freedom
# Null hypothesis probability =   5.738340e-02

Photon flux (15-150 keV)    in 1 sec: 2.26154 ( -0.27859  0.27887 ) ph/cm2/s
Energy fluence (15-150 keV)             : 1.68051e-07 ( -2.28666e-08  2.30927e-08 ) ergs/cm2
Cutoff power-law model
Time interval is from    0.036 sec. to    1.036 sec.
Spectral model in the cutoff power-law:
------------------------------------------------------------
Parameters  : value       lower 90%   higher 90%
Photon index: -0.795935     ( -0.793333   1.01312 )
Epeak [keV] : 75.2830      ( -22.1524 -75.2834 )
Norm@50keV  : 4.52688E-02    ( -0.0277997   0.114592 )
------------------------------------------------------------
#Fit statistic : Chi-Squared =          72.13 using 59 PHA bins.
# Reduced chi-squared =          1.288 for     56 degrees of freedom
# Null hypothesis probability =   7.218848e-02

Photon flux (15-150 keV)    in 1 sec: 2.21705 ( -0.28313  0.28311 ) ph/cm2/s
Energy fluence (15-150 keV)             : 1.59071e-07 ( -2.54884e-08  2.52862e-08 ) ergs/cm2
Time-resolved spectra
Distribution
T90 vs. Hardness ratio plot
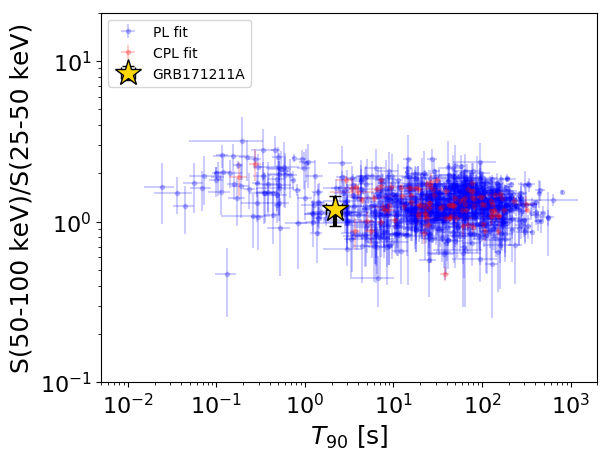
T90                                   = 2.176 sec.
Hardness ratio (energy fluence ratio) = 1.19135149978
S(15-50 keV) vs. S(50-150 keV) plot
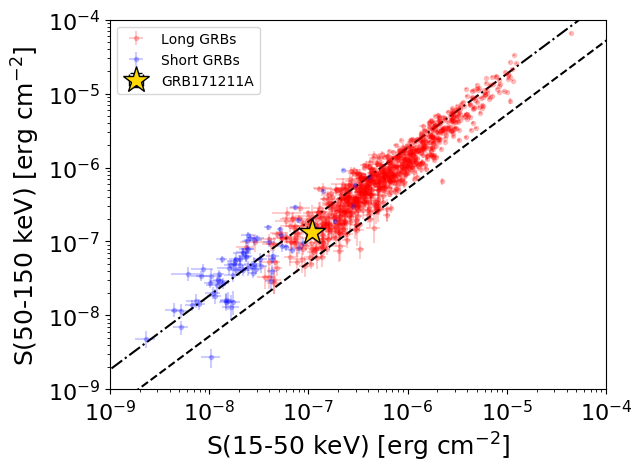
S(15-50 keV)  = 1.0869383e-07
S(50-150 keV) = 1.3256519e-07
The dash-dotted line and the dashed line traces the fluences calculated from the Band function with Epeak = 15 and 150 keV, respectively. Both lines assume a canonical values of alpha = -1 and beta = -2.5.
Mask shadow pattern
IMX = 8.258796853203473E-01, IMY = 3.189422191671311E-02
Spacecraft aspect plot
Bright source in the pre-burst/pre-slew/post-slew images
Pre-burst image of 15-350 keV band
Time interval of the image:
-239.088000 0.032000

# RAcent  DECcent POSerr Theta    Phi  PeakCts   SNR AngSep     Name
#  [deg]    [deg]    ['] [deg]  [deg]                   [']
135.6431 -40.4459    3.2  10.4  -18.8   0.8357   3.6    8.4	Vela X-1
170.3663 -60.5596  262.3  36.4  -60.0   0.0206   0.0    4.1	Cen X-3
156.9738   6.3927    2.7  40.6  172.8   1.7327   4.3 ------	UNKNOWN
 66.3645 -64.9835    3.4  55.5   -5.3   2.6847   3.4 ------	UNKNOWN
178.3628 -19.3475    3.0  36.9 -133.1   1.4442   3.9 ------	UNKNOWN
 55.4301 -81.0907    4.4  58.9  -24.4   4.4290   2.6 ------	UNKNOWN
160.7376 -80.4555    3.0  50.7  -39.2   3.8316   3.8 ------	UNKNOWN
Pre-slew background subtracted image of 15-350 keV band
Time interval of the image:
0.032000 2.640000

# RAcent  DECcent POSerr Theta    Phi  PeakCts   SNR AngSep     Name
#  [deg]    [deg]    ['] [deg]  [deg]                   [']
135.2809 -40.5579   12.0  10.6  -17.6   0.0190   1.0   11.3	Vela X-1
170.1234 -60.6865   13.3  36.4  -59.7   0.0336   0.9    6.8	Cen X-3
163.7685  17.1835    2.3  53.2  174.8   0.3951   4.9 ------	UNKNOWN
 98.1452 -58.6882    0.8  39.6   -2.2   0.4108  13.8 ------	UNKNOWN
Post-slew image of 15-350 keV band
Time interval of the image:
76.012600 963.022000

# RAcent  DECcent POSerr Theta    Phi  PeakCts   SNR AngSep     Name
#  [deg]    [deg]    ['] [deg]  [deg]                   [']
135.4983 -40.5397    1.6  29.7  177.1   4.0406   7.0    1.6	Vela X-1
170.0188 -60.7266    0.0  34.5 -127.0  -0.9402  -1.0   10.7	Cen X-3
186.6134 -62.7451    3.9  40.0 -117.2   4.4931   3.0    1.9	GX 301-2
 49.1435 -24.0043    3.0  48.7   41.8   8.6229   3.9 ------	UNKNOWN
 37.4178 -42.7367    2.9  39.9   14.1   3.0818   4.0 ------	UNKNOWN
159.1368 -21.5479    2.3  56.8 -175.2  12.8193   4.9 ------	UNKNOWN
  6.9734 -59.6162    3.5  43.0  -23.9   2.8882   3.3 ------	UNKNOWN
311.4731 -75.1433    2.8  44.4  -60.2  11.5840   4.1 ------	UNKNOWN
287.2363 -78.6973    2.3  42.5  -69.2  12.1680   5.1 ------	UNKNOWN