Analysis Summary
Notes:
- 1) No attempt has been made to eliminate the non-significant decimal places.
- 2) This batgrbproduct analysis is done using the HEASARC data.
- 3) This batgrbproduct analysis is using the flight position for the mask-weighting calculation.
======================================================================
                  BAT GRB EVENT DATA PROCESSING REPORT
    Process Script Ver: batgrbproduct v2.46
    Process Start Time: Sat Jan 20 04:34:52 EST 2018
             Host Name: bat1
   Current Working Dir: /local/data/bat1/alien/Swift_3rdBATcatalog/event/batevent_reproc/trigger797441
======================================================================

  Trigger: 00797441      Segment: 000

  BAT Trigger Time: 535086439.616   [s; MET]
      Trigger Stop: 535086442.688   [s; MET]
               UTC: 2017-12-16T03:06:59.453420    [includes UTCF correction]
       Where From?: TDRSS position message

  BAT
    RA: 212.077708008229   Dec: -50.4731225924403  [deg; J2000]

     Catalogged Source?: NO
     Point Source?:      YES
     GRB Indicated?:     YES    [ by BAT flight software ]
     Image S/N Ratio:    7.36
     Image Trigger?:     NO
     Rate S/N Ratio:     11.0453610171873  [ if not an image trigger ]
     Image S/N Ratio:    7.36

  Analysis Position:   [ source = BAT ]
    RA: 212.077708008229   Dec: -50.4731225924403  [deg; J2000]

  Refined Position:   [ source = BAT pre-slew burst ]
    RA: 212.011878272288   Dec: -50.5004876854903  [deg; J2000]
        { 14h 08m 02.9s , -50d 30' 01.8" }
         +/- 2.04792142123002 [arcmin] (estimated 90% radius based on SNR)
         +/- 0.955429769702781 [arcmin] (formal 1-sigma fit error)
    SNR: 10.9240859972308

  Angular difference between the analysis and refined position is 3.001898 arcmin

  Partial Coding Fraction: 0.6328125    [ including projection effects ]

  Duration
     T90: 30.0799999833107 +/- 7.58609250805119
        Measured from: 0.512000024318695
                   to: 30.5920000076294     [s; relative to TRIGTIME]
     T50: 13.5680000185966 +/- 8.56674121394851
        Measured from: 3.13599997758865
                   to: 16.7039999961853     [s; relative to TRIGTIME]


  Fluence
     Peak Flux  (peak 1 second)
        Measured from: 3.05199998617172
                   to: 4.05199998617172     [s; relative to TRIGTIME]
     Total Fluence
        Measured from: -0.448000013828278
                   to: 33.472000002861     [s; relative to TRIGTIME]

             Band 1     Band 2     Band 3     Band 4
              15-25      25-50     50-100    100-350     keV
 Total     0.216839   0.360026   0.193977  -0.000015
           0.047833   0.049652   0.043309   0.038180 [error]
 Peak      0.019916   0.041961   0.026737   0.008999
           0.008525   0.008997   0.007740   0.006629 [error]

     [ fluence units of on-axis counts / fully illuminated detector ]

======================================================================


====== Table of the duration information =============================

        Value   tstart    tstop
T100   33.920   -0.448   33.472
T90    30.080    0.512   30.592
T50    13.568    3.136   16.704
Peak    1.000    3.052    4.052


====== Spectral Analysis Summary =====================================

Model      : spectral model: simple power-law (PL) and cutoff power-law (CPL)
Ph_index   : photon index: E^{Ph_index}
Ph_90err   : 90% error of the photon index
Epeak      : Epeak in keV
Epeak_90err: 90% error of Epeak
Norm       : normalization at 50 keV in both the PL model and CPL model
Nomr_90err : 90% error of the normalization
chi2       : Chi-Squared
dof        : degree of freedo

=== Time-averaged spectral analysis ===
(Best model with acceptable fit: N/A)

Model Ph_index Ph_90err_low Ph_90err_hi  Epeak  Epeak_90err_low  Epeak_90err_hi  Norm       Nomr_90err_low    Norm_90err_hi    chi2    dof
PL      -1.629    -0.303      0.294       -           -               -         1.52e-03     -2.98e-04          2.93e-04      72.040   57
CPL     -0.470    -1.260      1.954       57.393     -16.519       -57.393      6.85e-03     -6.85e-03          8.94e-02      69.710   56


=== 1-s peak spectral analysis ===
(Best model with acceptable fit: PL)

Model Ph_index Ph_90err_low Ph_90err_hi  Epeak  Epeak_90err_low  Epeak_90err_hi  Norm       Nomr_90err_low    Norm_90err_hi    chi2    dof
PL      -1.329     -0.431     0.443       -           -               -         6.90e-03     -1.71e-03          1.71e-03      44.980   57
CPL     -1.274      N/A       N/A         691.570      N/A           N/A         7.35e-03        N/A               N/A         44.970   56


=== Fluence/Peak Flux Summary ===

              Model    Band1     Band2     Band3     Band4     Band5     Total
                       15-25     25-50    50-100    100-350    15-150    15-350    keV
Fluence         PL   7.46e-08  1.27e-07  1.64e-07  4.27e-07  4.82e-07  7.92e-07   erg/cm2
      90%_error_low -1.95e-08 -2.29e-08 -4.13e-08 -1.83e-07 -9.90e-08 -2.30e-07   erg/cm2
      90%_error_hi   2.06e-08  2.28e-08  4.18e-08  2.58e-07  1.01e-07  2.90e-07   erg/cm2
Peak flux       PL   2.41e-01  2.69e-01  2.14e-01  2.82e-01  8.28e-01  1.01e+00   ph/cm2/s
      90%_error_low -1.03e-01 -7.77e-02 -6.34e-02 -1.41e-01 -2.12e-01 -2.53e-01   ph/cm2/s
      90%_error_hi   1.17e-01  7.50e-02  6.17e-02  2.09e-01  2.13e-01  2.58e-01   ph/cm2/s

Fluence        CPL   6.68e-08  1.46e-07  1.61e-07  8.19e-08  4.30e-07  4.55e-07   erg/cm2
      90%_error_low -2.20e-08 -3.15e-08 -5.82e-08 -7.27e-08 -1.07e-07 -1.31e-07   erg/cm2
      90%_error_hi   2.26e-08  3.46e-08  4.94e-08  4.12e-07  1.16e-07  4.31e-07   erg/cm2
Peak flux      CPL   2.39e-01  2.70e-01  2.15e-01  2.64e-01  8.27e-01  9.88e-01   ph/cm2/s
      90%_error_low -6.68e-02 -7.89e-02 -6.10e-02 -2.64e-01 -2.16e-01 -3.42e-01   ph/cm2/s
      90%_error_hi   1.00e-01  9.20e-02  7.07e-02  1.42e-01  2.14e-01  2.70e-01   ph/cm2/s

======================================================================
Image
Pre-slew 15.0-350.0 keV image (Event data)
#   RAcent    DECcent   POSerr    Theta     Phi              Peak Cts       SNR   Name
  212.0119   -50.5005   0.0176    29.3610   -43.2583         1.0249326     10.924 TRIG_00797441

Foreground time interval of the image:
 -0.448  33.472 (delta_t =  33.920 [sec])
Background time interval of the image:
-239.616  -0.448 (delta_t = 239.168 [sec])
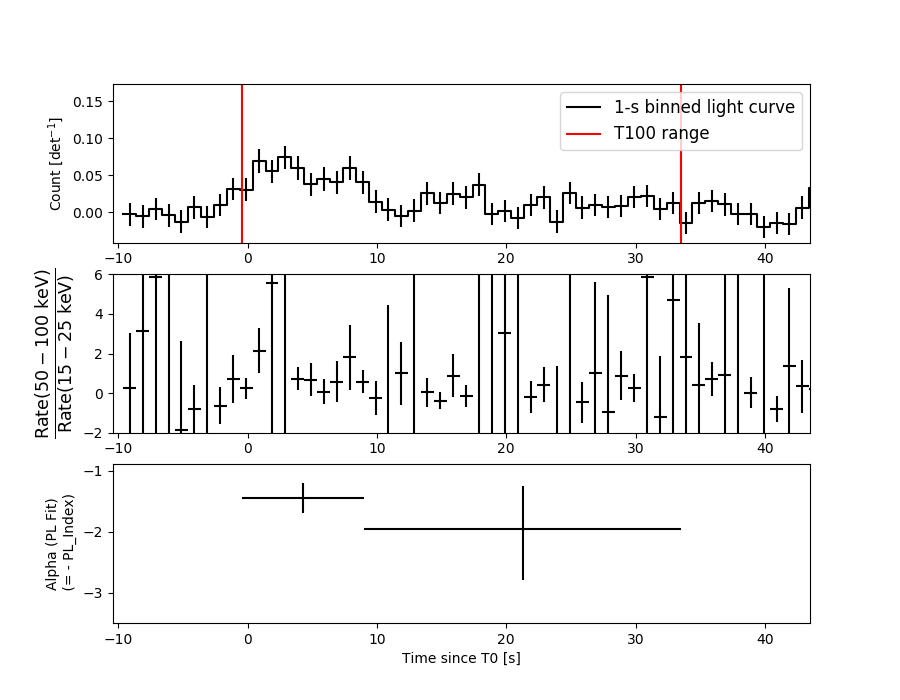
Light Curves
Note: The mask-weighted lightcurves have units of either count/det or counts/sec/det, where a det is 0.4 x 0.4 = 0.16 sq cm.
Full-time range; 1 s binning
Other quick-look light curves:
- 64 ms binning (zoomed)
- 16 ms binning (zoomed)
- 8 ms binning (zoomed)
- 2 ms binning (zoomed)
- SN=5 or 10 s binning (full-time range)
- Raw light curve
Spectra
- 64 ms binning (zoomed)
- 16 ms binning (zoomed)
- 8 ms binning (zoomed)
- 2 ms binning (zoomed)
- SN=5 or 10 s binning (full-time range)
- Raw light curve
Spectra
Notes:
- 1) The fitting includes the systematic errors.
- 2) When the burst includes telescope slew time periods, the fitting uses an average response file made from multiple 5-s response files through out the slew time plus single time preiod for the non-slew times, and weighted by the total counts in the corresponding time period using addrmf. An average response file is needed becuase a spectral fit using the pre-slew DRM will introduce some errors in both a spectral shape and a normalization if the PHA file contains a lot of the slew/post-slew time interval.
- 3) For fits to more complicated models (e.g. a power-law over a cutoff power-law), the BAT team has decided to require a chi-square improvement of more than 6 for each extra dof.
Time averaged spectrum fit using the average DRM
Power-law model
Time interval is from   -0.448 sec. to   33.472 sec.

Spectral model in power-law:
------------------------------------------------------------
Parameters  : value       lower 90%   higher 90%
Photon index: -1.62908     ( -0.30338   0.294304 )
Norm@50keV  : 1.52475E-03    ( -0.000298445   0.000293299 )
------------------------------------------------------------
#Fit statistic : Chi-Squared =          72.04 using 59 PHA bins.
# Reduced chi-squared =          1.264 for     57 degrees of freedom
# Null hypothesis probability =   8.661893e-02

Photon flux (15-150 keV)    in 33.92 sec: 0.197750 ( -0.035553  0.035582 ) ph/cm2/s
Energy fluence (15-150 keV)             : 4.82142e-07 ( -9.89684e-08  1.01418e-07 ) ergs/cm2
Cutoff power-law model
Time interval is from   -0.448 sec. to   33.472 sec.
Spectral model in the cutoff power-law:
------------------------------------------------------------
Parameters  : value       lower 90%   higher 90%
Photon index: -0.469803     ( -1.26071   1.95332 )
Epeak [keV] : 57.3932      ( -16.4915 -57.3661 )
Norm@50keV  : 6.84600E-03    ( -0.00685965   0.0893666 )
------------------------------------------------------------
#Fit statistic : Chi-Squared =          69.71 using 59 PHA bins.
# Reduced chi-squared =          1.245 for     56 degrees of freedom
# Null hypothesis probability =   1.030794e-01

Photon flux (15-150 keV)    in 33.92 sec: 0.190494 ( -0.036337  0.036476 ) ph/cm2/s
Energy fluence (15-150 keV)             : 4.29929e-07 ( -1.07388e-07  1.16376e-07 ) ergs/cm2
1-s peak spectrum fit
Power-law model
Time interval is from    3.052 sec. to    4.052 sec.

Spectral model in power-law:
------------------------------------------------------------
Parameters  : value       lower 90%   higher 90%
Photon index: -1.3286     ( -0.431147   0.442857 )
Norm@50keV  : 6.90201E-03    ( -0.00171046   0.00170867 )
------------------------------------------------------------
#Fit statistic : Chi-Squared =          44.98 using 59 PHA bins.
# Reduced chi-squared =         0.7891 for     57 degrees of freedom
# Null hypothesis probability =   8.755156e-01

Photon flux (15-150 keV)    in 1 sec: 0.827934 ( -0.211893  0.213056 ) ph/cm2/s
Energy fluence (15-150 keV)             : 6.77485e-08 ( -1.82548e-08  1.85076e-08 ) ergs/cm2
Cutoff power-law model

Time interval is from    3.052 sec. to    4.052 sec.
Spectral model in the cutoff power-law:
------------------------------------------------------------
Parameters  : value       lower 90%   higher 90%
Photon index: -1.27411     (       )
Epeak [keV] : 691.570      (   )
Norm@50keV  : 7.34746E-03    (     )
------------------------------------------------------------
#Fit statistic : Chi-Squared =          44.97 using 59 PHA bins.
# Reduced chi-squared =         0.8031 for     56 degrees of freedom
# Null hypothesis probability =   8.543107e-01

Photon flux (15-150 keV)    in 1 sec: 0.826529 ( -0.216049  0.213971 ) ph/cm2/s
Energy fluence (15-150 keV)             : 6.75274e-08 ( -2.00092e-08  1.86295e-08 ) ergs/cm2
Time-resolved spectra
Distribution
T90 vs. Hardness ratio plot
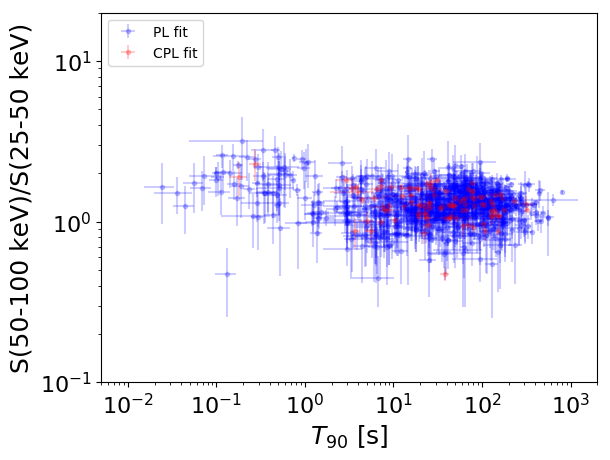
T90                                   = N/A sec.
Hardness ratio (energy fluence ratio) = N/A
S(15-50 keV) vs. S(50-150 keV) plot
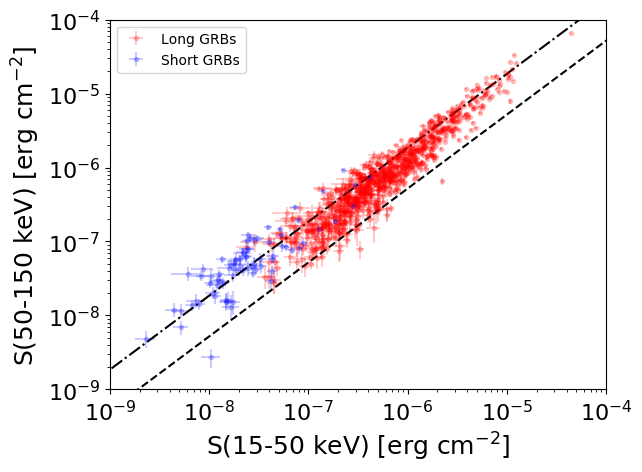
S(15-50 keV)  = N/A
S(50-150 keV) = N/A
The dash-dotted line and the dashed line traces the fluences calculated from the Band function with Epeak = 15 and 150 keV, respectively. Both lines assume a canonical values of alpha = -1 and beta = -2.5.
Mask shadow pattern
IMX = 4.097064735497584E-01, IMY = 3.855257781302184E-01
Spacecraft aspect plot
Bright source in the pre-burst/pre-slew/post-slew images
Pre-burst image of 15-350 keV band
Time interval of the image:
-239.616000 -0.448000

# RAcent  DECcent POSerr Theta    Phi  PeakCts   SNR AngSep     Name
#  [deg]    [deg]    ['] [deg]  [deg]                   [']
170.3406 -60.5740    4.7  41.7   -4.6   0.9673   2.5    3.0	Cen X-3
186.4026 -62.7308    5.3  40.0  -16.4   0.7298   2.2    7.4	GX 301-2
139.9052 -54.9135    2.7  52.6   13.4   3.4357   4.2 ------	UNKNOWN
197.1537 -66.3785    2.8  43.0  -24.1   1.6340   4.1 ------	UNKNOWN
217.5565 -43.0680    3.1  25.7  -59.6   1.1641   3.7 ------	UNKNOWN
242.8041   6.1542    2.5  53.2 -142.3   6.5132   4.6 ------	UNKNOWN
240.6215 -63.1077    2.4  48.9  -48.5   6.2118   4.8 ------	UNKNOWN
Pre-slew background subtracted image of 15-350 keV band
Time interval of the image:
-0.448000 33.472000

# RAcent  DECcent POSerr Theta    Phi  PeakCts   SNR AngSep     Name
#  [deg]    [deg]    ['] [deg]  [deg]                   [']
170.6535 -60.6153   18.0  41.6   -4.8   0.0725   0.6   10.0	Cen X-3
186.3629 -62.7528    4.6  40.1  -16.4  -0.2605  -2.5    8.1	GX 301-2
212.0119 -50.5005    1.1  29.4  -43.3   1.0250  10.9 ------	UNKNOWN
227.5349 -37.4041    2.3  29.3  -78.7   0.6116   5.0 ------	UNKNOWN
241.4817 -41.7288    2.5  40.8  -76.8   1.3675   4.5 ------	UNKNOWN
Post-slew image of 15-350 keV band
Time interval of the image:
103.884600 962.494000

# RAcent  DECcent POSerr Theta    Phi  PeakCts   SNR AngSep     Name
#  [deg]    [deg]    ['] [deg]  [deg]                   [']
170.2292 -60.4951    4.9  25.2   65.2   2.1542   2.3    8.1	Cen X-3
186.3570 -62.6599  152.6  18.5   53.7   0.0538   0.1   10.6	GX 301-2
244.9640 -15.6605    0.7  43.7 -116.2  49.5358  15.8    1.5	Sco X-1
255.9916 -37.8396    1.6  33.3  -80.4  10.3952   7.4    0.4	4U 1700-377
256.3980 -36.4827    4.1  34.4  -82.0   4.3136   2.8    4.0	GX 349+2
264.7177 -44.6233   26.0  35.2  -64.0  -0.5425  -0.4   10.5	4U 1735-44
262.9902 -33.8368  116.7  40.3  -79.8   0.2946   0.1    0.1	GX 354-0
172.4697 -21.6622    2.9  42.3  132.9   8.3484   3.9 ------	UNKNOWN
255.3108 -68.3497    2.6  27.4  -18.7   3.1553   4.4 ------	UNKNOWN