Analysis Summary
Notes:
- 1) No attempt has been made to eliminate the non-significant decimal places.
- 2) This batgrbproduct analysis is done using the HEASARC data.
- 3) This batgrbproduct analysis is using the flight position for the mask-weighting calculation.
======================================================================
                  BAT GRB EVENT DATA PROCESSING REPORT
    Process Script Ver: batgrbproduct v2.46
    Process Start Time: Sat Jan 20 04:29:50 EST 2018
             Host Name: bat1
   Current Working Dir: /local/data/bat1/alien/Swift_3rdBATcatalog/event/batevent_reproc/trigger802999
======================================================================

  Trigger: 00802999      Segment: 000

  BAT Trigger Time: 536601004.544   [s; MET]
      Trigger Stop: 536601005.568   [s; MET]
               UTC: 2018-01-02T15:49:44.290400    [includes UTCF correction]
       Where From?: TDRSS position message

  BAT
    RA: 203.115129995838   Dec: 62.1481848328947  [deg; J2000]

     Catalogged Source?: NO
     Point Source?:      YES
     GRB Indicated?:     YES    [ by BAT flight software ]
     Image S/N Ratio:    7.37
     Image Trigger?:     NO
     Rate S/N Ratio:     11.8321595661992  [ if not an image trigger ]
     Image S/N Ratio:    7.37

  Analysis Position:   [ source = BAT ]
    RA: 203.115129995838   Dec: 62.1481848328947  [deg; J2000]

  Refined Position:   [ source = BAT pre-slew burst ]
    RA: 203.072733292129   Dec: 62.1649485998259  [deg; J2000]
        { 13h 32m 17.5s , +62d 09' 53.8" }
         +/- 1.4239082216829 [arcmin] (estimated 90% radius based on SNR)
         +/- 0.73411187751022 [arcmin] (formal 1-sigma fit error)
    SNR: 18.3593957443108

  Angular difference between the analysis and refined position is 1.556685 arcmin

  Partial Coding Fraction: 0.953125    [ including projection effects ]

  Duration
     T90: 11.5599999427795 +/- 1.73180249679767
        Measured from: -6.14000004529953
                   to: 5.41999989748001     [s; relative to TRIGTIME]
     T50: 3.91199994087219 +/- 1.9909956942061
        Measured from: -0.760000050067902
                   to: 3.15199989080429     [s; relative to TRIGTIME]


  Fluence
     Peak Flux  (peak 1 second)
        Measured from: 0.799999952316284
                   to: 1.79999995231628     [s; relative to TRIGTIME]
     Total Fluence
        Measured from: -7.6240000128746
                   to: 6.29999995231628     [s; relative to TRIGTIME]

             Band 1     Band 2     Band 3     Band 4
              15-25      25-50     50-100    100-350     keV
 Total     0.263254   0.264324   0.124075   0.037290
           0.020722   0.021600   0.018211   0.014879 [error]
 Peak      0.029316   0.045216   0.040163   0.010334
           0.005642   0.006081   0.005437   0.004248 [error]

     [ fluence units of on-axis counts / fully illuminated detector ]

======================================================================


====== Table of the duration information =============================

        Value   tstart    tstop
T100   13.924   -7.624    6.300
T90    11.560   -6.140    5.420
T50     3.912   -0.760    3.152
Peak    1.000    0.800    1.800


====== Spectral Analysis Summary =====================================

Model      : spectral model: simple power-law (PL) and cutoff power-law (CPL)
Ph_index   : photon index: E^{Ph_index}
Ph_90err   : 90% error of the photon index
Epeak      : Epeak in keV
Epeak_90err: 90% error of Epeak
Norm       : normalization at 50 keV in both the PL model and CPL model
Nomr_90err : 90% error of the normalization
chi2       : Chi-Squared
dof        : degree of freedo

=== Time-averaged spectral analysis ===
(Best model with acceptable fit: PL)

Model Ph_index Ph_90err_low Ph_90err_hi  Epeak  Epeak_90err_low  Epeak_90err_hi  Norm       Nomr_90err_low    Norm_90err_hi    chi2    dof
PL      -2.025    -0.192      0.182       -           -               -         2.71e-03     -3.34e-04          3.26e-04      48.630   57
CPL     -1.996    -0.021      0.736        4.565      -3.902        -4.565      2.83e-03     -1.45e-03          5.37e-04      48.630   56


=== 1-s peak spectral analysis ===
(Best model with acceptable fit: PL)

Model Ph_index Ph_90err_low Ph_90err_hi  Epeak  Epeak_90err_low  Epeak_90err_hi  Norm       Nomr_90err_low    Norm_90err_hi    chi2    dof
PL      -1.521     -0.253     0.244       -           -               -         7.85e-03     -1.19e-03          1.17e-03      52.240   57
CPL     -0.813     -0.885     1.368       83.214     -27.975       -83.214      1.80e-02     -1.10e-02          6.60e-02      51.000   56


=== Fluence/Peak Flux Summary ===

              Model    Band1     Band2     Band3     Band4     Band5     Total
                       15-25     25-50    50-100    100-350    15-150    15-350    keV
Fluence         PL   7.90e-08  1.06e-07  1.04e-07  1.83e-07  3.48e-07  4.72e-07   erg/cm2
      90%_error_low -1.05e-08 -9.91e-09 -1.75e-08 -5.50e-08 -3.94e-08 -7.56e-08   erg/cm2
      90%_error_hi   1.08e-08  9.89e-09  1.79e-08  6.91e-08  4.02e-08  8.65e-08   erg/cm2
Peak flux       PL   3.30e-01  3.28e-01  2.28e-01  2.52e-01  9.86e-01  1.14e+00   ph/cm2/s
      90%_error_low -7.42e-02 -4.83e-02 -4.43e-02 -8.62e-02 -1.40e-01 -1.66e-01   ph/cm2/s
      90%_error_hi   7.86e-02  4.79e-02  4.38e-02  1.09e-01  1.40e-01  1.69e-01   ph/cm2/s

Fluence        CPL   7.81e-08  1.06e-07  1.06e-07  1.81e-07  3.47e-07  4.58e-07   erg/cm2
      90%_error_low -8.57e-09 -9.70e-09 -9.77e-09    N/A    -4.30e-08    N/A      erg/cm2
      90%_error_hi   7.19e-09  9.90e-09  1.62e-08    N/A     4.25e-08    N/A      erg/cm2
Peak flux      CPL   2.91e-01  3.50e-01  2.41e-01  1.21e-01  9.58e-01  1.00e+00   ph/cm2/s
      90%_error_low -9.66e-02 -5.88e-02 -4.97e-02 -1.21e-01 -1.49e-01 -1.78e-01   ph/cm2/s
      90%_error_hi   9.65e-02  6.15e-02  5.18e-02  1.64e-01  1.47e-01  2.33e-01   ph/cm2/s

======================================================================
Image
Pre-slew 15.0-350.0 keV image (Event data)
#   RAcent    DECcent   POSerr    Theta     Phi              Peak Cts       SNR   Name
  203.0727    62.1649   0.0105    18.9583   -34.2114         0.7200210     18.359 TRIG_00802999

Foreground time interval of the image:
 -7.624   6.300 (delta_t =  13.924 [sec])
Background time interval of the image:
-110.043  -7.624 (delta_t = 102.419 [sec])
Light Curves
Note: The mask-weighted lightcurves have units of either count/det or counts/sec/det, where a det is 0.4 x 0.4 = 0.16 sq cm.
Full-time range; 1 s binning
Other quick-look light curves:
- 64 ms binning (zoomed)
- 16 ms binning (zoomed)
- 8 ms binning (zoomed)
- 2 ms binning (zoomed)
- SN=5 or 10 s binning (full-time range)
- Raw light curve
Spectra
- 64 ms binning (zoomed)
- 16 ms binning (zoomed)
- 8 ms binning (zoomed)
- 2 ms binning (zoomed)
- SN=5 or 10 s binning (full-time range)
- Raw light curve
Spectra
Notes:
- 1) The fitting includes the systematic errors.
- 2) When the burst includes telescope slew time periods, the fitting uses an average response file made from multiple 5-s response files through out the slew time plus single time preiod for the non-slew times, and weighted by the total counts in the corresponding time period using addrmf. An average response file is needed becuase a spectral fit using the pre-slew DRM will introduce some errors in both a spectral shape and a normalization if the PHA file contains a lot of the slew/post-slew time interval.
- 3) For fits to more complicated models (e.g. a power-law over a cutoff power-law), the BAT team has decided to require a chi-square improvement of more than 6 for each extra dof.
Time averaged spectrum fit using the average DRM
Power-law model

Time interval is from   -7.624 sec. to    6.300 sec.

Spectral model in power-law:
------------------------------------------------------------
Parameters  : value       lower 90%   higher 90%
Photon index: -2.02506     ( -0.191832   0.182099 )
Norm@50keV  : 2.70961E-03    ( -0.000334193   0.000325788 )
------------------------------------------------------------
#Fit statistic : Chi-Squared =          48.63 using 59 PHA bins.
# Reduced chi-squared =         0.8532 for     57 degrees of freedom
# Null hypothesis probability =   7.771831e-01

Photon flux (15-150 keV)    in 13.92 sec: 0.411228 ( -0.038234  0.038247 ) ph/cm2/s
Energy fluence (15-150 keV)             : 3.48401e-07 ( -3.93506e-08  4.02138e-08 ) ergs/cm2
Cutoff power-law model
Time interval is from   -7.624 sec. to    6.300 sec.
Spectral model in the cutoff power-law:
------------------------------------------------------------
Parameters  : value       lower 90%   higher 90%
Photon index: -1.99643     ( -0.0207833   0.736349 )
Epeak [keV] : 4.56510      ( -3.91837 -4.58097 )
Norm@50keV  : 2.82571E-03    ( -0.00144537   0.000537473 )
------------------------------------------------------------
#Fit statistic : Chi-Squared =          48.63 using 59 PHA bins.
# Reduced chi-squared =         0.8684 for     56 degrees of freedom
# Null hypothesis probability =   7.472946e-01

Photon flux (15-150 keV)    in 13.92 sec: 0.410879 ( -0.038083  0.039528 ) ph/cm2/s
Energy fluence (15-150 keV)             : 3.47279e-07 ( -4.29948e-08  4.24918e-08 ) ergs/cm2
1-s peak spectrum fit
Power-law model
Time interval is from    0.800 sec. to    1.800 sec.

Spectral model in power-law:
------------------------------------------------------------
Parameters  : value       lower 90%   higher 90%
Photon index: -1.52103     ( -0.252703   0.24401 )
Norm@50keV  : 7.85258E-03    ( -0.00119235   0.00117432 )
------------------------------------------------------------
#Fit statistic : Chi-Squared =          52.24 using 59 PHA bins.
# Reduced chi-squared =         0.9164 for     57 degrees of freedom
# Null hypothesis probability =   6.540353e-01

Photon flux (15-150 keV)    in 1 sec: 0.985985 ( -0.140313  0.140395 ) ph/cm2/s
Energy fluence (15-150 keV)             : 7.4254e-08 ( -1.23042e-08  1.25161e-08 ) ergs/cm2
Cutoff power-law model
Time interval is from    0.800 sec. to    1.800 sec.
Spectral model in the cutoff power-law:
------------------------------------------------------------
Parameters  : value       lower 90%   higher 90%
Photon index: -0.812526     ( -0.886143   1.36643 )
Epeak [keV] : 83.2136      ( -27.9261 -83.1649 )
Norm@50keV  : 1.80085E-02    ( -0.0110458   0.0660071 )
------------------------------------------------------------
#Fit statistic : Chi-Squared =          51.00 using 59 PHA bins.
# Reduced chi-squared =         0.9107 for     56 degrees of freedom
# Null hypothesis probability =   6.641112e-01

Photon flux (15-150 keV)    in 1 sec: 0.958220 ( -0.148557  0.14708 ) ph/cm2/s
Energy fluence (15-150 keV)             : 7.06822e-08 ( -1.31753e-08  1.36241e-08 ) ergs/cm2
Time-resolved spectra
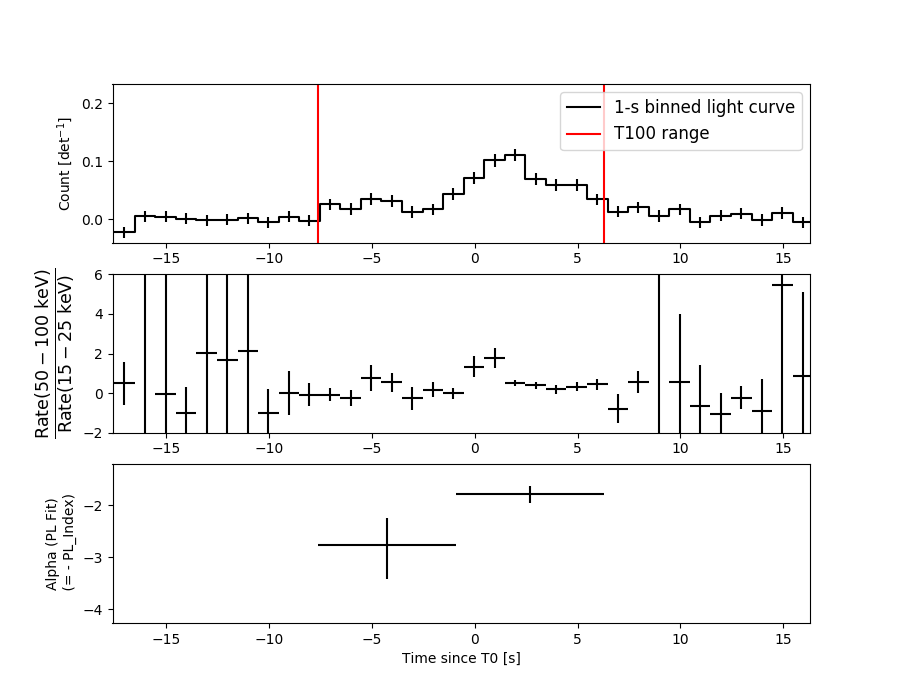
Distribution
T90 vs. Hardness ratio plot
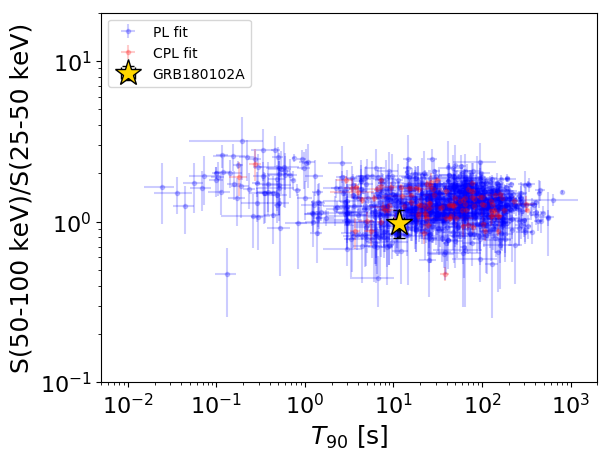
T90                                   = 11.56 sec.
Hardness ratio (energy fluence ratio) = 0.982811077096
S(15-50 keV) vs. S(50-150 keV) plot
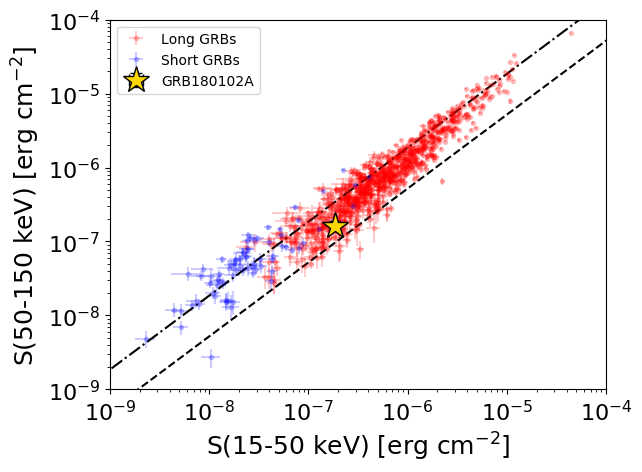
S(15-50 keV)  = 1.8467822e-07
S(50-150 keV) = 1.6372096e-07
The dash-dotted line and the dashed line traces the fluences calculated from the Band function with Epeak = 15 and 150 keV, respectively. Both lines assume a canonical values of alpha = -1 and beta = -2.5.
Mask shadow pattern
IMX = 2.840744469097226E-01, IMY = 1.931394477765271E-01
Spacecraft aspect plot
Bright source in the pre-burst/pre-slew/post-slew images
Pre-burst image of 15-350 keV band
Time interval of the image:
-110.043410 -7.624000

# RAcent  DECcent POSerr Theta    Phi  PeakCts   SNR AngSep     Name
#  [deg]    [deg]    ['] [deg]  [deg]                   [']
108.6720  43.7855    2.4  40.4   95.4   2.2722   4.8 ------	UNKNOWN
178.9957  21.4178    2.5  55.9   11.0   2.8836   4.5 ------	UNKNOWN
 40.9138  61.4276    0.4  37.5  165.5   5.4119  31.8 ------	UNKNOWN
 22.1058  60.2250    2.6  41.0  179.1   0.8581   4.4 ------	UNKNOWN
188.7344  50.7580    2.9  27.6   -6.2   0.4859   4.0 ------	UNKNOWN
303.4946  54.9941    2.9  45.4 -121.4   2.1298   4.0 ------	UNKNOWN
Pre-slew background subtracted image of 15-350 keV band
Time interval of the image:
-7.624000 6.300000

# RAcent  DECcent POSerr Theta    Phi  PeakCts   SNR AngSep     Name
#  [deg]    [deg]    ['] [deg]  [deg]                   [']
203.0727  62.1650    0.6  19.0  -34.2   0.7200  18.4 ------	UNKNOWN
Post-slew image of 15-350 keV band
Time interval of the image:
53.756590 962.518300

# RAcent  DECcent POSerr Theta    Phi  PeakCts   SNR AngSep     Name
#  [deg]    [deg]    ['] [deg]  [deg]                   [']
141.9733  53.7327    2.6  32.2   84.2   4.3054   4.5 ------	UNKNOWN
180.1553  25.3807    3.3  39.8   14.1   2.7561   3.5 ------	UNKNOWN
352.5341  58.6482    3.1  56.9  179.1  14.8431   3.7 ------	UNKNOWN