Analysis Summary
Notes:
- 1) No attempt has been made to eliminate the non-significant decimal places.
- 2) This batgrbproduct analysis is done using the HEASARC data.
- 3) This batgrbproduct analysis is using the flight position for the mask-weighting calculation.
==========================================================================
BAT GROUND-DETECTED GRB DATA PROCESSING REPORT
Process Script Ver: batgrbproduct v2.46
Process Start Time: Sat Jan 6 12:04:27 EST 2018
Host Name: bat1
Current Working Dir: /local/data/bat1/alien/Swift_3rdBATcatalog/event/ground_detect_bursts/scripts
======================================================================
Trigger: 00803066 Segment: 000
BAT Trigger Time: 536634529.6
UTC: 20180103T01:08:29.322 [includes UTCF correction]
Where From?: Ground analysis (best_duration.txt)
NOTE: BAT trigger time for ground-detected burst is the T100 start time.
Analysis Position: [ source = GCN ]
RA: 159.5821 Dec: -53.5580 [deg; J2000]
Refined Position: [ source = BAT pre-slew image ]
RA: 159.584768345 Dec: -53.5546840275 [deg; J2000]
{ 10h 38m 20.3s , -53d -33' -16.9" }
+/- 1.93960214195 [arcmin] (estimated 90% radius based on SNR)
SNR: 11.8074772924
Angular difference between the analysis and refined position is 0.220521 arcmin
Partial Coding Fraction: 0.3828125 [ including projection effects ]
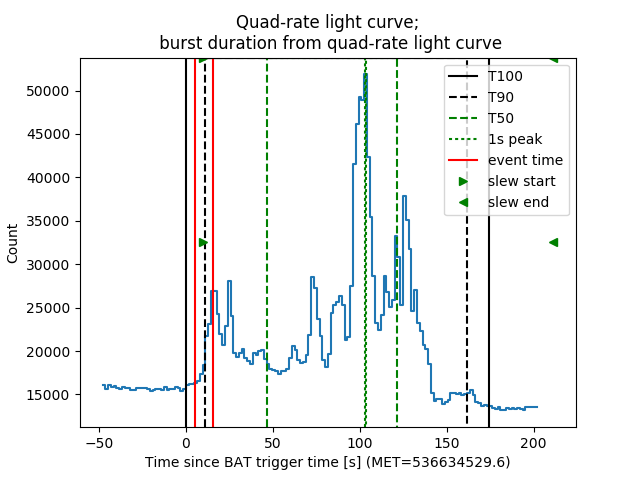
Duration
T90: 150.400000035763 +/- 1.6
Measured from: 11.2
to: 161.6 [s; relative to TRIGTIME]
T50: 75.2000000476837 +/- 1.6
Measured from: 46.4
to: 121.6 [s; relative to TRIGTIME]
====== Table of the duration information =============================
Value tstart tstop
T100 174.400 0.000 174.400
T90 150.400 11.200 161.600
T50 75.200 46.400 121.600
Peak 1.000 102.700 103.700
====== Spectral Analysis Summary =====================================
Model : spectral model: simple power-law (PL) and cutoff power-law (CPL)
Ph_index : photon index: E^{Ph_index}
Ph_90err : 90% error of the photon index
Epeak : Epeak in keV
Epeak_90err: 90% error of Epeak
Norm : normalization at 50 keV in both the PL model and CPL model
Nomr_90err : 90% error of the normalization
chi2 : Chi-Squared
dof : degree of freedo
=== Time-averaged spectral analysis ===
(Best model with acceptable fit: PL)
Model Ph_index Ph_90err_low Ph_90err_hi Epeak Epeak_90err_low Epeak_90err_hi Norm Nomr_90err_low Norm_90err_hi chi2 dof
PL -1.395 -0.079 0.079 - - - 2.26e-02 -9.36e-04 9.36e-04 30.470 57
CPL -1.359 -0.113 0.151 966.221 -966.221 -966.221 2.35e-02 -1.75e-03 3.30e-03 30.970 56
=== 1-s peak spectral analysis ===
(Best model with acceptable fit: N/A)
Model Ph_index Ph_90err_low Ph_90err_hi Epeak Epeak_90err_low Epeak_90err_hi Norm Nomr_90err_low Norm_90err_hi chi2 dof
PL N/A N/A N/A - - - N/A N/A N/A N/A N/A
CPL N/A N/A N/A N/A N/A N/A N/A N/A N/A N/A N/A
=== Fluence/Peak Flux Summary ===
Model Band1 Band2 Band3 Band4 Band5 Total
15-25 25-50 50-100 100-350 15-150 15-350 keV
Fluence PL 2.62e-07 5.13e-07 7.81e-07 2.58e-06 2.19e-06 4.14e-06 erg/cm2
90%_error_low -2.13e-08 -2.44e-08 -4.07e-08 -2.96e-07 -9.91e-08 -3.22e-07 erg/cm2
90%_error_hi 2.19e-08 2.42e-08 4.05e-08 3.23e-07 9.94e-08 3.43e-07 erg/cm2
Peak flux PL N/A N/A N/A N/A N/A N/A ph/cm2/s
Image
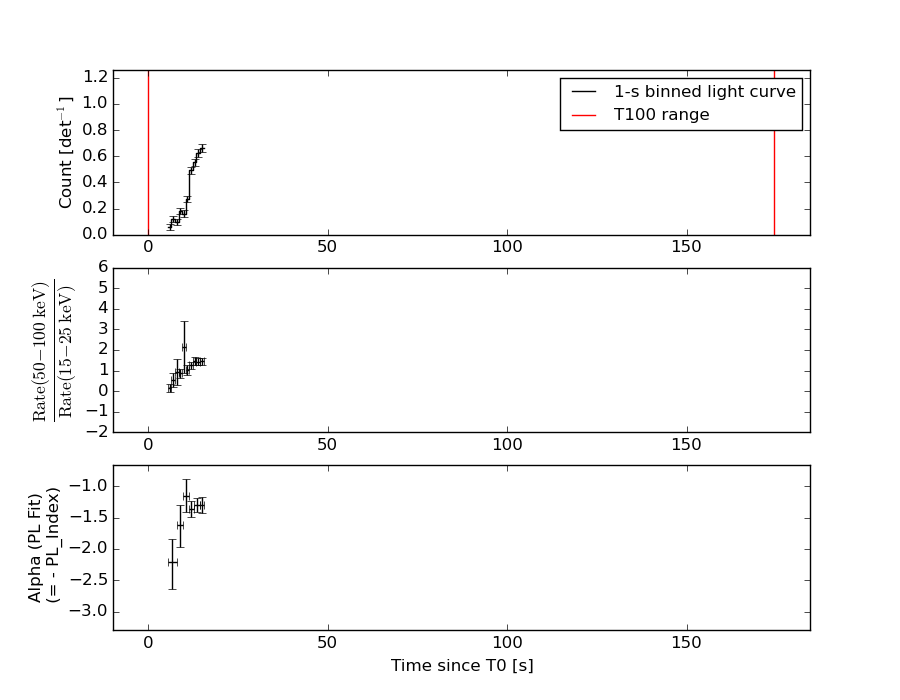
Light Curves
Note: The mask-weighted lightcurves have units of either count/det or counts/sec/det, where a det is 0.4 x 0.4 = 0.16 sq cm.
Best duration plot
Full-time range; 1 s binning
Other quick-look light curves:
- 64 ms binning (zoomed)
- 16 ms binning (zoomed)
- 8 ms binning (zoomed)
- 2 ms binning (zoomed)
- SN=5 or 10 s binning (full-time range)
- Raw light curve
Spectra
- 64 ms binning (zoomed)
- 16 ms binning (zoomed)
- 8 ms binning (zoomed)
- 2 ms binning (zoomed)
- SN=5 or 10 s binning (full-time range)
- Raw light curve
Spectra
Notes:
- 1) The fitting includes the systematic errors.
- 2) When the burst includes telescope slew time periods, the fitting uses an average response file made from multiple 5-s response files through out the slew time plus single time preiod for the non-slew times, and weighted by the total counts in the corresponding time period using addrmf. An average response file is needed becuase a spectral fit using the pre-slew DRM will introduce some errors in both a spectral shape and a normalization if the PHA file contains a lot of the slew/post-slew time interval.
- 3) For fits to more complicated models (e.g. a power-law over a cutoff power-law), the BAT team has decided to require a chi-square improvement of more than 6 for each extra dof.
Time averaged spectrum fit using the average DRM
Power-law model
Time interval is from    5.400 sec. to   15.423 sec.

Spectral model in power-law:
------------------------------------------------------------
Parameters  : value       lower 90%   higher 90%
Photon index: -1.39516     ( -0.078719   0.0788374 )
Norm@50keV  : 2.25908E-02    ( -0.000936135   0.000935891 )
------------------------------------------------------------
#Fit statistic : Chi-Squared =          30.47 using 59 PHA bins.
# Reduced chi-squared =         0.5346 for     57 degrees of freedom
# Null hypothesis probability =   9.984750e-01

Photon flux (15-150 keV)    in 10.02 sec: 2.74817 ( -0.12098  0.12153 ) ph/cm2/s
Energy fluence (15-150 keV)             : 2.18966e-06 ( -9.90761e-08  9.9455e-08 ) ergs/cm2
Cutoff power-law model

Time interval is from    5.400 sec. to   15.423 sec.
Spectral model in the cutoff power-law:
------------------------------------------------------------
Parameters  : value       lower 90%   higher 90%
Photon index: -1.39196     ( -0.112728   0.151646 )
Epeak [keV] : 9999.19      ( -9999.21 -9999.21 )
Norm@50keV  : 2.26721E-02    ( -0.000938525   0.00411443 )
------------------------------------------------------------
#Fit statistic : Chi-Squared =          30.51 using 59 PHA bins.
# Reduced chi-squared =         0.5449 for     56 degrees of freedom
# Null hypothesis probability =   9.978305e-01

Photon flux (15-150 keV)    in 10.02 sec: 1.37475 ( -0.21236  0.25675 ) ph/cm2/s
Energy fluence (15-150 keV)             : 2.20947e-06 ( -1.57611e-07  1.17483e-07 ) ergs/cm2
1-s peak spectrum fit
1-s peak spectrum unavailable, likely because there are no event data in the 1-s peak range.
Time-resolved spectra
Distribution
T90 vs. Hardness ratio plot
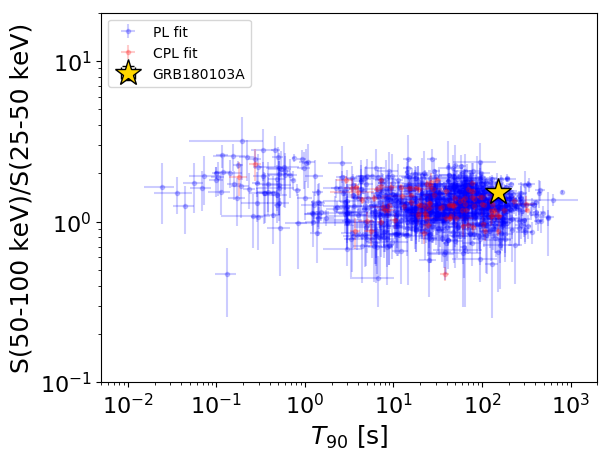
T90                                   = 150.4 sec.
Hardness ratio (energy fluence ratio) = 1.52086255761
S(15-50 keV) vs. S(50-150 keV) plot
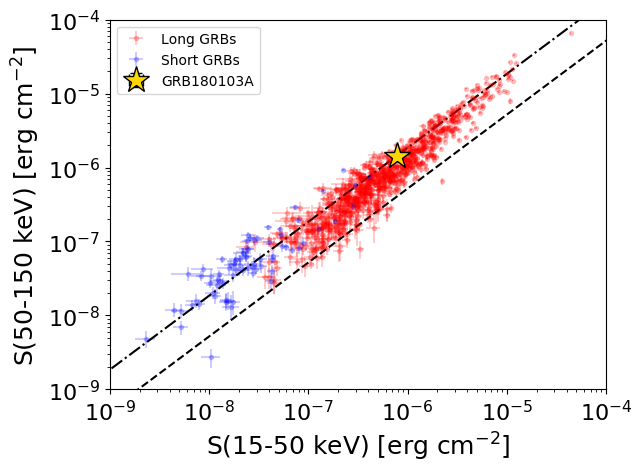
S(15-50 keV)  = 7.75347e-07
S(50-150 keV) = 1.414328e-06
The dash-dotted line and the dashed line traces the fluences calculated from the Band function with Epeak = 15 and 150 keV, respectively. Both lines assume a canonical values of alpha = -1 and beta = -2.5.
Spacecraft aspect plot
Bright source in the event data image
Event data image of 15-350 keV band
Time interval of the image:
5.400000 10.000590

# RAcent  DECcent POSerr Theta    Phi  PeakCts   SNR AngSep     Name
#  [deg]    [deg]    ['] [deg]  [deg]                   [']
170.5152 -60.5010    7.9  34.6  173.5  -0.0580  -1.5    9.4	Cen X-3
186.5308 -62.7610    3.2  34.4 -172.5   0.1293   3.6    3.5	GX 301-2
159.5848 -53.5547    1.0  39.6  160.8   0.5995  11.8 ------	UNKNOWN
228.5014 -53.7842    2.2  46.2 -140.9   0.3903   5.3 ------	UNKNOWN
241.7321 -51.5901    2.4  48.4 -130.0   0.6270   4.7 ------	UNKNOWN
Webpage updated on:
Sat Jan  6 12:33:53 EST 2018