Analysis Summary
Notes:
- 1) No attempt has been made to eliminate the non-significant decimal places.
- 2) This batgrbproduct analysis is done using the HEASARC data.
- 3) This batgrbproduct analysis is using the flight position for the mask-weighting calculation.
======================================================================
BAT GRB EVENT DATA PROCESSING REPORT
Process Script Ver: batgrbproduct v2.46
Process Start Time: Fri Feb 2 16:01:01 EST 2018
Host Name: bat1
Current Working Dir: /local/data/bat1/alien/Swift_3rdBATcatalog/event/batevent_reproc/trigger804692
======================================================================
Trigger: 00804692 Segment: 000
BAT Trigger Time: 537381746.688 [s; MET]
Trigger Stop: 537381746.944 [s; MET]
UTC: 2018-01-11T16:42:06.387380 [includes UTCF correction]
Where From?: TDRSS position message
BAT
RA: 149.84082869691 Dec: 48.2647072728262 [deg; J2000]
Catalogged Source?: NO
Point Source?: YES
GRB Indicated?: YES [ by BAT flight software ]
Image S/N Ratio: 10.93
Image Trigger?: NO
Rate S/N Ratio: 76.3020314277412 [ if not an image trigger ]
Image S/N Ratio: 10.93
Analysis Position: [ source = BAT ]
RA: 149.84082869691 Dec: 48.2647072728262 [deg; J2000]
Refined Position: [ source = BAT pre-slew burst ]
RA: 149.781875138668 Dec: 48.254015645398 [deg; J2000]
{ 09h 59m 07.7s , +48d 15' 14.5" }
+/- 0.666105442273207 [arcmin] (estimated 90% radius based on SNR)
+/- 0.218121391426041 [arcmin] (formal 1-sigma fit error)
SNR: 54.3500357760269
Angular difference between the analysis and refined position is 2.440745 arcmin
Partial Coding Fraction: 0.703125 [ including projection effects ]
Duration
T90: 50.8919999599457 +/- 1.88013615903655
Measured from: 1.78400003910065
to: 52.6759999990463 [s; relative to TRIGTIME]
T50: 22.2639999389648 +/- 0.394400764322609
Measured from: 10.392000079155
to: 32.6560000181198 [s; relative to TRIGTIME]
Fluence
Peak Flux (peak 1 second)
Measured from: 13.8880000114441
to: 14.8880000114441 [s; relative to TRIGTIME]
Total Fluence
Measured from: -0.296000003814697
to: 69.5880000591278 [s; relative to TRIGTIME]
Band 1 Band 2 Band 3 Band 4
15-25 25-50 50-100 100-350 keV
Total 3.446196 5.306081 4.627286 1.520888
0.057406 0.063303 0.059197 0.048992 [error]
Peak 0.117844 0.200227 0.221808 0.089550
0.008909 0.010716 0.010790 0.008664 [error]
[ fluence units of on-axis counts / fully illuminated detector ]
======================================================================
====== Table of the duration information =============================
Value tstart tstop
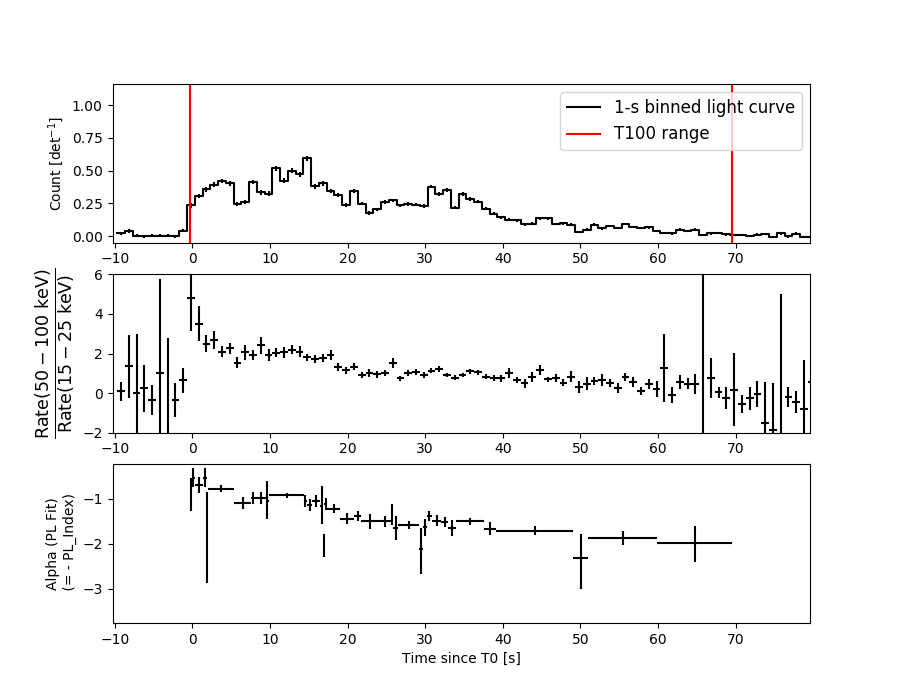
T100 69.884 -0.296 69.588
T90 50.892 1.784 52.676
T50 22.264 10.392 32.656
Peak 1.000 13.888 14.888
====== Spectral Analysis Summary =====================================
Model : spectral model: simple power-law (PL) and cutoff power-law (CPL)
Ph_index : photon index: E^{Ph_index}
Ph_90err : 90% error of the photon index
Epeak : Epeak in keV
Epeak_90err: 90% error of Epeak
Norm : normalization at 50 keV in both the PL model and CPL model
Nomr_90err : 90% error of the normalization
chi2 : Chi-Squared
dof : degree of freedo
=== Time-averaged spectral analysis ===
(Best model with acceptable fit: PL)
Model Ph_index Ph_90err_low Ph_90err_hi Epeak Epeak_90err_low Epeak_90err_hi Norm Nomr_90err_low Norm_90err_hi chi2 dof
PL -1.280 -0.034 0.034 - - - 1.45e-02 -2.54e-04 2.54e-04 36.880 57
CPL -1.275 -0.034 0.034 9987.990 -9987.990 -9987.990 1.45e-02 -2.51e-04 9.56e-04 37.010 56
=== 1-s peak spectral analysis ===
(Best model with acceptable fit: N/A)
Model Ph_index Ph_90err_low Ph_90err_hi Epeak Epeak_90err_low Epeak_90err_hi Norm Nomr_90err_low Norm_90err_hi chi2 dof
PL -0.971 -0.095 0.096 - - - 4.25e-02 -2.28e-03 2.27e-03 52.910 57
CPL -0.958 -0.103 0.353 9967.010 -9967.010 -9967.010 4.28e-02 -2.23e-03 2.28e-03 52.930 56
=== Fluence/Peak Flux Summary ===
Model Band1 Band2 Band3 Band4 Band5 Total
15-25 25-50 50-100 100-350 15-150 15-350 keV
Fluence PL 1.05e-06 2.21e-06 3.64e-06 1.36e-05 1.00e-05 2.05e-05 erg/cm2
90%_error_low -4.14e-08 -5.03e-08 -6.85e-08 -6.18e-07 -1.75e-07 -6.36e-07 erg/cm2
90%_error_hi 4.21e-08 5.03e-08 6.84e-08 6.39e-07 1.75e-07 6.53e-07 erg/cm2
Peak flux PL 4.00e-04 4.86e-03 6.37e-02 5.60e+00 2.39e-01 5.56e+00 ph/cm2/s
90%_error_low 3.81e-05 N/A -2.47e-03 -2.63e-01 N/A -1.59e-01 ph/cm2/s
90%_error_hi 1.14e-04 N/A 7.32e-03 4.23e-01 N/A 5.30e-01 ph/cm2/s
Fluence CPL 1.05e-06 2.21e-06 3.62e-06 1.45e-05 1.01e-05 2.04e-05 erg/cm2
90%_error_low N/A -4.68e-08 N/A N/A -2.18e-07 -1.15e-06 erg/cm2
90%_error_hi N/A 5.38e-08 N/A N/A 1.31e-07 6.15e-07 erg/cm2
Peak flux CPL 1.05e+00 1.46e+00 1.49e+00 2.74e+00 4.89e+00 6.73e+00 ph/cm2/s
90%_error_low -1.52e-01 -9.52e-02 -8.79e-02 -8.89e-01 -2.62e-01 -9.21e-01 ph/cm2/s
90%_error_hi 9.34e-02 1.03e-01 1.08e-01 2.23e-01 2.67e-01 4.07e-01 ph/cm2/s
======================================================================
Image
Pre-slew 15.0-350.0 keV image (Event data)
#   RAcent    DECcent   POSerr    Theta     Phi              Peak Cts       SNR   Name
  149.7819    48.2540   0.0035    28.0848    28.4416         3.6437797     54.350 TRIG_00804692

Foreground time interval of the image:
 -0.296   9.813 (delta_t =  10.109 [sec])
Background time interval of the image:
-239.688  -0.296 (delta_t = 239.392 [sec])
Light Curves
Note: The mask-weighted lightcurves have units of either count/det or counts/sec/det, where a det is 0.4 x 0.4 = 0.16 sq cm.
Full-time range; 1 s binning
Other quick-look light curves:
- 64 ms binning (zoomed)
- 16 ms binning (zoomed)
- 8 ms binning (zoomed)
- 2 ms binning (zoomed)
- SN=5 or 10 s binning (full-time range)
- Raw light curve
Spectra
- 64 ms binning (zoomed)
- 16 ms binning (zoomed)
- 8 ms binning (zoomed)
- 2 ms binning (zoomed)
- SN=5 or 10 s binning (full-time range)
- Raw light curve
Spectra
Notes:
- 1) The fitting includes the systematic errors.
- 2) When the burst includes telescope slew time periods, the fitting uses an average response file made from multiple 5-s response files through out the slew time plus single time preiod for the non-slew times, and weighted by the total counts in the corresponding time period using addrmf. An average response file is needed becuase a spectral fit using the pre-slew DRM will introduce some errors in both a spectral shape and a normalization if the PHA file contains a lot of the slew/post-slew time interval.
- 3) For fits to more complicated models (e.g. a power-law over a cutoff power-law), the BAT team has decided to require a chi-square improvement of more than 6 for each extra dof.
Time averaged spectrum fit using the average DRM
Power-law model
Time interval is from   -0.296 sec. to   69.588 sec.

Spectral model in power-law:
------------------------------------------------------------
Parameters  : value       lower 90%   higher 90%
Photon index: -1.27965     ( -0.0336512   0.0337548 )
Norm@50keV  : 1.44691E-02    ( -0.00025406   0.000253578 )
------------------------------------------------------------
#Fit statistic : Chi-Squared =          36.88 using 59 PHA bins.
# Reduced chi-squared =         0.6470 for     57 degrees of freedom
# Null hypothesis probability =   9.822591e-01

Photon flux (15-150 keV)    in 69.88 sec: 1.71991 ( -0.03415  0.03432 ) ph/cm2/s
Energy fluence (15-150 keV)             : 1.00432e-05 ( -1.74911e-07  1.74941e-07 ) ergs/cm2
Cutoff power-law model

Time interval is from   -0.296 sec. to   69.588 sec.
Spectral model in the cutoff power-law:
------------------------------------------------------------
Parameters  : value       lower 90%   higher 90%
Photon index: -1.2751     ( -0.0340643   0.0338303 )
Epeak [keV] : 9987.99      ( -9995.61 -9995.61 )
Norm@50keV  : 1.45301E-02    ( -0.000250643   0.000956574 )
------------------------------------------------------------
#Fit statistic : Chi-Squared =          37.01 using 59 PHA bins.
# Reduced chi-squared =         0.6609 for     56 degrees of freedom
# Null hypothesis probability =   9.764362e-01

Photon flux (15-150 keV)    in 69.88 sec: 1.73146 (    ) ph/cm2/s
Energy fluence (15-150 keV)             : 1.00842e-05 ( -2.18202e-07  1.31334e-07 ) ergs/cm2
1-s peak spectrum fit
Power-law model

Time interval is from   13.888 sec. to   14.888 sec.

Spectral model in power-law:
------------------------------------------------------------
Parameters  : value       lower 90%   higher 90%
Photon index: -0.971151     ( -0.0950125   0.0961522 )
Norm@50keV  : 4.25208E-02    ( -0.00227539   0.00226857 )
------------------------------------------------------------
#Fit statistic : Chi-Squared =          52.91 using 59 PHA bins.
# Reduced chi-squared =         0.9283 for     57 degrees of freedom
# Null hypothesis probability =   6.291242e-01

Photon flux (15-150 keV)    in 1 sec: 0.239311 (    ) ph/cm2/s
Energy fluence (15-150 keV)             : 4.64644e-07 ( -2.7132e-08  2.72256e-08 ) ergs/cm2
Cutoff power-law model
Time interval is from   13.888 sec. to   14.888 sec.
Spectral model in the cutoff power-law:
------------------------------------------------------------
Parameters  : value       lower 90%   higher 90%
Photon index: -0.965115     ( -0.103265   0.353217 )
Epeak [keV] : 9999.99      ( -9999.99 -9999.99 )
Norm@50keV  : 4.27842E-02    ( -0.00225586   0.00225075 )
------------------------------------------------------------
#Fit statistic : Chi-Squared =          52.91 using 59 PHA bins.
# Reduced chi-squared =         0.9448 for     56 degrees of freedom
# Null hypothesis probability =   5.925905e-01

Photon flux (15-150 keV)    in 1 sec: 4.88549 ( -0.26191  0.26671 ) ph/cm2/s
Energy fluence (15-150 keV)             : 4.64344e-07 ( -2.82501e-08  2.61232e-08 ) ergs/cm2
Time-resolved spectra
Distribution
T90 vs. Hardness ratio plot
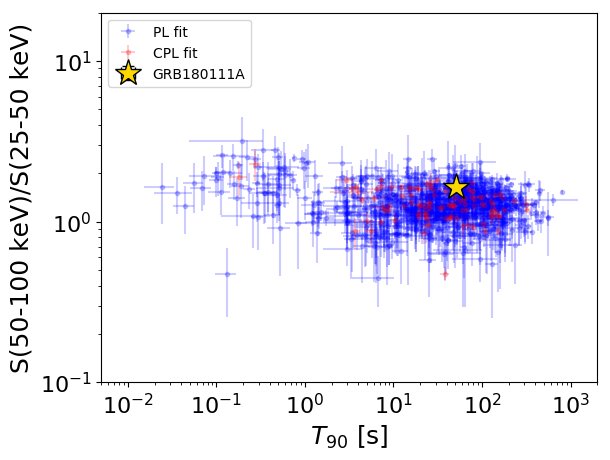
T90                                   = 50.892 sec.
Hardness ratio (energy fluence ratio) = 1.64763102054
S(15-50 keV) vs. S(50-150 keV) plot
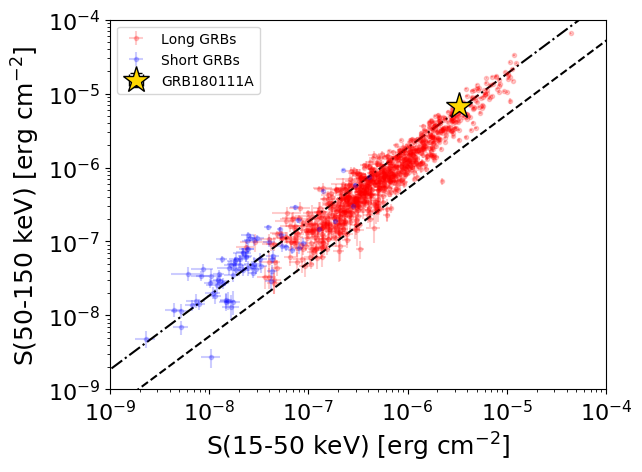
S(15-50 keV)  = 3.260338e-06
S(50-150 keV) = 6.782827e-06
The dash-dotted line and the dashed line traces the fluences calculated from the Band function with Epeak = 15 and 150 keV, respectively. Both lines assume a canonical values of alpha = -1 and beta = -2.5.
Mask shadow pattern
IMX = 4.692045612666956E-01, IMY = -2.541387528466470E-01
Spacecraft aspect plot
Bright source in the pre-burst/pre-slew/post-slew images
Pre-burst image of 15-350 keV band
Time interval of the image:
-239.688000 -0.296000

# RAcent  DECcent POSerr Theta    Phi  PeakCts   SNR AngSep     Name
#  [deg]    [deg]    ['] [deg]  [deg]                   [']
 83.6325  22.0232    0.8  43.4  138.7   9.7367  14.6    0.5	Crab
 46.7468  34.1802    3.7  46.0 -171.5   1.2083   3.2 ------	UNKNOWN
 40.9211  61.4410    0.3  29.1 -134.6   9.7414  34.2 ------	UNKNOWN
 11.2898  51.0808    3.2  48.0 -129.2   3.7924   3.5 ------	UNKNOWN
Pre-slew background subtracted image of 15-350 keV band
Time interval of the image:
-0.296000 9.812590

# RAcent  DECcent POSerr Theta    Phi  PeakCts   SNR AngSep     Name
#  [deg]    [deg]    ['] [deg]  [deg]                   [']
 83.6775  21.9360    7.6  43.4  138.6   0.2594   1.5    5.3	Crab
149.7819  48.2540    0.2  28.1   28.4   3.6436  54.3 ------	UNKNOWN
267.3805  72.9584    4.3  43.8  -64.1   0.6529   2.7 ------	UNKNOWN
Post-slew image of 15-350 keV band
Time interval of the image:
76.012640 683.812610

# RAcent  DECcent POSerr Theta    Phi  PeakCts   SNR AngSep     Name
#  [deg]    [deg]    ['] [deg]  [deg]                   [']
118.3168  27.2515    2.7  32.2   90.1   3.1116   4.2 ------	UNKNOWN
 40.8918  61.4499    1.5  56.5  176.5  19.7355   7.9 ------	UNKNOWN
 37.1891  62.7431    2.6  56.9  179.0  11.8131   4.4 ------	UNKNOWN
189.5512   3.1593    3.4  56.5  -20.6   6.0102   3.5 ------	UNKNOWN
351.3643  74.5342    3.4  56.4 -157.4   8.6843   3.4 ------	UNKNOWN
286.6289  84.1036    3.5  46.2 -145.1   3.2329   3.3 ------	UNKNOWN
340.7551  74.3604    4.1  57.2 -154.2   8.5080   2.8 ------	UNKNOWN
339.5406  74.5500    2.7  57.0 -153.7  13.1132   4.3 ------	UNKNOWN