Analysis Summary
Notes:
- 1) No attempt has been made to eliminate the non-significant decimal places.
- 2) This batgrbproduct analysis is done using the HEASARC data.
- 3) This batgrbproduct analysis is using the flight position for the mask-weighting calculation.
======================================================================
BAT GRB EVENT DATA PROCESSING REPORT
Process Script Ver: batgrbproduct v2.46
Process Start Time: Fri Mar 2 16:28:18 EST 2018
Host Name: bat1
Current Working Dir: /local/data/bat1/alien/Swift_3rdBATcatalog/event/batevent_reproc/trigger808625
======================================================================
Trigger: 00808625 Segment: 000
BAT Trigger Time: 539497549.76 [s; MET]
Trigger Stop: 539497550.272 [s; MET]
UTC: 2018-02-05T04:25:29.331960 [includes UTCF correction]
Where From?: TDRSS position message
BAT
RA: 126.806396594374 Dec: 11.5396155071366 [deg; J2000]
Catalogged Source?: NO
Point Source?: YES
GRB Indicated?: YES [ by BAT flight software ]
Image S/N Ratio: 10.76
Image Trigger?: NO
Rate S/N Ratio: 23.1516738055805 [ if not an image trigger ]
Image S/N Ratio: 10.76
Analysis Position: [ source = BAT ]
RA: 126.806396594374 Dec: 11.5396155071366 [deg; J2000]
Refined Position: [ source = BAT pre-slew burst ]
RA: 126.819327604964 Dec: 11.5361858423513 [deg; J2000]
{ 08h 27m 16.6s , +11d 32' 10.3" }
+/- 1.0956932438053 [arcmin] (estimated 90% radius based on SNR)
+/- 0.514599591438998 [arcmin] (formal 1-sigma fit error)
SNR: 26.6943795907834
Angular difference between the analysis and refined position is 0.787542 arcmin
Partial Coding Fraction: 0.5 [ including projection effects ]
Duration
T90: 15.5359998941422 +/- 3.14699346489193
Measured from: -6.31599998474121
to: 9.21999990940094 [s; relative to TRIGTIME]
T50: 6.11199998855591 +/- 0.598264161410583
Measured from: -4.69200003147125
to: 1.41999995708466 [s; relative to TRIGTIME]
Fluence
Peak Flux (peak 1 second)
Measured from: -0.195999979972839
to: 0.804000020027161 [s; relative to TRIGTIME]
Total Fluence
Measured from: -7.0440000295639
to: 10.8680000305176 [s; relative to TRIGTIME]
Band 1 Band 2 Band 3 Band 4
15-25 25-50 50-100 100-350 keV
Total 0.754907 0.732596 0.396065 0.059204
0.038867 0.040049 0.033652 0.027988 [error]
Peak 0.123548 0.152514 0.108165 0.017881
0.011139 0.011644 0.010116 0.007477 [error]
[ fluence units of on-axis counts / fully illuminated detector ]
======================================================================
====== Table of the duration information =============================
Value tstart tstop
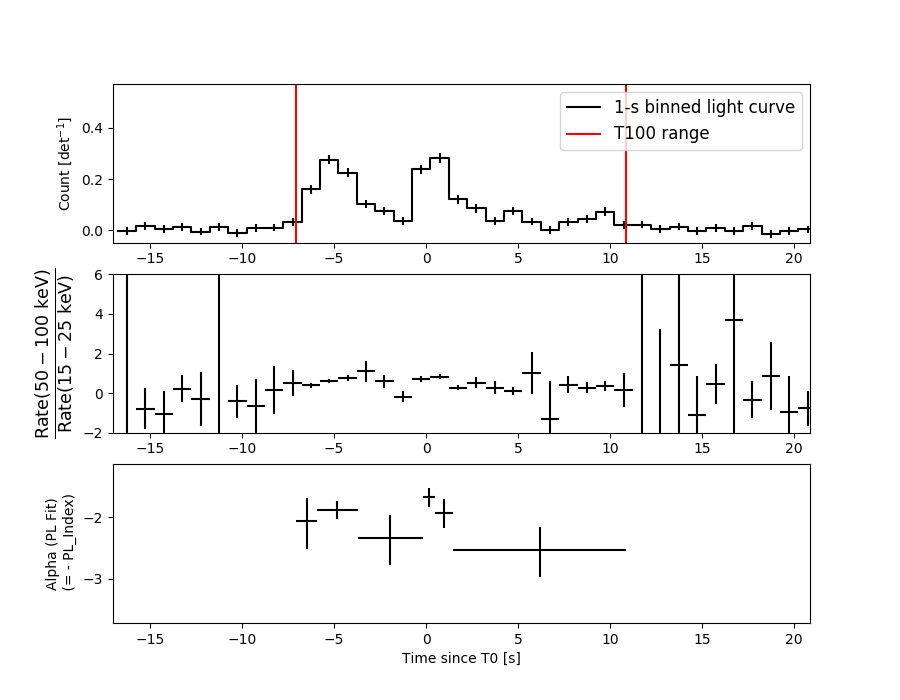
T100 17.912 -7.044 10.868
T90 15.536 -6.316 9.220
T50 6.112 -4.692 1.420
Peak 1.000 -0.196 0.804
====== Spectral Analysis Summary =====================================
Model : spectral model: simple power-law (PL) and cutoff power-law (CPL)
Ph_index : photon index: E^{Ph_index}
Ph_90err : 90% error of the photon index
Epeak : Epeak in keV
Epeak_90err: 90% error of Epeak
Norm : normalization at 50 keV in both the PL model and CPL model
Nomr_90err : 90% error of the normalization
chi2 : Chi-Squared
dof : degree of freedo
=== Time-averaged spectral analysis ===
(Best model with acceptable fit: PL)
Model Ph_index Ph_90err_low Ph_90err_hi Epeak Epeak_90err_low Epeak_90err_hi Norm Nomr_90err_low Norm_90err_hi chi2 dof
PL -2.036 -0.128 0.124 - - - 6.16e-03 -4.83e-04 4.76e-04 58.360 57
CPL -1.827 -0.282 0.509 36.545 N/A N/A 8.05e-03 N/A N/A 57.770 56
=== 1-s peak spectral analysis ===
(Best model with acceptable fit: PL)
Model Ph_index Ph_90err_low Ph_90err_hi Epeak Epeak_90err_low Epeak_90err_hi Norm Nomr_90err_low Norm_90err_hi chi2 dof
PL -1.725 -0.146 0.142 - - - 2.52e-02 -2.31e-03 2.28e-03 68.730 57
CPL -1.053 -0.572 0.653 68.420 -15.014 98.810 5.62e-02 -2.74e-02 6.41e-02 64.630 56
=== Fluence/Peak Flux Summary ===
Model Band1 Band2 Band3 Band4 Band5 Total
15-25 25-50 50-100 100-350 15-150 15-350 keV
Fluence PL 2.34e-07 3.10e-07 3.03e-07 5.28e-07 1.02e-06 1.37e-06 erg/cm2
90%_error_low -2.25e-08 -1.96e-08 -3.28e-08 -1.08e-07 -7.41e-08 -1.43e-07 erg/cm2
90%_error_hi 2.30e-08 1.96e-08 3.31e-08 1.25e-07 7.49e-08 1.56e-07 erg/cm2
Peak flux PL 1.29e+00 1.13e+00 6.86e-01 6.27e-01 3.37e+00 3.73e+00 ph/cm2/s
90%_error_low -1.67e-01 -9.70e-02 -8.04e-02 -1.34e-01 -2.87e-01 -3.14e-01 ph/cm2/s
90%_error_hi 1.73e-01 9.68e-02 8.00e-02 1.53e-01 2.87e-01 3.14e-01 ph/cm2/s
Fluence CPL N/A N/A N/A N/A N/A N/A erg/cm2
90%_error_low -2.25e-08 -1.96e-08 -3.28e-08 -1.08e-07 -7.41e-08 -1.43e-07 erg/cm2
90%_error_hi 2.30e-08 1.96e-08 3.31e-08 1.25e-07 7.49e-08 1.56e-07 erg/cm2
Peak flux CPL 1.15e+00 1.21e+00 7.20e-01 3.13e-01 3.29e+00 3.40e+00 ph/cm2/s
90%_error_low -2.02e-01 -1.18e-01 -9.03e-02 -1.39e-01 -2.97e-01 -3.38e-01 ph/cm2/s
90%_error_hi 2.05e-01 1.21e-01 9.22e-02 2.55e-01 2.96e-01 3.75e-01 ph/cm2/s
======================================================================
Image
Pre-slew 15.0-350.0 keV image (Event data)
#   RAcent    DECcent   POSerr    Theta     Phi              Peak Cts       SNR   Name
  126.8193    11.5362   0.0072    26.0457    87.8532         1.9887556     26.694 TRIG_00808625

Foreground time interval of the image:
 -7.044  10.868 (delta_t =  17.912 [sec])
Background time interval of the image:
-239.760  -7.044 (delta_t = 232.716 [sec])
Light Curves
Note: The mask-weighted lightcurves have units of either count/det or counts/sec/det, where a det is 0.4 x 0.4 = 0.16 sq cm.
Full-time range; 1 s binning
Other quick-look light curves:
- 64 ms binning (zoomed)
- 16 ms binning (zoomed)
- 8 ms binning (zoomed)
- 2 ms binning (zoomed)
- SN=5 or 10 s binning (full-time range)
- Raw light curve
Spectra
- 64 ms binning (zoomed)
- 16 ms binning (zoomed)
- 8 ms binning (zoomed)
- 2 ms binning (zoomed)
- SN=5 or 10 s binning (full-time range)
- Raw light curve
Spectra
Notes:
- 1) The fitting includes the systematic errors.
- 2) When the burst includes telescope slew time periods, the fitting uses an average response file made from multiple 5-s response files through out the slew time plus single time preiod for the non-slew times, and weighted by the total counts in the corresponding time period using addrmf. An average response file is needed becuase a spectral fit using the pre-slew DRM will introduce some errors in both a spectral shape and a normalization if the PHA file contains a lot of the slew/post-slew time interval.
- 3) For fits to more complicated models (e.g. a power-law over a cutoff power-law), the BAT team has decided to require a chi-square improvement of more than 6 for each extra dof.
Time averaged spectrum fit using the average DRM
Power-law model
Time interval is from   -7.044 sec. to   10.868 sec.

Spectral model in power-law:
------------------------------------------------------------
Parameters  : value       lower 90%   higher 90%
Photon index: -2.03639     ( -0.128216   0.124096 )
Norm@50keV  : 6.16328E-03    ( -0.000483306   0.000475738 )
------------------------------------------------------------
#Fit statistic : Chi-Squared =          58.36 using 59 PHA bins.
# Reduced chi-squared =          1.024 for     57 degrees of freedom
# Null hypothesis probability =   4.250441e-01

Photon flux (15-150 keV)    in 17.91 sec: 0.940380 ( -0.060763  0.06085 ) ph/cm2/s
Energy fluence (15-150 keV)             : 1.02039e-06 ( -7.40736e-08  7.48928e-08 ) ergs/cm2
Cutoff power-law model
Time interval is from   -7.044 sec. to   10.868 sec.
Spectral model in the cutoff power-law:
------------------------------------------------------------
Parameters  : value       lower 90%   higher 90%
Photon index: -1.82652     ( -0.281602   0.508529 )
Epeak [keV] : 36.5453      (   )
Norm@50keV  : 8.04746E-03    (     )
------------------------------------------------------------
#Fit statistic : Chi-Squared =          57.77 using 59 PHA bins.
# Reduced chi-squared =          1.032 for     56 degrees of freedom
# Null hypothesis probability =   4.095863e-01

Photon flux (15-150 keV)    in 17.91 sec: 0.929891 ( -0.064852  0.064653 ) ph/cm2/s
Energy fluence (15-150 keV)             : 0 ( 0  0 ) ergs/cm2
1-s peak spectrum fit
Power-law model
Time interval is from   -0.196 sec. to    0.804 sec.

Spectral model in power-law:
------------------------------------------------------------
Parameters  : value       lower 90%   higher 90%
Photon index: -1.72493     ( -0.146312   0.142265 )
Norm@50keV  : 2.51720E-02    ( -0.00230686   0.00228199 )
------------------------------------------------------------
#Fit statistic : Chi-Squared =          68.73 using 59 PHA bins.
# Reduced chi-squared =          1.206 for     57 degrees of freedom
# Null hypothesis probability =   1.372523e-01

Photon flux (15-150 keV)    in 1 sec: 3.37293 ( -0.28658  0.28681 ) ph/cm2/s
Energy fluence (15-150 keV)             : 2.3267e-07 ( -2.20644e-08  2.22771e-08 ) ergs/cm2
Cutoff power-law model
Time interval is from   -0.196 sec. to    0.804 sec.
Spectral model in the cutoff power-law:
------------------------------------------------------------
Parameters  : value       lower 90%   higher 90%
Photon index: -1.05344     ( -0.572383   0.653394 )
Epeak [keV] : 68.4196      ( -15.0139 98.8099 )
Norm@50keV  : 5.62287E-02    ( -0.0273744   0.064065 )
------------------------------------------------------------
#Fit statistic : Chi-Squared =          64.63 using 59 PHA bins.
# Reduced chi-squared =          1.154 for     56 degrees of freedom
# Null hypothesis probability =   2.007335e-01

Photon flux (15-150 keV)    in 1 sec: 3.28812 ( -0.2967  0.29591 ) ph/cm2/s
Energy fluence (15-150 keV)             : 2.23254e-07 ( -2.33599e-08  2.36568e-08 ) ergs/cm2
Time-resolved spectra
Distribution
T90 vs. Hardness ratio plot
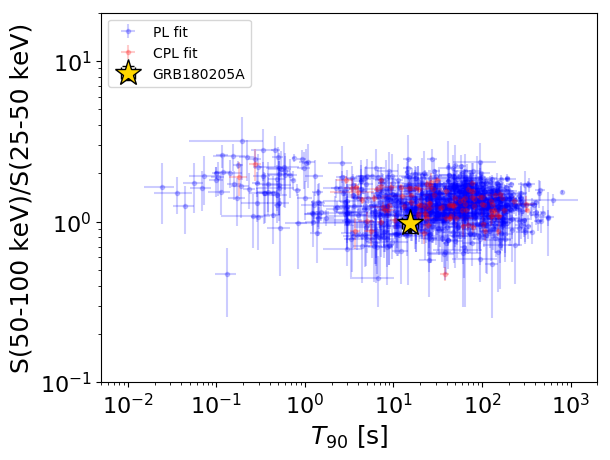
T90                                   = 15.536 sec.
Hardness ratio (energy fluence ratio) = 0.975146774442
S(15-50 keV) vs. S(50-150 keV) plot
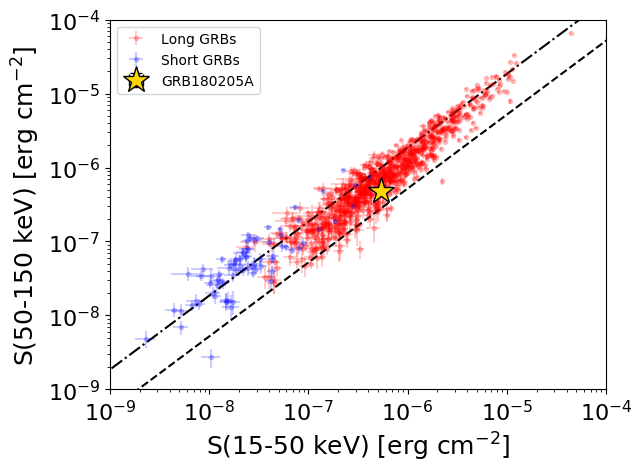
S(15-50 keV)  = 5.441962e-07
S(50-150 keV) = 4.761908e-07
The dash-dotted line and the dashed line traces the fluences calculated from the Band function with Epeak = 15 and 150 keV, respectively. Both lines assume a canonical values of alpha = -1 and beta = -2.5.
Mask shadow pattern
IMX = 1.830738376657725E-02, IMY = -4.883774127948993E-01
Spacecraft aspect plot
Bright source in the pre-burst/pre-slew/post-slew images
Pre-burst image of 15-350 keV band
Time interval of the image:
-239.760000 -7.044000

# RAcent  DECcent POSerr Theta    Phi  PeakCts   SNR AngSep     Name
#  [deg]    [deg]    ['] [deg]  [deg]                   [']
 95.6817  48.5338    3.3  48.8  157.8   2.6003   3.5 ------	UNKNOWN
156.8300 -28.6912    3.8  53.7   17.1   3.1284   3.0 ------	UNKNOWN
162.4127 -30.0494    2.5  55.9   11.5   5.7319   4.6 ------	UNKNOWN
170.2989 -28.9008    2.8  56.8    3.2   5.2528   4.1 ------	UNKNOWN
161.9509   5.8307    3.0  21.8   -8.1   0.7810   3.8 ------	UNKNOWN
121.5343  72.7392    3.0  50.6 -166.8   2.3017   3.9 ------	UNKNOWN
192.0700  32.0593    2.6  37.0  -87.3   3.0364   4.4 ------	UNKNOWN
193.4097  12.6243    3.3  42.2  -57.5   2.2499   3.5 ------	UNKNOWN
196.0616  61.8021    3.0  48.0 -129.2   3.8694   3.8 ------	UNKNOWN
Pre-slew background subtracted image of 15-350 keV band
Time interval of the image:
-7.044000 10.868000

# RAcent  DECcent POSerr Theta    Phi  PeakCts   SNR AngSep     Name
#  [deg]    [deg]    ['] [deg]  [deg]                   [']
126.8193  11.5362    0.4  26.0   87.9   1.9886  26.7 ------	UNKNOWN
181.8479  -8.2520    2.6  44.9  -22.9   0.3801   4.3 ------	UNKNOWN
195.8059  62.6788    2.7  48.3 -130.3   1.0000   4.3 ------	UNKNOWN
Post-slew image of 15-350 keV band
Time interval of the image:
156.740600 842.290000

# RAcent  DECcent POSerr Theta    Phi  PeakCts   SNR AngSep     Name
#  [deg]    [deg]    ['] [deg]  [deg]                   [']
 83.6245  22.0138    0.6  42.5  -47.7  20.6295  20.6    0.5	Crab
135.5746 -40.5385   11.0  52.8 -166.1   1.7224   1.0    2.3	Vela X-1
104.8270  65.4672    3.3  55.9   11.5  10.1950   3.5 ------	UNKNOWN
 88.9833  56.0860    3.0  53.2   -3.0   4.6589   3.8 ------	UNKNOWN