Analysis Summary
Notes:
- 1) No attempt has been made to eliminate the non-significant decimal places.
- 2) This batgrbproduct analysis is done using the HEASARC data.
- 3) This batgrbproduct analysis is using the flight position for the mask-weighting calculation.
======================================================================
                  BAT GRB EVENT DATA PROCESSING REPORT
    Process Script Ver: batgrbproduct v2.46
    Process Start Time: Thu Apr  5 17:46:10 EDT 2018
             Host Name: bat1
   Current Working Dir: /local/data/bat1/alien/Swift_3rdBATcatalog/event/batevent_reproc/trigger811074
======================================================================

  Trigger: 00811074      Segment: 000

  BAT Trigger Time: 540887465.344   [s; MET]
      Trigger Stop: 540887481.728   [s; MET]
               UTC: 2018-02-21T06:30:44.832320    [includes UTCF correction]
       Where From?: TDRSS position message

  BAT
    RA: 326.772376374209   Dec: -72.8682959674159  [deg; J2000]

     Catalogged Source?: NO
     Point Source?:      YES
     GRB Indicated?:     YES    [ by BAT flight software ]
     Image S/N Ratio:    7.01
     Image Trigger?:     NO
     Rate S/N Ratio:     9.59166304662544  [ if not an image trigger ]
     Image S/N Ratio:    7.01

  Analysis Position:   [ source = BAT ]
    RA: 326.772376374209   Dec: -72.8682959674159  [deg; J2000]

  Refined Position:   [ source = BAT pre-slew burst ]
    RA: 326.787015047631   Dec: -72.8909131142513  [deg; J2000]
        { 21h 47m 08.9s , -72d 53' 27.3" }
         +/- 2.92318713074618 [arcmin] (estimated 90% radius based on SNR)
         +/- 1.74848091475567 [arcmin] (formal 1-sigma fit error)
    SNR: 6.57065894872872

  Angular difference between the analysis and refined position is 1.381442 arcmin

  Partial Coding Fraction: 0.3125    [ including projection effects ]

  Duration
     T90: 11 +/- 3.16227766016838
        Measured from: 1.65600001811981
                   to: 12.6560000181198     [s; relative to TRIGTIME]
     T50: 7 +/- 3.60555127546399
        Measured from: 2.65600001811981
                   to: 9.65600001811981     [s; relative to TRIGTIME]


  Fluence
     Peak Flux  (peak 1 second)
        Measured from: 2.65600001811981
                   to: 3.65600001811981     [s; relative to TRIGTIME]
     Total Fluence
        Measured from: 1.65600001811981
                   to: 14.6560000181198     [s; relative to TRIGTIME]

             Band 1     Band 2     Band 3     Band 4
              15-25      25-50     50-100    100-350     keV
 Total     0.261867   0.365360   0.235548   0.031659
           0.059640   0.066344   0.059783   0.067162 [error]
 Peak      0.045751   0.045230   0.061815  -0.004705
           0.016544   0.019120   0.017315   0.019041 [error]

     [ fluence units of on-axis counts / fully illuminated detector ]

======================================================================


====== Table of the duration information =============================

        Value   tstart    tstop
T100   13.000    1.656   14.656
T90    11.000    1.656   12.656
T50     7.000    2.656    9.656
Peak    1.000    2.656    3.656


====== Spectral Analysis Summary =====================================

Model      : spectral model: simple power-law (PL) and cutoff power-law (CPL)
Ph_index   : photon index: E^{Ph_index}
Ph_90err   : 90% error of the photon index
Epeak      : Epeak in keV
Epeak_90err: 90% error of Epeak
Norm       : normalization at 50 keV in both the PL model and CPL model
Nomr_90err : 90% error of the normalization
chi2       : Chi-Squared
dof        : degree of freedo

=== Time-averaged spectral analysis ===
(Best model with acceptable fit: PL)

Model Ph_index Ph_90err_low Ph_90err_hi  Epeak  Epeak_90err_low  Epeak_90err_hi  Norm       Nomr_90err_low    Norm_90err_hi    chi2    dof
PL      -1.709    -0.385      0.357       -           -               -         4.74e-03     -1.13e-03          1.09e-03      59.610   57
CPL     -0.905    -1.317      1.943       63.696     -63.696       -63.696      1.27e-02     -1.27e-02          1.20e-01      58.710   56


=== 1-s peak spectral analysis ===
(Best model with acceptable fit: N/A)

Model Ph_index Ph_90err_low Ph_90err_hi  Epeak  Epeak_90err_low  Epeak_90err_hi  Norm       Nomr_90err_low    Norm_90err_hi    chi2    dof
PL      -1.542     -0.609     0.559       -           -               -         1.17e-02     -4.09e-03          3.93e-03      74.510   57
CPL     -0.510     -1.666     0.510       73.537     -57.446       -73.537      3.81e-02     -3.81e-02          8.04e+02      74.120   56


=== Fluence/Peak Flux Summary ===

              Model    Band1     Band2     Band3     Band4     Band5     Total
                       15-25     25-50    50-100    100-350    15-150    15-350    keV
Fluence         PL   9.58e-08  1.55e-07  1.90e-07  4.56e-07  5.70e-07  8.97e-07   erg/cm2
      90%_error_low -2.89e-08 -3.22e-08 -5.91e-08 -2.35e-07 -1.38e-07 -3.04e-07   erg/cm2
      90%_error_hi   3.08e-08  3.22e-08  5.97e-08  3.54e-07  1.43e-07  4.00e-07   erg/cm2
Peak flux       PL   5.01e-01  4.92e-01  3.38e-01  3.65e-01  1.48e+00  1.70e+00   ph/cm2/s
      90%_error_low -2.43e-01 -1.67e-01 -1.47e-01 -2.41e-01 -4.79e-01 -5.55e-01   ph/cm2/s
      90%_error_hi   2.79e-01  1.64e-01  1.43e-01  4.04e-01  4.80e-01  5.66e-01   ph/cm2/s

Fluence        CPL   8.62e-08  1.70e-07  1.95e-07  1.51e-07  5.38e-07  6.02e-07   erg/cm2
      90%_error_low -3.47e-08 -4.10e-08 -6.69e-08 -1.29e-07 -1.42e-07 -2.00e-07   erg/cm2
      90%_error_hi   3.51e-08  4.43e-08  6.71e-08  3.97e-07  1.53e-07  4.40e-07   erg/cm2
Peak flux      CPL   4.09e-01  5.37e-01  3.70e-01  1.45e-01  1.42e+00  1.46e+00   ph/cm2/s
      90%_error_low     N/A   -1.99e-01     N/A   -1.45e-01 -6.38e-01 -6.82e-01   ph/cm2/s
      90%_error_hi      N/A    2.17e-01     N/A    3.04e-01  5.07e-01  7.38e-01   ph/cm2/s

======================================================================
Image
Pre-slew 15.0-350.0 keV image (Event data)
#   RAcent    DECcent   POSerr    Theta     Phi              Peak Cts       SNR   Name
  326.7870   -72.8909   0.0292    41.6116   -43.2779         0.9432681      6.571 TRIG_00811074

Foreground time interval of the image:
  1.656  14.656 (delta_t =  13.000 [sec])
Background time interval of the image:
-239.344   1.656 (delta_t = 241.000 [sec])
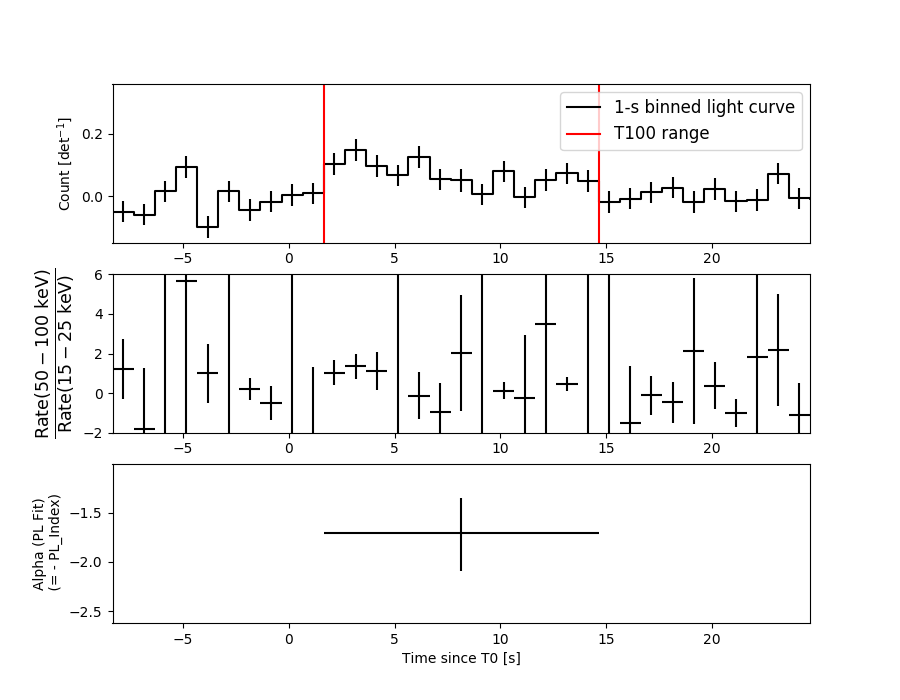
Light Curves
Note: The mask-weighted lightcurves have units of either count/det or counts/sec/det, where a det is 0.4 x 0.4 = 0.16 sq cm.
Full-time range; 1 s binning
Other quick-look light curves:
- 64 ms binning (zoomed)
- 16 ms binning (zoomed)
- 8 ms binning (zoomed)
- 2 ms binning (zoomed)
- SN=5 or 10 s binning (full-time range)
- Raw light curve
Spectra
- 64 ms binning (zoomed)
- 16 ms binning (zoomed)
- 8 ms binning (zoomed)
- 2 ms binning (zoomed)
- SN=5 or 10 s binning (full-time range)
- Raw light curve
Spectra
Notes:
- 1) The fitting includes the systematic errors.
- 2) When the burst includes telescope slew time periods, the fitting uses an average response file made from multiple 5-s response files through out the slew time plus single time preiod for the non-slew times, and weighted by the total counts in the corresponding time period using addrmf. An average response file is needed becuase a spectral fit using the pre-slew DRM will introduce some errors in both a spectral shape and a normalization if the PHA file contains a lot of the slew/post-slew time interval.
- 3) For fits to more complicated models (e.g. a power-law over a cutoff power-law), the BAT team has decided to require a chi-square improvement of more than 6 for each extra dof.
Time averaged spectrum fit using the average DRM
Power-law model
Time interval is from    1.656 sec. to   14.656 sec.

Spectral model in power-law:
------------------------------------------------------------
Parameters  : value       lower 90%   higher 90%
Photon index: -1.70922     ( -0.38459   0.356784 )
Norm@50keV  : 4.74108E-03    ( -0.00112967   0.00109314 )
------------------------------------------------------------
#Fit statistic : Chi-Squared =          59.61 using 59 PHA bins.
# Reduced chi-squared =          1.046 for     57 degrees of freedom
# Null hypothesis probability =   3.807462e-01

Photon flux (15-150 keV)    in 13 sec: 0.631737 ( -0.13163  0.131716 ) ph/cm2/s
Energy fluence (15-150 keV)             : 5.7034e-07 ( -1.38499e-07  1.42633e-07 ) ergs/cm2
Cutoff power-law model
Time interval is from    1.656 sec. to   14.656 sec.
Spectral model in the cutoff power-law:
------------------------------------------------------------
Parameters  : value       lower 90%   higher 90%
Photon index: -0.904527     ( -1.31673   1.94303 )
Epeak [keV] : 63.6963      ( -63.6999 -63.6999 )
Norm@50keV  : 1.27466E-02    ( -0.0127452   0.120377 )
------------------------------------------------------------
#Fit statistic : Chi-Squared =          58.71 using 59 PHA bins.
# Reduced chi-squared =          1.048 for     56 degrees of freedom
# Null hypothesis probability =   3.765028e-01

Photon flux (15-150 keV)    in 13 sec: 0.613728 ( -0.068144  0.135525 ) ph/cm2/s
Energy fluence (15-150 keV)             : 5.37568e-07 ( -1.41934e-07  1.53328e-07 ) ergs/cm2
1-s peak spectrum fit
Power-law model
Time interval is from    2.656 sec. to    3.656 sec.

Spectral model in power-law:
------------------------------------------------------------
Parameters  : value       lower 90%   higher 90%
Photon index: -1.54194     ( -0.608702   0.558522 )
Norm@50keV  : 1.16937E-02    ( -0.00408941   0.00392862 )
------------------------------------------------------------
#Fit statistic : Chi-Squared =          74.51 using 59 PHA bins.
# Reduced chi-squared =          1.307 for     57 degrees of freedom
# Null hypothesis probability =   5.960393e-02

Photon flux (15-150 keV)    in 1 sec: 1.47697 ( -0.479099  0.48024 ) ph/cm2/s
Energy fluence (15-150 keV)             : 1.1023e-07 ( -4.03134e-08  4.16043e-08 ) ergs/cm2
Cutoff power-law model
Time interval is from    2.656 sec. to    3.656 sec.
Spectral model in the cutoff power-law:
------------------------------------------------------------
Parameters  : value       lower 90%   higher 90%
Photon index: -0.51022     ( -1.67794   0.49829 )
Epeak [keV] : 73.5370      ( -57.2186 -73.31 )
Norm@50keV  : 3.80555E-02    ( -0.0388716   804.195 )
------------------------------------------------------------
#Fit statistic : Chi-Squared =          74.12 using 59 PHA bins.
# Reduced chi-squared =          1.324 for     56 degrees of freedom
# Null hypothesis probability =   5.287851e-02

Photon flux (15-150 keV)    in 1 sec: 1.41704 ( -0.637511  0.50747 ) ph/cm2/s
Energy fluence (15-150 keV)             : 1.04179e-07 ( -3.94767e-08  4.44317e-08 ) ergs/cm2
Time-resolved spectra
Distribution
T90 vs. Hardness ratio plot
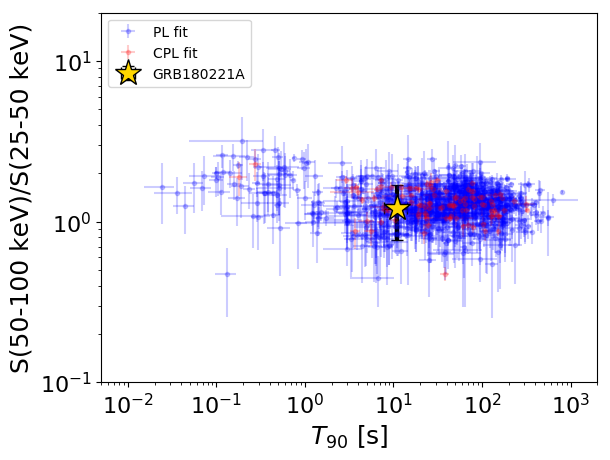
T90                                   = 11.0 sec.
Hardness ratio (energy fluence ratio) = 1.22334739113
S(15-50 keV) vs. S(50-150 keV) plot
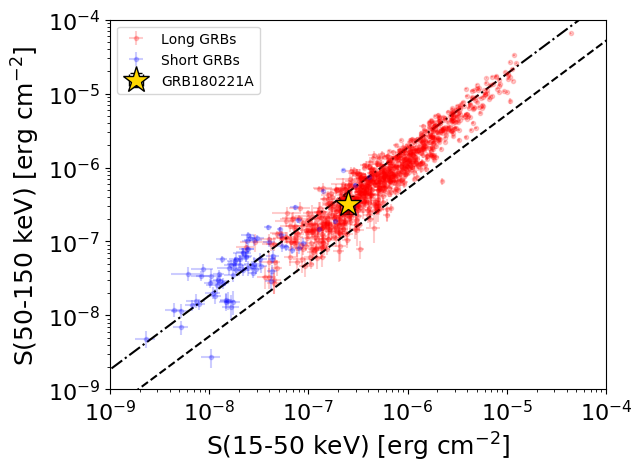
S(15-50 keV)  = 2.5078534e-07
S(50-150 keV) = 3.195575e-07
The dash-dotted line and the dashed line traces the fluences calculated from the Band function with Epeak = 15 and 150 keV, respectively. Both lines assume a canonical values of alpha = -1 and beta = -2.5.
Mask shadow pattern
IMX = 6.466458539785949E-01, IMY = 6.088966623792679E-01
Spacecraft aspect plot
Bright source in the pre-burst/pre-slew/post-slew images
Pre-burst image of 15-350 keV band
Time interval of the image:
-239.344000 1.656000

# RAcent  DECcent POSerr Theta    Phi  PeakCts   SNR AngSep     Name
#  [deg]    [deg]    ['] [deg]  [deg]                   [']
170.1712 -60.8243    0.0  27.8   39.0   0.3576   0.3   12.8	Cen X-3
187.0933 -62.7835    0.0  19.7   35.5  -1.3206  -1.3   12.0	GX 301-2
245.0060 -15.6526    1.6  43.1 -166.4  12.5335   7.3    1.7	Sco X-1
256.1696 -37.8446   13.8  28.1 -132.5   1.1752   0.8    8.7	4U 1700-377
256.2277 -36.2935    5.7  29.3 -134.5   2.8968   2.0   12.7	GX 349+2
263.0871 -24.7851   10.8  42.1 -137.9  -2.3099  -1.1    4.9	GX 1+4
264.8762 -44.5643   42.9  28.3 -112.6   0.4573   0.3    8.9	4U 1735-44
270.3242 -25.0903   10.6  45.6 -129.8  -3.6492  -1.1    2.3	GX 5-1
270.1657 -25.7596   66.6  44.9 -129.4   0.5409   0.2    7.5	GRS 1758-258
275.8251 -30.5058    0.0  44.3 -119.6   4.8974   1.0    9.8	H1820-303
262.9817 -33.8411  122.3  34.7 -129.4  -0.1561  -0.1    0.5	GX 354-0
158.2408 -51.6423    3.8  37.5   50.0   5.5444   3.0 ------	UNKNOWN
 64.9943 -76.4510    3.0  47.4  -11.0   6.5318   3.8 ------	UNKNOWN
299.5028 -61.2421    3.4  38.1  -66.9   9.2072   3.4 ------	UNKNOWN
Pre-slew background subtracted image of 15-350 keV band
Time interval of the image:
1.656000 14.656000

# RAcent  DECcent POSerr Theta    Phi  PeakCts   SNR AngSep     Name
#  [deg]    [deg]    ['] [deg]  [deg]                   [']
170.4578 -60.4213    0.0  27.8   39.9  -0.0147  -0.2   12.8	Cen X-3
186.6438 -62.7304    4.6  19.9   35.7   0.1855   2.5    2.4	GX 301-2
244.9270 -15.6056    8.5  43.1 -166.5   0.1690   1.4    3.7	Sco X-1
255.8788 -37.9086    4.4  27.9 -132.8   0.2359   2.6    6.4	4U 1700-377
256.2278 -36.2937    9.9  29.3 -134.5   0.1075   1.2   12.7	GX 349+2
263.1358 -24.8774    3.6  42.1 -137.7  -0.5009  -3.2   10.5	GX 1+4
264.5044 -44.3618   51.4  28.2 -113.3   0.0246   0.2   11.5	4U 1735-44
270.3630 -25.0180    7.3  45.6 -129.8  -0.3912  -1.6    5.6	GX 5-1
270.3493 -25.8654    7.8  45.0 -129.1   0.3507   1.5    7.8	GRS 1758-258
276.1590 -30.4476    0.0  44.5 -119.4  -0.3802  -1.1   13.0	H1820-303
263.1126 -33.6894    0.0  34.9 -129.4   0.0940   0.8   10.7	GX 354-0
 50.7716 -65.2633    2.3  59.2  -14.1   2.1841   5.0 ------	UNKNOWN
326.7872 -72.8909    1.8  41.6  -43.3   0.9430   6.6 ------	UNKNOWN
Post-slew image of 15-350 keV band
Time interval of the image:
701.956600 954.556600

# RAcent  DECcent POSerr Theta    Phi  PeakCts   SNR AngSep     Name
#  [deg]    [deg]    ['] [deg]  [deg]                   [']
244.9799 -15.6221    0.6  37.2   60.0  12.9786  18.4    1.1	Sco X-1
254.4368  35.3377   15.9  46.0  141.3   0.8220   0.7    1.1	Her X-1
256.0371 -37.9478   73.8  41.2   21.5   0.0814   0.2    6.7	4U 1700-377
256.5514 -36.5709    6.4  39.9   22.3   0.9303   1.8   10.5	GX 349+2
262.8720 -24.6614    7.3  27.3   28.9  -0.5467  -1.6    9.0	GX 1+4
264.8622 -44.5736    6.4  43.4    7.9   0.8828   1.8    9.0	4U 1735-44
268.4929  -1.6209    0.0  12.4   89.9   0.3957   1.3   12.6	SW J1753.5-0127
270.2866 -25.0381    3.2  23.8   15.5   1.0773   3.6    2.5	GX 5-1
270.3113 -25.7060    3.8  24.4   14.7   0.9241   3.1    2.3	GRS 1758-258
274.0417 -14.0330    1.8  12.4   23.2   2.0439   6.5    2.1	GX 17+2
275.9767 -30.2949    4.6  27.2    0.5   0.7087   2.5    5.1	H1820-303
285.0264 -24.9413  524.5  21.8  -19.1   0.0064   0.0    1.4	HT1900.1-2455
288.7966  10.9562    0.7  16.5 -159.7   4.8943  16.3    0.6	GRS 1915+105
299.5683  35.1982    0.5  42.5 -165.6  11.6835  21.2    1.1	Cyg X-1
308.1570  40.9596    4.3  51.0 -162.0   2.1977   2.7    2.2	Cyg X-3
262.8704 -33.6948  230.0  34.5   18.2   0.0208   0.0   10.3	GX 354-0
249.8304 -49.8198    2.6  53.2   15.9   4.9463   4.4 ------	UNKNOWN
283.4350  24.8193    2.1  28.5  176.5   1.7558   5.6 ------	UNKNOWN
314.8915 -19.5266    3.9  37.0  -70.2   2.2907   3.0 ------	UNKNOWN
316.1467 -29.0426    3.3  42.2  -57.5   3.2150   3.5 ------	UNKNOWN
321.9344  -2.7137    3.6  41.1  -98.5   5.1190   3.2 ------	UNKNOWN