Analysis Summary
Notes:
- 1) No attempt has been made to eliminate the non-significant decimal places.
- 2) This batgrbproduct analysis is done using the HEASARC data.
- 3) This batgrbproduct analysis is using the flight position for the mask-weighting calculation.
======================================================================
BAT GRB EVENT DATA PROCESSING REPORT
Process Script Ver: batgrbproduct v2.46
Process Start Time: Thu Apr 5 17:33:55 EDT 2018
Host Name: bat1
Current Working Dir: /local/data/bat1/alien/Swift_3rdBATcatalog/event/batevent_reproc/trigger814129
======================================================================
Trigger: 00814129 Segment: 000
BAT Trigger Time: 542681032 [s; MET]
Trigger Stop: 542681112 [s; MET]
UTC: 2018-03-14T00:43:31.380160 [includes UTCF correction]
Where From?: TDRSS position message
BAT
RA: 99.2763679701429 Dec: -24.4913623818303 [deg; J2000]
Catalogged Source?: NO
Point Source?: YES
GRB Indicated?: YES [ by BAT flight software ]
Image S/N Ratio: 24.03
Image Trigger?: YES
Rate S/N Ratio: 0 [ if not an image trigger ]
Image S/N Ratio: 24.03
Analysis Position: [ source = BAT ]
RA: 99.2763679701429 Dec: -24.4913623818303 [deg; J2000]
Refined Position: [ source = BAT pre-slew burst ]
RA: 99.1732334323054 Dec: -24.4947268784979 [deg; J2000]
{ 06h 36m 41.6s , -24d 29' 41.0" }
+/- 4.04925336751762 [arcmin] (estimated 90% radius based on SNR)
+/- 2.78554184029276 [arcmin] (formal 1-sigma fit error)
SNR: 4.12515125330775
Angular difference between the analysis and refined position is 5.634835 arcmin
Partial Coding Fraction: 0.2480469 [ including projection effects ]
Duration
T90: 50.4640001058578 +/- 21.8358736047547
Measured from: -9.78400003910065
to: 40.6800000667572 [s; relative to TRIGTIME]
T50: 10.6879999637604 +/- 0.622356892166234
Measured from: -1.55999994277954
to: 9.12800002098083 [s; relative to TRIGTIME]
Fluence
Peak Flux (peak 1 second)
Measured from: 3.05200004577637
to: 4.05200004577637 [s; relative to TRIGTIME]
Total Fluence
Measured from: -11.7999999523163
to: 109.751999974251 [s; relative to TRIGTIME]
Band 1 Band 2 Band 3 Band 4
15-25 25-50 50-100 100-350 keV
Total 3.631610 6.073553 5.015320 1.128197
0.150602 0.162107 0.143499 0.115581 [error]
Peak 0.167392 0.401908 0.324622 0.030710
0.018937 0.023833 0.021396 0.012183 [error]
[ fluence units of on-axis counts / fully illuminated detector ]
======================================================================
====== Table of the duration information =============================
Value tstart tstop
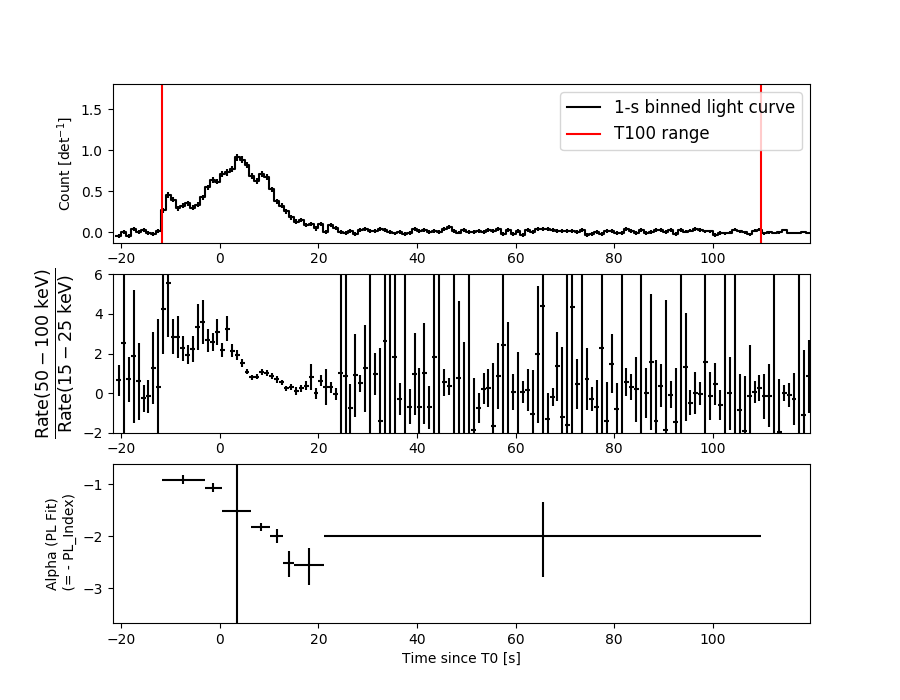
T100 121.552 -11.800 109.752
T90 50.464 -9.784 40.680
T50 10.688 -1.560 9.128
Peak 1.000 3.052 4.052
====== Spectral Analysis Summary =====================================
Model : spectral model: simple power-law (PL) and cutoff power-law (CPL)
Ph_index : photon index: E^{Ph_index}
Ph_90err : 90% error of the photon index
Epeak : Epeak in keV
Epeak_90err: 90% error of Epeak
Norm : normalization at 50 keV in both the PL model and CPL model
Nomr_90err : 90% error of the normalization
chi2 : Chi-Squared
dof : degree of freedo
=== Time-averaged spectral analysis ===
(Best model with acceptable fit: CPL)
Model Ph_index Ph_90err_low Ph_90err_hi Epeak Epeak_90err_low Epeak_90err_hi Norm Nomr_90err_low Norm_90err_hi chi2 dof
PL -1.509 -0.055 0.055 - - - 9.54e-03 -3.00e-04 3.00e-04 74.310 57
CPL -0.841 -0.239 0.252 94.190 -12.251 22.880 1.95e-02 -4.32e-03 5.91e-03 49.420 56
=== 1-s peak spectral analysis ===
(Best model with acceptable fit: CPL)
Model Ph_index Ph_90err_low Ph_90err_hi Epeak Epeak_90err_low Epeak_90err_hi Norm Nomr_90err_low Norm_90err_hi chi2 dof
PL -1.533 -0.101 0.100 - - - 6.28e-02 -4.57e-03 4.57e-03 95.550 57
CPL 0.813 -0.615 0.704 62.505 -4.696 5.946 8.98e-01 -4.40e-01 1.03e+00 39.340 56
=== Fluence/Peak Flux Summary ===
Model Band1 Band2 Band3 Band4 Band5 Total
15-25 25-50 50-100 100-350 15-150 15-350 keV
Fluence PL 1.49e-06 2.73e-06 3.84e-06 1.13e-05 1.10e-05 1.94e-05 erg/cm2
90%_error_low -8.80e-08 -9.78e-08 -1.45e-07 -9.11e-07 -3.61e-07 -1.01e-06 erg/cm2
90%_error_hi 8.97e-08 9.76e-08 1.45e-07 9.62e-07 3.62e-07 1.04e-06 erg/cm2
Peak flux PL 2.67e+00 2.63e+00 1.82e+00 1.98e+00 7.91e+00 9.11e+00 ph/cm2/s
90%_error_low -2.94e-01 -2.02e-01 -1.53e-01 -2.94e-01 -5.87e-01 -6.58e-01 ph/cm2/s
90%_error_hi 3.03e-01 2.02e-01 1.52e-01 3.17e-01 5.87e-01 6.58e-01 ph/cm2/s
Fluence CPL 1.28e-06 2.86e-06 4.07e-06 5.20e-06 1.06e-05 1.34e-05 erg/cm2
90%_error_low -1.09e-07 -1.12e-07 -1.70e-07 -1.12e-06 -3.90e-07 -1.17e-06 erg/cm2
90%_error_hi 1.11e-07 1.12e-07 1.71e-07 1.51e-06 3.90e-07 1.52e-06 erg/cm2
Peak flux CPL 1.72e+00 3.28e+00 2.36e+00 4.57e-01 7.75e+00 7.81e+00 ph/cm2/s
90%_error_low -3.39e-01 -2.74e-01 -2.18e-01 -1.51e-01 -5.88e-01 -6.05e-01 ph/cm2/s
90%_error_hi 3.56e-01 2.78e-01 2.22e-01 1.94e-01 5.91e-01 6.10e-01 ph/cm2/s
======================================================================
Image
Pre-slew 15.0-350.0 keV image (Event data)
#   RAcent    DECcent   POSerr    Theta     Phi              Peak Cts       SNR   Name
   99.1732   -24.4947   0.0464    42.2874    35.7193        19.1180942      4.125 TRIG_00814129

Foreground time interval of the image:
-11.800  88.101 (delta_t =  99.901 [sec])
Background time interval of the image:
-12.099 -11.800 (delta_t =   0.299 [sec])
Light Curves
Note: The mask-weighted lightcurves have units of either count/det or counts/sec/det, where a det is 0.4 x 0.4 = 0.16 sq cm.
Full-time range; 1 s binning
Other quick-look light curves:
- 64 ms binning (zoomed)
- 16 ms binning (zoomed)
- 8 ms binning (zoomed)
- 2 ms binning (zoomed)
- SN=5 or 10 s binning (full-time range)
- Raw light curve
Spectra
- 64 ms binning (zoomed)
- 16 ms binning (zoomed)
- 8 ms binning (zoomed)
- 2 ms binning (zoomed)
- SN=5 or 10 s binning (full-time range)
- Raw light curve
Spectra
Notes:
- 1) The fitting includes the systematic errors.
- 2) When the burst includes telescope slew time periods, the fitting uses an average response file made from multiple 5-s response files through out the slew time plus single time preiod for the non-slew times, and weighted by the total counts in the corresponding time period using addrmf. An average response file is needed becuase a spectral fit using the pre-slew DRM will introduce some errors in both a spectral shape and a normalization if the PHA file contains a lot of the slew/post-slew time interval.
- 3) For fits to more complicated models (e.g. a power-law over a cutoff power-law), the BAT team has decided to require a chi-square improvement of more than 6 for each extra dof.
Time averaged spectrum fit using the average DRM
Power-law model
Time interval is from  -11.800 sec. to  109.752 sec.

Spectral model in power-law:
------------------------------------------------------------
Parameters  : value       lower 90%   higher 90%
Photon index: -1.50887     ( -0.0547654   0.0547751 )
Norm@50keV  : 9.54089E-03    ( -0.000300451   0.000300444 )
------------------------------------------------------------
#Fit statistic : Chi-Squared =          74.31 using 59 PHA bins.
# Reduced chi-squared =          1.304 for     57 degrees of freedom
# Null hypothesis probability =   6.152088e-02

Photon flux (15-150 keV)    in 121.6 sec: 1.19397 ( -0.04111  0.04122 ) ph/cm2/s
Energy fluence (15-150 keV)             : 1.09917e-05 ( -3.61415e-07  3.61933e-07 ) ergs/cm2
Cutoff power-law model
Time interval is from  -11.800 sec. to  109.752 sec.
Spectral model in the cutoff power-law:
------------------------------------------------------------
Parameters  : value       lower 90%   higher 90%
Photon index: -0.840543     ( -0.239058   0.252257 )
Epeak [keV] : 94.1900      ( -12.2507 22.8796 )
Norm@50keV  : 1.95499E-02    ( -0.00432112   0.00590558 )
------------------------------------------------------------
#Fit statistic : Chi-Squared =          49.42 using 59 PHA bins.
# Reduced chi-squared =         0.8826 for     56 degrees of freedom
# Null hypothesis probability =   7.203264e-01

Photon flux (15-150 keV)    in 121.6 sec: 1.14839 ( -0.04359  0.04375 ) ph/cm2/s
Energy fluence (15-150 keV)             : 1.06046e-05 ( -3.90397e-07  3.89621e-07 ) ergs/cm2
1-s peak spectrum fit
Power-law model
Time interval is from    3.052 sec. to    4.052 sec.

Spectral model in power-law:
------------------------------------------------------------
Parameters  : value       lower 90%   higher 90%
Photon index: -1.53271     ( -0.101095   0.099945 )
Norm@50keV  : 6.28088E-02    ( -0.00457525   0.00457045 )
------------------------------------------------------------
#Fit statistic : Chi-Squared =          95.55 using 59 PHA bins.
# Reduced chi-squared =          1.676 for     57 degrees of freedom
# Null hypothesis probability =   1.046342e-03

Photon flux (15-150 keV)    in 1 sec: 7.91217 ( -0.58686  0.58737 ) ph/cm2/s
Energy fluence (15-150 keV)             : 5.92871e-07 ( -4.52123e-08  4.53484e-08 ) ergs/cm2
Cutoff power-law model
Time interval is from    3.052 sec. to    4.052 sec.
Spectral model in the cutoff power-law:
------------------------------------------------------------
Parameters  : value       lower 90%   higher 90%
Photon index: 0.813078     ( -0.615479   0.703763 )
Epeak [keV] : 62.5052      ( -4.69576 5.94635 )
Norm@50keV  : 0.897858    ( -0.440297   1.0349 )
------------------------------------------------------------
#Fit statistic : Chi-Squared =          39.34 using 59 PHA bins.
# Reduced chi-squared =         0.7024 for     56 degrees of freedom
# Null hypothesis probability =   9.554803e-01

Photon flux (15-150 keV)    in 1 sec: 7.74953 ( -0.58788  0.59062 ) ph/cm2/s
Energy fluence (15-150 keV)             : 5.78189e-07 ( -4.59705e-08  4.63219e-08 ) ergs/cm2
Time-resolved spectra
Distribution
T90 vs. Hardness ratio plot

T90                                   = 50.464 sec.
Hardness ratio (energy fluence ratio) = 1.42059378168
S(15-50 keV) vs. S(50-150 keV) plot
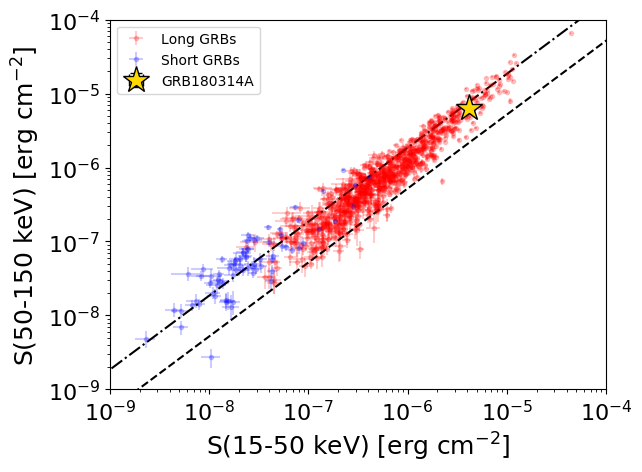
S(15-50 keV)  = 4.146311e-06
S(50-150 keV) = 6.458413e-06
The dash-dotted line and the dashed line traces the fluences calculated from the Band function with Epeak = 15 and 150 keV, respectively. Both lines assume a canonical values of alpha = -1 and beta = -2.5.
Mask shadow pattern
IMX = 7.384328718997748E-01, IMY = -5.309956329835059E-01
Spacecraft aspect plot
Bright source in the pre-burst/pre-slew/post-slew images
Pre-burst image of 15-350 keV band
Time interval of the image:
-12.099400 -11.800000

# RAcent  DECcent POSerr Theta    Phi  PeakCts   SNR AngSep     Name
#  [deg]    [deg]    ['] [deg]  [deg]                   [']
170.5756 -60.7101    5.6  41.8  131.5   0.0429   2.1    9.3	Cen X-3
186.5926 -62.7290    4.2  45.0  141.9  -0.0599  -2.7    3.0	GX 301-2
 78.5746  -6.2919    2.2  57.0    5.6   0.1914   5.2 ------	UNKNOWN
 68.6706  -4.9387    2.6  58.2   -6.1   0.1605   4.5 ------	UNKNOWN
 55.9765 -42.3872    2.0  22.8  -34.3   0.0396   5.9 ------	UNKNOWN
 57.0782 -18.4825    1.8  45.8  -22.2   0.0730   6.3 ------	UNKNOWN
298.5713 -56.9241    2.8  54.8 -153.0   0.1080   4.1 ------	UNKNOWN
Pre-slew background subtracted image of 15-350 keV band
Time interval of the image:
-11.800000 88.100610

# RAcent  DECcent POSerr Theta    Phi  PeakCts   SNR AngSep     Name
#  [deg]    [deg]    ['] [deg]  [deg]                   [']
170.1997 -60.5559    5.8  41.8  131.5 -13.5682  -2.0    5.3	Cen X-3
186.2248 -62.6667    0.0  45.0  142.0  19.9768   2.8   13.4	GX 301-2
130.6763 -62.0995    2.5  25.9  113.1  13.5505   4.7 ------	UNKNOWN
218.2034 -63.2708    2.5  51.2  159.5  44.0158   4.7 ------	UNKNOWN
 64.0500 -22.4571    2.0  40.9  -13.6  17.6751   5.8 ------	UNKNOWN
Post-slew image of 15-350 keV band
Time interval of the image:
148.300590 963.175900

# RAcent  DECcent POSerr Theta    Phi  PeakCts   SNR AngSep     Name
#  [deg]    [deg]    ['] [deg]  [deg]                   [']
 83.6187  22.0244    0.4  48.9  -10.2  30.2758  26.6    1.0	Crab
135.5016 -40.5340   80.6  34.2  136.0  -0.1439  -0.1    1.7	Vela X-1
137.9006 -23.2342    4.5  35.2  105.2   3.7413   2.6 ------	UNKNOWN
 87.6550 -74.7010    2.8  50.6 -167.0   6.8499   4.1 ------	UNKNOWN
 86.0645 -81.8923    3.1  57.6 -168.7  14.7145   3.7 ------	UNKNOWN
 79.7470  -7.7627    2.5  25.1  -42.3   3.2353   4.6 ------	UNKNOWN
 67.4447  -0.7009    2.8  38.9  -48.0   4.5014   4.2 ------	UNKNOWN
 64.5806  10.0280    3.4  48.3  -39.5   6.4086   3.4 ------	UNKNOWN
 62.5381   7.0060    3.7  47.7  -44.3   6.7014   3.1 ------	UNKNOWN
 61.3456  13.0631    2.4  52.7  -39.7  13.5007   4.7 ------	UNKNOWN
 46.2448 -52.4532    2.8  48.5 -130.4  13.1996   4.2 ------	UNKNOWN
 48.8511 -45.1888    2.8  45.3 -121.1  10.7865   4.1 ------	UNKNOWN