Analysis Summary
Notes:
- 1) No attempt has been made to eliminate the non-significant decimal places.
- 2) This batgrbproduct analysis is done using the HEASARC data.
- 3) This batgrbproduct analysis is using the flight position for the mask-weighting calculation.
======================================================================
BAT GRB EVENT DATA PROCESSING REPORT
Process Script Ver: batgrbproduct v2.46
Process Start Time: Thu Apr 5 17:30:51 EDT 2018
Host Name: bat1
Current Working Dir: /local/data/bat1/alien/Swift_3rdBATcatalog/event/batevent_reproc/trigger814305
======================================================================
Trigger: 00814305 Segment: 000
BAT Trigger Time: 542759037.568 [s; MET]
Trigger Stop: 542759038.592 [s; MET]
UTC: 2018-03-14T22:23:36.943440 [includes UTCF correction]
Where From?: TDRSS position message
BAT
RA: 297.866097981945 Dec: 23.6232874833055 [deg; J2000]
Catalogged Source?: NO
Point Source?: YES
GRB Indicated?: YES [ by BAT flight software ]
Image S/N Ratio: 7.74
Image Trigger?: NO
Rate S/N Ratio: 6.6332495807108 [ if not an image trigger ]
Image S/N Ratio: 7.74
Analysis Position: [ source = BAT ]
RA: 297.866097981945 Dec: 23.6232874833055 [deg; J2000]
Refined Position: [ source = BAT pre-slew burst ]
RA: 297.858782792225 Dec: 23.6437538156809 [deg; J2000]
{ 19h 51m 26.1s , +23d 38' 37.5" }
+/- 1.9876312547135 [arcmin] (estimated 90% radius based on SNR)
+/- 0.701973818371764 [arcmin] (formal 1-sigma fit error)
SNR: 11.4005119818874
Angular difference between the analysis and refined position is 1.292137 arcmin
Partial Coding Fraction: 0.6640625 [ including projection effects ]
Duration
T90: 55.4240000247955 +/- 6.53960234232175
Measured from: -44.9279999732971
to: 10.4960000514984 [s; relative to TRIGTIME]
T50: 23.3919999599457 +/- 18.9169824036978
Measured from: -18.191999912262
to: 5.20000004768372 [s; relative to TRIGTIME]
Fluence
Peak Flux (peak 1 second)
Measured from: -0.347999930381775
to: 0.652000069618225 [s; relative to TRIGTIME]
Total Fluence
Measured from: -51.1200000047684
to: 11.9359999895096 [s; relative to TRIGTIME]
Band 1 Band 2 Band 3 Band 4
15-25 25-50 50-100 100-350 keV
Total 0.683231 0.646664 0.288378 -0.037625
0.074392 0.071904 0.060031 0.048489 [error]
Peak 0.061192 0.044882 0.032422 0.004851
0.010392 0.009564 0.007791 0.006060 [error]
[ fluence units of on-axis counts / fully illuminated detector ]
======================================================================
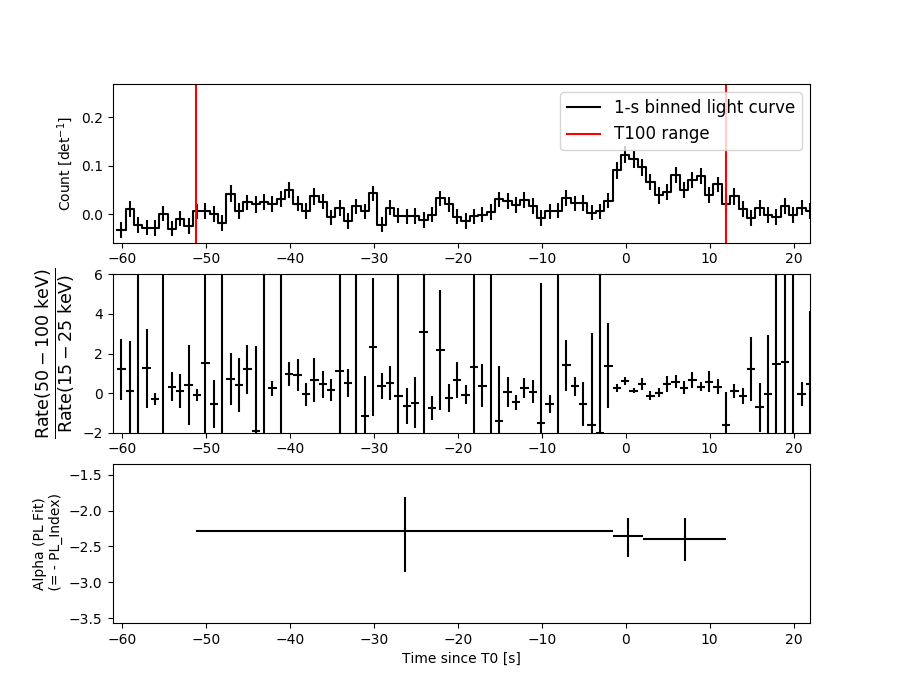
====== Table of the duration information =============================
Value tstart tstop
T100 63.056 -51.120 11.936
T90 55.424 -44.928 10.496
T50 23.392 -18.192 5.200
Peak 1.000 -0.348 0.652
====== Spectral Analysis Summary =====================================
Model : spectral model: simple power-law (PL) and cutoff power-law (CPL)
Ph_index : photon index: E^{Ph_index}
Ph_90err : 90% error of the photon index
Epeak : Epeak in keV
Epeak_90err: 90% error of Epeak
Norm : normalization at 50 keV in both the PL model and CPL model
Nomr_90err : 90% error of the normalization
chi2 : Chi-Squared
dof : degree of freedo
=== Time-averaged spectral analysis ===
(Best model with acceptable fit: PL)
Model Ph_index Ph_90err_low Ph_90err_hi Epeak Epeak_90err_low Epeak_90err_hi Norm Nomr_90err_low Norm_90err_hi chi2 dof
PL -2.346 -0.265 0.242 - - - 1.37e-03 -2.57e-04 2.52e-04 53.120 57
CPL -1.573 -0.427 1.313 20.724 N/A N/A 4.11e-03 N/A N/A 51.250 56
=== 1-s peak spectral analysis ===
(Best model with acceptable fit: PL)
Model Ph_index Ph_90err_low Ph_90err_hi Epeak Epeak_90err_low Epeak_90err_hi Norm Nomr_90err_low Norm_90err_hi chi2 dof
PL -2.210 -0.422 0.364 - - - 7.81e-03 -2.15e-03 2.04e-03 58.090 57
CPL -1.918 N/A N/A 12.474 N/A N/A 1.14e-02 N/A N/A 57.970 56
=== Fluence/Peak Flux Summary ===
Model Band1 Band2 Band3 Band4 Band5 Total
15-25 25-50 50-100 100-350 15-150 15-350 keV
Fluence PL 2.46e-07 2.71e-07 2.13e-07 2.77e-07 8.33e-07 1.01e-06 erg/cm2
90%_error_low -3.90e-08 -3.63e-08 -5.25e-08 -1.12e-07 -1.24e-07 -1.91e-07 erg/cm2
90%_error_hi 3.97e-08 3.58e-08 5.55e-08 1.54e-07 1.28e-07 2.20e-07 erg/cm2
Peak flux PL 6.39e-01 4.24e-01 1.83e-01 1.09e-01 1.30e+00 1.35e+00 ph/cm2/s
90%_error_low -1.67e-01 -8.31e-02 -6.38e-02 -5.84e-02 -2.51e-01 -2.61e-01 ph/cm2/s
90%_error_hi 1.75e-01 8.26e-02 6.58e-02 8.72e-02 2.51e-01 2.61e-01 ph/cm2/s
Fluence CPL N/A N/A N/A N/A N/A N/A erg/cm2
90%_error_low -3.90e-08 -3.63e-08 -5.25e-08 -1.12e-07 -1.24e-07 -1.91e-07 erg/cm2
90%_error_hi 3.97e-08 3.58e-08 5.55e-08 1.54e-07 1.28e-07 2.20e-07 erg/cm2
Peak flux CPL 6.20e-01 4.38e-01 1.85e-01 7.97e-02 1.29e+00 1.32e+00 ph/cm2/s
90%_error_low N/A N/A -6.77e-02 -7.97e-02 -2.54e-01 N/A ph/cm2/s
90%_error_hi N/A N/A 6.91e-02 1.04e-01 2.48e-01 N/A ph/cm2/s
======================================================================
Image
Pre-slew 15.0-350.0 keV image (Event data)
#   RAcent    DECcent   POSerr    Theta     Phi              Peak Cts       SNR   Name
  297.8588    23.6438   0.0168    33.3038  -152.6777         2.0300866     11.401 TRIG_00814305

Foreground time interval of the image:
-51.120  11.936 (delta_t =  63.056 [sec])
Background time interval of the image:
-129.467 -51.120 (delta_t =  78.347 [sec])
Light Curves
Note: The mask-weighted lightcurves have units of either count/det or counts/sec/det, where a det is 0.4 x 0.4 = 0.16 sq cm.
Full-time range; 1 s binning
Other quick-look light curves:
- 64 ms binning (zoomed)
- 16 ms binning (zoomed)
- 8 ms binning (zoomed)
- 2 ms binning (zoomed)
- SN=5 or 10 s binning (full-time range)
- Raw light curve
Spectra
- 64 ms binning (zoomed)
- 16 ms binning (zoomed)
- 8 ms binning (zoomed)
- 2 ms binning (zoomed)
- SN=5 or 10 s binning (full-time range)
- Raw light curve
Spectra
Notes:
- 1) The fitting includes the systematic errors.
- 2) When the burst includes telescope slew time periods, the fitting uses an average response file made from multiple 5-s response files through out the slew time plus single time preiod for the non-slew times, and weighted by the total counts in the corresponding time period using addrmf. An average response file is needed becuase a spectral fit using the pre-slew DRM will introduce some errors in both a spectral shape and a normalization if the PHA file contains a lot of the slew/post-slew time interval.
- 3) For fits to more complicated models (e.g. a power-law over a cutoff power-law), the BAT team has decided to require a chi-square improvement of more than 6 for each extra dof.
Time averaged spectrum fit using the average DRM
Power-law model
Time interval is from  -51.120 sec. to   11.936 sec.

Spectral model in power-law:
------------------------------------------------------------
Parameters  : value       lower 90%   higher 90%
Photon index: -2.34627     ( -0.265386   0.242233 )
Norm@50keV  : 1.36974E-03    ( -0.000256972   0.000251898 )
------------------------------------------------------------
#Fit statistic : Chi-Squared =          53.12 using 59 PHA bins.
# Reduced chi-squared =         0.9320 for     57 degrees of freedom
# Null hypothesis probability =   6.213302e-01

Photon flux (15-150 keV)    in 63.06 sec: 0.245721 ( -0.030457  0.030459 ) ph/cm2/s
Energy fluence (15-150 keV)             : 8.33054e-07 ( -1.24286e-07  1.27947e-07 ) ergs/cm2
Cutoff power-law model
Time interval is from  -51.120 sec. to   11.936 sec.
Spectral model in the cutoff power-law:
------------------------------------------------------------
Parameters  : value       lower 90%   higher 90%
Photon index: -1.57291     ( -0.427269   1.3126 )
Epeak [keV] : 20.7242      (   )
Norm@50keV  : 4.11126E-03    (     )
------------------------------------------------------------
#Fit statistic : Chi-Squared =          51.25 using 59 PHA bins.
# Reduced chi-squared =         0.9152 for     56 degrees of freedom
# Null hypothesis probability =   6.549154e-01

Photon flux (15-150 keV)    in 63.06 sec: 0.240354 ( -0.030982  0.031074 ) ph/cm2/s
Energy fluence (15-150 keV)             : 0 ( 0  0 ) ergs/cm2
1-s peak spectrum fit
Power-law model

Time interval is from   -0.348 sec. to    0.652 sec.

Spectral model in power-law:
------------------------------------------------------------
Parameters  : value       lower 90%   higher 90%
Photon index: -2.21027     ( -0.421672   0.364219 )
Norm@50keV  : 7.80730E-03    ( -0.00214982   0.00203505 )
------------------------------------------------------------
#Fit statistic : Chi-Squared =          58.09 using 59 PHA bins.
# Reduced chi-squared =          1.019 for     57 degrees of freedom
# Null hypothesis probability =   4.348104e-01

Photon flux (15-150 keV)    in 1 sec: 1.29967 ( -0.25068  0.25081 ) ph/cm2/s
Energy fluence (15-150 keV)             : 7.35275e-08 ( -1.676e-08  1.72838e-08 ) ergs/cm2
Cutoff power-law model
Time interval is from   -0.348 sec. to    0.652 sec.
Spectral model in the cutoff power-law:
------------------------------------------------------------
Parameters  : value       lower 90%   higher 90%
Photon index: -1.9179     (       )
Epeak [keV] : 12.4742      (   )
Norm@50keV  : 1.13781E-02    (     )
------------------------------------------------------------
#Fit statistic : Chi-Squared =          57.97 using 59 PHA bins.
# Reduced chi-squared =          1.035 for     56 degrees of freedom
# Null hypothesis probability =   4.026600e-01

Photon flux (15-150 keV)    in 1 sec: 1.28900 ( -0.25357  0.24837 ) ph/cm2/s
Energy fluence (15-150 keV)             : 0 ( 0  0 ) ergs/cm2
Time-resolved spectra
Distribution
T90 vs. Hardness ratio plot
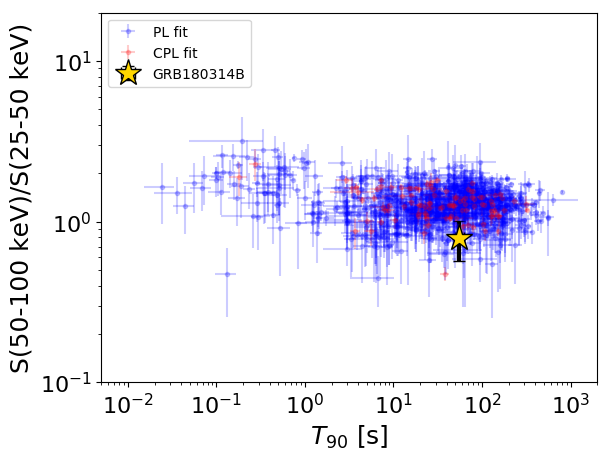
T90                                   = 55.424 sec.
Hardness ratio (energy fluence ratio) = 0.786665550033
S(15-50 keV) vs. S(50-150 keV) plot
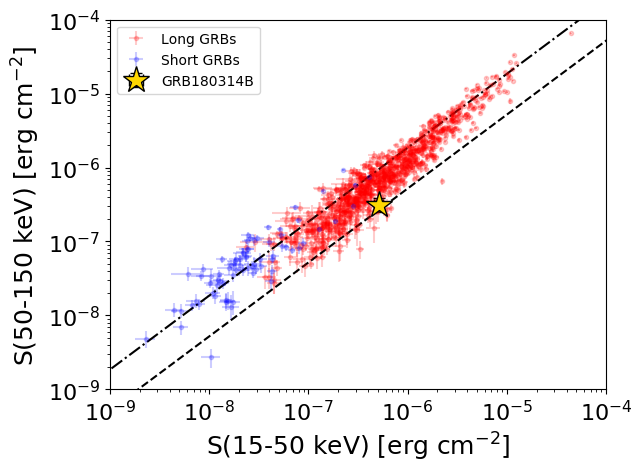
S(15-50 keV)  = 5.168653e-07
S(50-150 keV) = 3.161892e-07
The dash-dotted line and the dashed line traces the fluences calculated from the Band function with Epeak = 15 and 150 keV, respectively. Both lines assume a canonical values of alpha = -1 and beta = -2.5.
Mask shadow pattern
IMX = -5.836790542854300E-01, IMY = 3.015471837407213E-01
Spacecraft aspect plot
Bright source in the pre-burst/pre-slew/post-slew images
Pre-burst image of 15-350 keV band
Time interval of the image:
-129.467410 -51.120000

# RAcent  DECcent POSerr Theta    Phi  PeakCts   SNR AngSep     Name
#  [deg]    [deg]    ['] [deg]  [deg]                   [']
244.9519 -15.6344    1.7  36.4   67.4   2.0483   6.9    1.6	Sco X-1
254.3186  35.3881    7.0  47.2  148.0  -0.7700  -1.7    7.3	Her X-1
256.0113 -37.8846    2.5  39.7   27.8   1.0212   4.6    2.7	4U 1700-377
256.5817 -36.5137   12.2  38.4   28.6  -0.2157  -0.9    8.9	GX 349+2
262.9775 -24.7778    3.9  25.9   35.5   0.4315   3.0    2.6	GX 1+4
264.6040 -44.4220    9.8  41.8   14.1  -0.2525  -1.2    6.2	4U 1735-44
268.5081  -1.6057  204.7  12.3  102.6  -0.0079  -0.1   12.4	SW J1753.5-0127
270.1412 -24.9161    7.4  22.2   22.3   0.2237   1.6   12.5	GX 5-1
270.2080 -25.8026    3.2  23.0   21.1   0.5169   3.6    6.2	GRS 1758-258
273.8628 -13.8762    0.0  11.0   32.3   0.0698   0.5   12.7	GX 17+2
275.9683 -30.4188    7.9  25.8    5.9   0.2038   1.5    3.8	H1820-303
285.1823 -25.0713   14.3  20.7  -15.3  -0.1110  -0.8   12.1	HT1900.1-2455
288.7948  10.9553    1.4  18.0 -155.0   1.1189   8.4    0.6	GRS 1915+105
299.6040  35.1761    1.2  44.0 -160.0   2.3574   9.7    1.7	Cyg X-1
308.2257  40.9231    9.4  52.5 -156.4   0.5475   1.2    5.5	Cyg X-3
263.0075 -33.8260   49.1  33.1   24.2   0.0422   0.2    1.1	GX 354-0
275.0926   7.1923    0.4  13.2  153.8   3.6355  26.8 ------	UNKNOWN
281.2686  52.1879    2.5  57.1  177.9   4.1415   4.6 ------	UNKNOWN
320.7358  22.3895    2.7  48.0 -129.1   2.7747   4.2 ------	UNKNOWN
Pre-slew background subtracted image of 15-350 keV band
Time interval of the image:
-51.120000 11.936000

# RAcent  DECcent POSerr Theta    Phi  PeakCts   SNR AngSep     Name
#  [deg]    [deg]    ['] [deg]  [deg]                   [']
244.8671 -15.5828    7.3  36.4   67.5  -0.4795  -1.6    7.4	Sco X-1
254.3339  35.2705   11.9  47.1  147.9   0.4374   1.0    7.4	Her X-1
256.0476 -37.8053    4.4  39.6   27.8  -0.6279  -2.6    3.7	4U 1700-377
256.3751 -36.4919    5.1  38.5   28.9   0.5050   2.3    5.1	GX 349+2
262.9224 -24.8787    9.5  26.0   35.4  -0.1936  -1.2    9.3	GX 1+4
264.5661 -44.5723    0.0  42.0   14.0   0.1471   0.6   10.5	4U 1735-44
268.2641  -1.4409    6.4  12.6  103.0   0.2598   1.8    6.3	SW J1753.5-0127
270.1199 -25.1988    3.7  22.5   22.0   0.4215   3.1   11.5	GX 5-1
270.1583 -25.8054    5.9  23.0   21.2  -0.2788  -2.0    8.6	GRS 1758-258
274.0184 -14.0748    6.4  11.1   31.1   0.2302   1.8    2.4	GX 17+2
276.0810 -30.3816   12.8  25.8    5.7  -0.1346  -0.9    8.1	H1820-303
285.1852 -25.0550    6.2  20.6  -15.3  -0.2535  -1.9   11.4	HT1900.1-2455
288.7892  10.7971   11.6  17.8 -154.7   0.1360   1.0    8.9	GRS 1915+105
299.4549  35.3272    7.5  44.1 -160.2   0.3863   1.5   10.0	Cyg X-1
308.1551  40.9660   23.4  52.5 -156.4  -0.2378  -0.5    2.2	Cyg X-3
262.8244 -33.9100   11.9  33.2   24.3   0.1730   1.0    9.4	GX 354-0
243.7156  14.2150    2.7  41.1  115.5   2.2340   4.3 ------	UNKNOWN
267.2594 -39.0105    2.2  36.1   14.6   0.9246   5.2 ------	UNKNOWN
286.5631  46.2648    2.3  51.5 -177.3   2.1181   5.0 ------	UNKNOWN
297.8588  23.6438    1.0  33.3 -152.7   2.0299  11.4 ------	UNKNOWN
Post-slew image of 15-350 keV band
Time interval of the image:
73.732630 962.532000

# RAcent  DECcent POSerr Theta    Phi  PeakCts   SNR AngSep     Name
#  [deg]    [deg]    ['] [deg]  [deg]                   [']
254.6367  35.3998    6.4  39.1  100.9  -4.7788  -1.8    9.4	Her X-1
268.3168  -1.4052    7.0  38.1   36.3   2.4644   1.7    4.2	SW J1753.5-0127
270.1968 -24.9909   14.0  55.5   13.9  -3.3600  -0.8    7.1	GX 5-1
270.3492 -25.8179   10.3  56.1   13.3   5.0830   1.1    5.2	GRS 1758-258
274.0526 -14.0708   14.0  44.3   17.3   1.2806   0.8    3.4	GX 17+2
285.1733 -24.8480    5.4  50.0   -1.7  -3.8429  -2.1    8.6	HT1900.1-2455
288.8084  10.9391    0.9  15.3   19.0  10.8718  12.9    0.7	GRS 1915+105
299.5870  35.2044    0.3  11.7  170.3  32.5102  35.9    0.2	Cyg X-1
308.0772  40.9924    1.8  19.4 -172.9   5.3500   6.5    2.8	Cyg X-3
326.1543  38.5075    8.0  28.3 -145.2  -1.5022  -1.4   11.2	Cyg X-2
275.0793   7.1896    0.3  27.3   40.0  39.9758  39.6 ------	UNKNOWN
293.6823   8.3970    2.4  15.7   -1.4   4.1346   4.7 ------	UNKNOWN
352.1337  69.4938    2.8  55.8 -176.6  16.9962   4.1 ------	UNKNOWN
348.2288  38.9357    2.5  45.1 -138.9  10.2861   4.6 ------	UNKNOWN
343.3148  19.0306    3.3  42.4 -109.6  16.2030   3.5 ------	UNKNOWN