Analysis Summary
Notes:
- 1) No attempt has been made to eliminate the non-significant decimal places.
- 2) This batgrbproduct analysis is done using the HEASARC data.
- 3) This batgrbproduct analysis is using the flight position for the mask-weighting calculation.
======================================================================
                  BAT GRB EVENT DATA PROCESSING REPORT
    Process Script Ver: batgrbproduct v2.46
    Process Start Time: Thu Apr  5 17:28:01 EDT 2018
             Host Name: bat1
   Current Working Dir: /local/data/bat1/alien/Swift_3rdBATcatalog/event/batevent_reproc/trigger814677
======================================================================

  Trigger: 00814677      Segment: 000

  BAT Trigger Time: 542869065.728   [s; MET]
      Trigger Stop: 542869067.776   [s; MET]
               UTC: 2018-03-16T04:57:25.096800    [includes UTCF correction]
       Where From?: TDRSS position message

  BAT
    RA: 265.436483229163   Dec: 0.736518945680564  [deg; J2000]

     Catalogged Source?: NO
     Point Source?:      YES
     GRB Indicated?:     YES    [ by BAT flight software ]
     Image S/N Ratio:    9.43
     Image Trigger?:     NO
     Rate S/N Ratio:     21.51743479135  [ if not an image trigger ]
     Image S/N Ratio:    9.43

  Analysis Position:   [ source = BAT ]
    RA: 265.436483229163   Dec: 0.736518945680564  [deg; J2000]

  Refined Position:   [ source = BAT pre-slew burst ]
    RA: 265.42170456138   Dec: 0.737511045022157  [deg; J2000]
        { 17h 41m 41.2s , +00d 44' 15.0" }
         +/- 1.4542762881274 [arcmin] (estimated 90% radius based on SNR)
         +/- 0.612359989159808 [arcmin] (formal 1-sigma fit error)
    SNR: 17.8141716545047

  Angular difference between the analysis and refined position is 0.888643 arcmin

  Partial Coding Fraction: 0.2929688    [ including projection effects ]

  Duration
     T90: 87 +/- 20.591260281974
        Measured from: -61.7280000448227
                   to: 25.2719999551773     [s; relative to TRIGTIME]
     T50: 16 +/- 4.24264068711928
        Measured from: -7.72800004482269
                   to: 8.27199995517731     [s; relative to TRIGTIME]


  Fluence
     Peak Flux  (peak 1 second)
        Measured from: 1.27199995517731
                   to: 2.27199995517731     [s; relative to TRIGTIME]
     Total Fluence
        Measured from: -79.7280000448227
                   to: 37.2719999551773     [s; relative to TRIGTIME]

             Band 1     Band 2     Band 3     Band 4
              15-25      25-50     50-100    100-350     keV
 Total     1.703096   2.865625   1.968505   0.722571
           0.176496   0.175125   0.149392   0.118919 [error]
 Peak      0.061511   0.175653   0.114437   0.069534
           0.017343   0.018956   0.016529   0.013314 [error]

     [ fluence units of on-axis counts / fully illuminated detector ]

======================================================================


====== Table of the duration information =============================

        Value   tstart    tstop
T100  117.000  -79.728   37.272
T90    87.000  -61.728   25.272
T50    16.000   -7.728    8.272
Peak    1.000    1.272    2.272


====== Spectral Analysis Summary =====================================

Model      : spectral model: simple power-law (PL) and cutoff power-law (CPL)
Ph_index   : photon index: E^{Ph_index}
Ph_90err   : 90% error of the photon index
Epeak      : Epeak in keV
Epeak_90err: 90% error of Epeak
Norm       : normalization at 50 keV in both the PL model and CPL model
Nomr_90err : 90% error of the normalization
chi2       : Chi-Squared
dof        : degree of freedo

=== Time-averaged spectral analysis ===
(Best model with acceptable fit: PL)

Model Ph_index Ph_90err_low Ph_90err_hi  Epeak  Epeak_90err_low  Epeak_90err_hi  Norm       Nomr_90err_low    Norm_90err_hi    chi2    dof
PL      -1.458    -0.121      0.122       -           -               -         4.40e-03     -3.04e-04          3.04e-04      58.740   57
CPL     -1.390    -0.182      0.413      466.561    -466.561      -466.561      4.75e-03     -6.44e-04          2.67e-03      58.790   56


=== 1-s peak spectral analysis ===
(Best model with acceptable fit: PL)

Model Ph_index Ph_90err_low Ph_90err_hi  Epeak  Epeak_90err_low  Epeak_90err_hi  Norm       Nomr_90err_low    Norm_90err_hi    chi2    dof
PL      -1.205     -0.226     0.236       -           -               -         2.83e-02     -3.75e-03          3.74e-03      70.240   57
CPL     -1.205     -0.223     0.295     9999.360    -9999.360      -9999.360      2.84e-02     -2.84e-02          -1.83e-02      70.240   56


=== Fluence/Peak Flux Summary ===

              Model    Band1     Band2     Band3     Band4     Band5     Total
                       15-25     25-50    50-100    100-350    15-150    15-350    keV
Fluence         PL   6.31e-07  1.19e-06  1.73e-06  5.38e-06  4.92e-06  8.94e-06   erg/cm2
      90%_error_low -8.01e-08 -9.25e-08 -1.47e-07 -9.40e-07 -3.62e-07 -1.05e-06   erg/cm2
      90%_error_hi   8.32e-08  9.17e-08  1.46e-07  1.07e-06  3.63e-07  1.15e-06   erg/cm2
Peak flux       PL   8.79e-01  1.05e+00  9.14e-01  1.36e+00  3.32e+00  4.20e+00   ph/cm2/s
      90%_error_low -2.26e-01 -1.75e-01 -1.33e-01 -3.78e-01 -4.65e-01 -5.63e-01   ph/cm2/s
      90%_error_hi   2.45e-01  1.71e-01  1.32e-01  4.65e-01  4.68e-01  5.69e-01   ph/cm2/s

Fluence        CPL   6.30e-07  1.19e-06  1.74e-06  5.36e-06  4.91e-06  8.77e-06   erg/cm2
      90%_error_low -9.49e-08 -9.47e-08 -1.49e-07 -2.62e-06 -3.88e-07 -2.47e-06   erg/cm2
      90%_error_hi   4.69e-08  1.07e-07  1.62e-07  6.13e-07  3.66e-07  1.25e-06   erg/cm2
Peak flux      CPL   8.96e-01  1.05e+00  9.10e-01  1.36e+00  3.33e+00  4.25e+00   ph/cm2/s
      90%_error_low -2.46e-01 -1.40e-01 -1.31e-01 -6.02e-01 -4.79e-01 -9.59e-01   ph/cm2/s
      90%_error_hi   2.28e-01  1.89e-01  1.55e-01  4.54e-01  4.71e-01  4.92e-01   ph/cm2/s

======================================================================
Image
Pre-slew 15.0-350.0 keV image (Event data)
#   RAcent    DECcent   POSerr    Theta     Phi              Peak Cts       SNR   Name
  265.4217     0.7375   0.0108    38.8899    42.7936         8.1516094     17.814 TRIG_00814677

Foreground time interval of the image:
-79.728  24.373 (delta_t = 104.101 [sec])
Background time interval of the image:
-166.827 -79.728 (delta_t =  87.099 [sec])
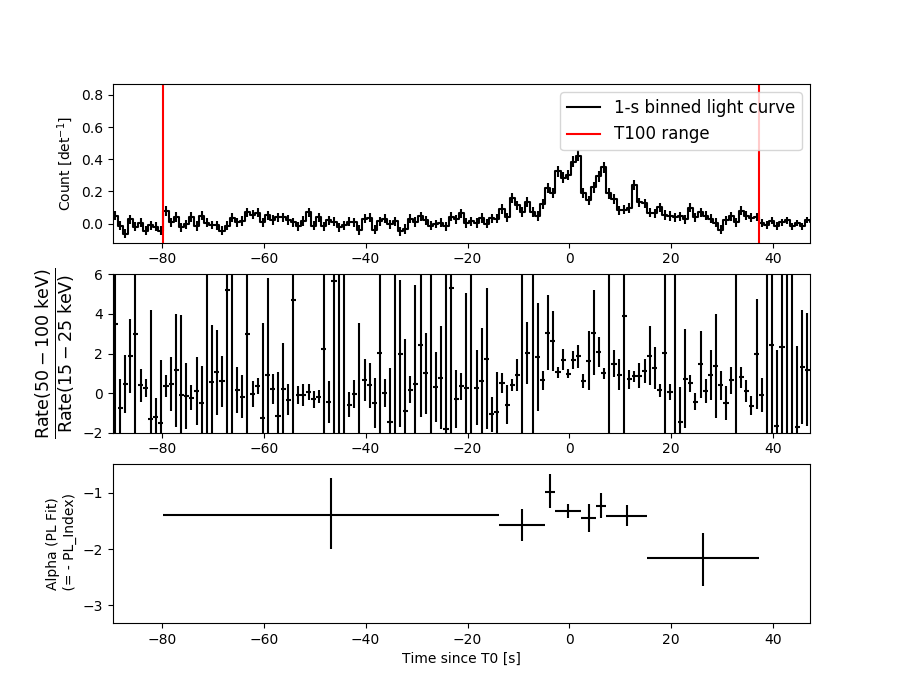
Light Curves
Note: The mask-weighted lightcurves have units of either count/det or counts/sec/det, where a det is 0.4 x 0.4 = 0.16 sq cm.
Full-time range; 1 s binning
Other quick-look light curves:
- 64 ms binning (zoomed)
- 16 ms binning (zoomed)
- 8 ms binning (zoomed)
- 2 ms binning (zoomed)
- SN=5 or 10 s binning (full-time range)
- Raw light curve
Spectra
- 64 ms binning (zoomed)
- 16 ms binning (zoomed)
- 8 ms binning (zoomed)
- 2 ms binning (zoomed)
- SN=5 or 10 s binning (full-time range)
- Raw light curve
Spectra
Notes:
- 1) The fitting includes the systematic errors.
- 2) When the burst includes telescope slew time periods, the fitting uses an average response file made from multiple 5-s response files through out the slew time plus single time preiod for the non-slew times, and weighted by the total counts in the corresponding time period using addrmf. An average response file is needed becuase a spectral fit using the pre-slew DRM will introduce some errors in both a spectral shape and a normalization if the PHA file contains a lot of the slew/post-slew time interval.
- 3) For fits to more complicated models (e.g. a power-law over a cutoff power-law), the BAT team has decided to require a chi-square improvement of more than 6 for each extra dof.
Time averaged spectrum fit using the average DRM
Power-law model
Time interval is from  -79.728 sec. to   37.272 sec.

Spectral model in power-law:
------------------------------------------------------------
Parameters  : value       lower 90%   higher 90%
Photon index: -1.45777     ( -0.12149   0.122295 )
Norm@50keV  : 4.39700E-03    ( -0.00030383   0.000303667 )
------------------------------------------------------------
#Fit statistic : Chi-Squared =          58.74 using 59 PHA bins.
# Reduced chi-squared =          1.031 for     57 degrees of freedom
# Null hypothesis probability =   4.115180e-01

Photon flux (15-150 keV)    in 117 sec: 0.542933 ( -0.039992  0.040104 ) ph/cm2/s
Energy fluence (15-150 keV)             : 4.91649e-06 ( -3.61728e-07  3.63289e-07 ) ergs/cm2
Cutoff power-law model

Time interval is from  -79.728 sec. to   37.272 sec.
Spectral model in the cutoff power-law:
------------------------------------------------------------
Parameters  : value       lower 90%   higher 90%
Photon index: -1.45444     ( -0.176962   0.417854 )
Epeak [keV] : 8969.30      ( -8894.61 -8894.61 )
Norm@50keV  : 4.41381E-03    ( -0.000306443   0.00301079 )
------------------------------------------------------------
#Fit statistic : Chi-Squared =          58.74 using 59 PHA bins.
# Reduced chi-squared =          1.049 for     56 degrees of freedom
# Null hypothesis probability =   3.754294e-01

Photon flux (15-150 keV)    in 117 sec: 0.542598 ( -0.041354  0.040517 ) ph/cm2/s
Energy fluence (15-150 keV)             : 4.9122e-06 ( -3.87539e-07  3.66245e-07 ) ergs/cm2
1-s peak spectrum fit
Power-law model
Time interval is from    1.272 sec. to    2.272 sec.

Spectral model in power-law:
------------------------------------------------------------
Parameters  : value       lower 90%   higher 90%
Photon index: -1.20511     ( -0.226142   0.235644 )
Norm@50keV  : 2.83008E-02    ( -0.0037532   0.00374399 )
------------------------------------------------------------
#Fit statistic : Chi-Squared =          70.24 using 59 PHA bins.
# Reduced chi-squared =          1.232 for     57 degrees of freedom
# Null hypothesis probability =   1.119084e-01

Photon flux (15-150 keV)    in 1 sec: 3.32436 ( -0.46548  0.46817 ) ph/cm2/s
Energy fluence (15-150 keV)             : 2.86741e-07 ( -3.99382e-08  4.01026e-08 ) ergs/cm2
Cutoff power-law model
Time interval is from    1.272 sec. to    2.272 sec.
Spectral model in the cutoff power-law:
------------------------------------------------------------
Parameters  : value       lower 90%   higher 90%
Photon index: -2.41284     ( -0.224518   0.294203 )
Epeak [keV] : 135.511      ( -9999.36 -9999.36 )
Norm@50keV  : 4.08136E-03    ( -0.00407692   0.0060101 )
------------------------------------------------------------
#Fit statistic : Chi-Squared =          69.63 using 59 PHA bins.
# Reduced chi-squared =          1.243 for     56 degrees of freedom
# Null hypothesis probability =   1.042650e-01

Photon flux (15-150 keV)    in 1 sec: 3.32871 ( -0.47892  0.47127 ) ph/cm2/s
Energy fluence (15-150 keV)             : 2.87184e-07 ( -4.05971e-08  3.51751e-08 ) ergs/cm2
Time-resolved spectra
Distribution
T90 vs. Hardness ratio plot
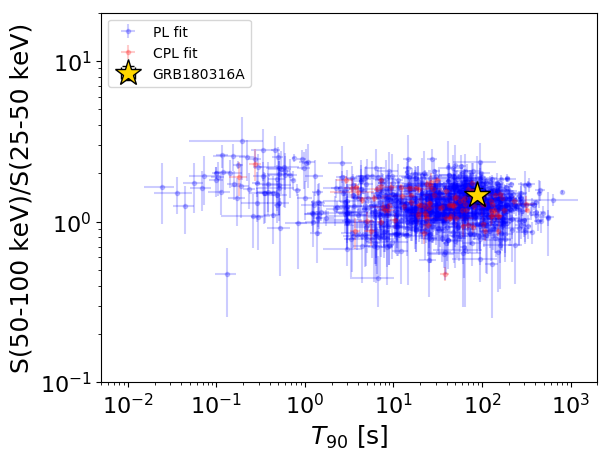
T90                                   = 87.0 sec.
Hardness ratio (energy fluence ratio) = 1.45626471982
S(15-50 keV) vs. S(50-150 keV) plot
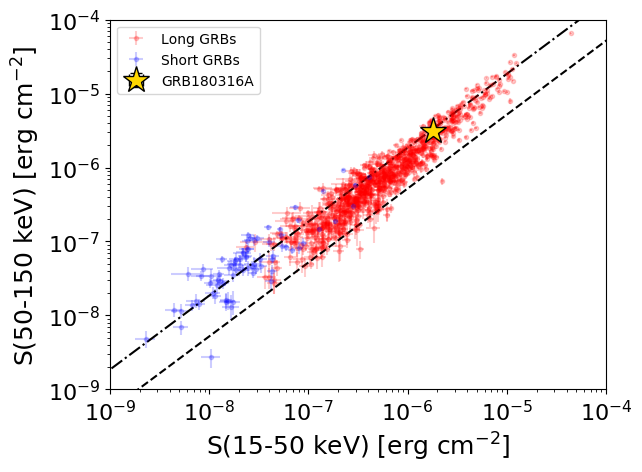
S(15-50 keV)  = 1.8219738e-06
S(50-150 keV) = 3.094561e-06
The dash-dotted line and the dashed line traces the fluences calculated from the Band function with Epeak = 15 and 150 keV, respectively. Both lines assume a canonical values of alpha = -1 and beta = -2.5.
Mask shadow pattern
IMX = 5.918939788582531E-01, IMY = -5.479761629433119E-01
Spacecraft aspect plot
Bright source in the pre-burst/pre-slew/post-slew images
Pre-burst image of 15-350 keV band
Time interval of the image:
-166.827400 -79.728000

# RAcent  DECcent POSerr Theta    Phi  PeakCts   SNR AngSep     Name
#  [deg]    [deg]    ['] [deg]  [deg]                   [']
254.4075  35.2161   17.9  39.2  101.5  -0.4302  -0.6    8.0	Her X-1
268.3728  -1.4557   85.3  38.1   37.0  -0.0396  -0.1    0.3	SW J1753.5-0127
270.3493 -25.1386   75.3  55.6   14.6  -0.1423  -0.2    5.0	GX 5-1
273.9285 -14.1655    7.7  44.4   18.3  -0.4732  -1.5    9.0	GX 17+2
285.1234 -24.9916    4.9  50.2   -0.8  -0.9281  -2.4    6.4	HT1900.1-2455
288.7729  10.9644    1.5  15.3   20.0   1.2957   7.8    1.9	GRS 1915+105
299.5693  35.1914    0.6  11.7  171.0   3.3138  20.9    1.2	Cyg X-1
308.0590  40.9110    2.2  19.3 -172.0   0.8860   5.3    3.4	Cyg X-3
326.1684  38.1818    7.6  28.1 -143.7   0.2899   1.5    8.4	Cyg X-2
258.1880  67.3566    2.6  50.1  145.4   3.6848   4.4 ------	UNKNOWN
275.0951   7.1891    0.5  27.3   40.8   5.4665  25.4 ------	UNKNOWN
359.5707  55.4390    2.9  54.8 -158.2   2.9791   4.0 ------	UNKNOWN
  2.5623  54.8266    5.1  56.4 -157.2   2.4276   2.3 ------	UNKNOWN
Pre-slew background subtracted image of 15-350 keV band
Time interval of the image:
-79.728000 24.372590

# RAcent  DECcent POSerr Theta    Phi  PeakCts   SNR AngSep     Name
#  [deg]    [deg]    ['] [deg]  [deg]                   [']
254.2830  35.2682    8.1  39.4  101.5   1.2795   1.4    9.6	Her X-1
268.2575  -1.4906    5.7  38.2   37.1  -0.8383  -2.0    7.0	SW J1753.5-0127
270.3567 -25.2519    8.8  55.7   14.5   1.8379   1.3   11.1	GX 5-1
273.9597 -14.1183   12.7  44.4   18.3   0.4229   0.9    5.6	GX 17+2
285.0718 -24.9208  264.8  50.1   -0.7   0.0228   0.0    1.9	HT1900.1-2455
288.9745  11.0536    4.9  15.1   19.6  -0.5060  -2.3   12.2	GRS 1915+105
299.5385  35.3706   10.9  11.8  170.8   0.2368   1.0   10.5	Cyg X-1
307.9647  40.8791    3.1  19.2 -172.1  -0.7860  -3.7    7.9	Cyg X-3
326.0627  38.4584    6.9  28.2 -144.3  -0.4325  -1.7    9.7	Cyg X-2
265.4217   0.7375    0.6  38.9   42.8   8.1528  17.8 ------	UNKNOWN
275.0371   7.1583    2.3  27.4   40.9   1.3992   5.0 ------	UNKNOWN
336.0311  52.4187    2.0  40.8 -160.7   2.0002   5.7 ------	UNKNOWN
351.0853  34.9959    2.7  47.2 -132.5   3.5651   4.3 ------	UNKNOWN
Post-slew image of 15-350 keV band
Time interval of the image:
81.772600 962.348600

# RAcent  DECcent POSerr Theta    Phi  PeakCts   SNR AngSep     Name
#  [deg]    [deg]    ['] [deg]  [deg]                   [']
244.9837 -15.6353    0.3  26.0   48.6  62.1457  39.6    0.4	Sco X-1
254.3043  35.3060    8.8  36.1  162.9  -2.4989  -1.3    7.8	Her X-1
255.9872 -37.8514    1.8  39.6   10.2  10.4967   6.6    0.4	4U 1700-377
256.5772 -36.5821    6.7  38.2   10.0   2.7886   1.7   11.7	GX 349+2
262.8649 -24.5968   76.7  25.5    3.9  -0.1807  -0.2   11.9	GX 1+4
264.6026 -44.3081   17.7  45.0   -0.7   1.4931   0.7   10.4	4U 1735-44
268.3376  -1.5064    9.4   3.6  -53.7   1.4136   1.2    3.7	SW J1753.5-0127
270.4324 -24.9283  493.9  26.1  -11.9  -0.0282  -0.0   12.1	GX 5-1
270.2270 -25.8150    3.6  26.9  -11.1   3.8489   3.2    5.9	GRS 1758-258
273.8681 -13.9305    9.8  16.9  -30.9   1.3725   1.2   10.2	GX 17+2
275.7772 -30.3253    6.2  32.6  -18.3   2.4618   1.9    8.0	H1820-303
284.9300 -25.0757    7.0  32.0  -36.4   2.3954   1.7   11.0	HT1900.1-2455
288.7880  10.9236    1.3  25.3 -116.2  13.7434   8.6    1.4	GRS 1915+105
299.5731  35.2065    1.0  46.9 -142.7  38.5955  11.1    0.9	Cyg X-1
262.8847 -33.7696    7.8  34.6    2.2   2.0472   1.5    6.5	GX 354-0
276.4576  52.9643    2.3  53.0 -173.3  17.8952   5.0 ------	UNKNOWN
275.0876   7.1899    0.2  11.6 -125.8  57.5087  48.9 ------	UNKNOWN
275.3741 -14.5339    2.6  18.1  -33.9   5.1298   4.5 ------	UNKNOWN
288.7247  -7.3181    3.1  24.6  -72.1   6.0177   3.7 ------	UNKNOWN
305.0594  31.7070    3.3  48.5 -135.2  16.1020   3.5 ------	UNKNOWN
306.4324   5.1381    4.3  41.1  -98.6  14.7247   2.7 ------	UNKNOWN
	UNKNOWN